
Key Insights
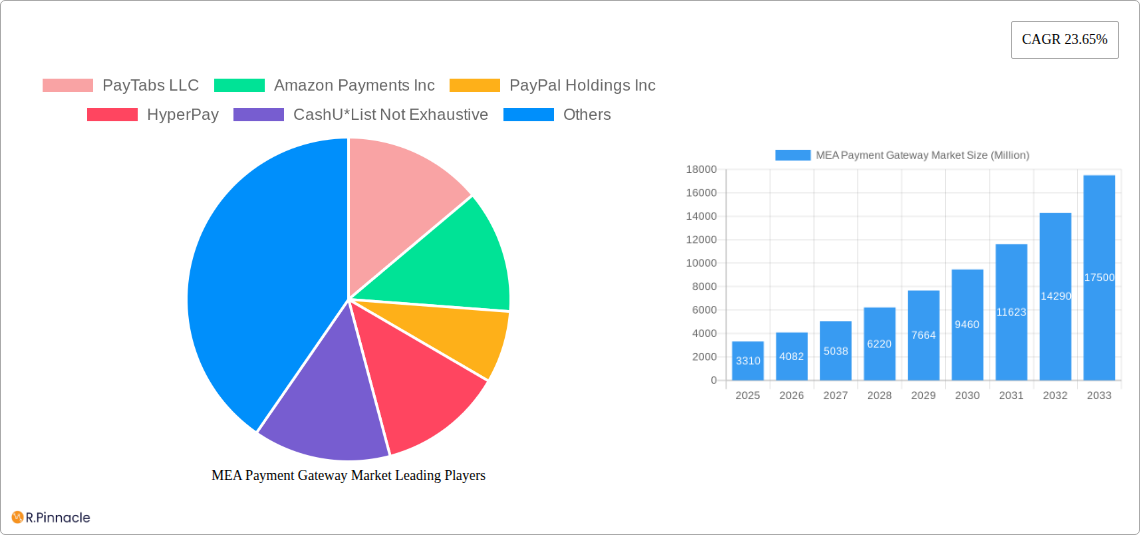
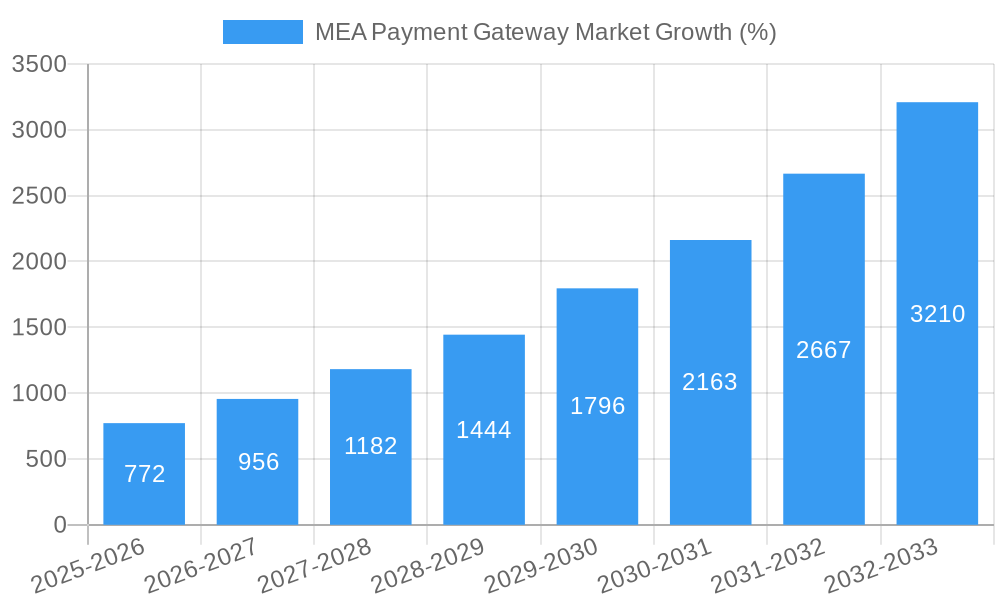
The Middle East and Africa (MEA) payment gateway market is experiencing robust growth, projected to reach a market size of $3.31 billion in 2025, exhibiting a Compound Annual Growth Rate (CAGR) of 23.65% from 2019 to 2033. This surge is fueled by several key factors. The rapid expansion of e-commerce across the MEA region, driven by increasing internet and smartphone penetration, is a significant driver. Consumers are increasingly adopting digital payment methods for convenience and security, leading to a higher transaction volume processed through payment gateways. Furthermore, the rise of mobile money and fintech innovations, particularly in underserved markets, is creating new opportunities for growth. Governments' initiatives to promote digital financial inclusion and supportive regulatory environments are also contributing to market expansion. However, challenges remain, including concerns around cybersecurity and data privacy, as well as the varying levels of digital literacy and infrastructure across different MEA countries. Competition among established players like PayPal, Amazon Payments, and PayTabs, alongside emerging local fintech companies, is intensifying, pushing innovation and driving down costs for businesses. The market is segmented by payment type (credit/debit cards, mobile wallets, bank transfers, etc.), transaction value, business size, and country-specific variations. The forecast period of 2025-2033 suggests continued substantial growth, driven by sustained economic development and the ongoing digital transformation within the region.
The future trajectory of the MEA payment gateway market looks promising. The increasing adoption of online shopping, coupled with the growth of the gig economy and the expansion of digital services, will further stimulate demand. Innovation in areas such as biometric authentication and AI-powered fraud prevention will enhance security and trust, attracting even more users. Furthermore, the integration of payment gateways with other financial technologies, such as Buy Now, Pay Later (BNPL) services, is expected to significantly contribute to market expansion. However, it is crucial for stakeholders to address challenges related to infrastructure limitations, regulatory frameworks, and cybersecurity threats to ensure sustainable and inclusive growth across the diverse regions of the MEA market. The competitive landscape will remain dynamic, requiring players to continuously adapt to evolving consumer preferences and technological advancements.
MEA Payment Gateway Market Report: A Comprehensive Analysis (2019-2033)
This in-depth report provides a comprehensive analysis of the MEA Payment Gateway Market, offering actionable insights for industry professionals, investors, and strategic decision-makers. The study covers the period 2019-2033, with a focus on the base year 2025 and a forecast period of 2025-2033. Discover key trends, growth drivers, challenges, and opportunities shaping this dynamic market.
MEA Payment Gateway Market Structure & Innovation Trends
The MEA Payment Gateway Market exhibits a moderately concentrated structure, with key players like PayTabs LLC, Amazon Payments Inc, PayPal Holdings Inc, HyperPay, and CashU holding significant market share. However, the market is also characterized by the presence of numerous smaller players and startups, fostering competition and innovation. Market concentration is estimated at xx% in 2025, with the top 5 players accounting for approximately xx Million in revenue. Innovation is driven by factors including the increasing adoption of digital payments, evolving consumer preferences, and supportive regulatory frameworks in certain MEA countries. The market has witnessed several mergers and acquisitions (M&A) in recent years, with deal values exceeding xx Million in 2024 alone. These M&A activities reflect the strategic importance of payment gateways and the drive for market consolidation. Product substitutes include alternative payment methods such as mobile wallets and bank transfers, posing a competitive threat to traditional payment gateways. End-user demographics are diverse, encompassing businesses of all sizes, from SMEs to large enterprises, along with individual consumers across various age groups and income levels. Regulatory frameworks differ across MEA countries, impacting market dynamics and creating both opportunities and challenges.
- Market Share: Top 5 players holding approximately xx% in 2025.
- M&A Activity: Deal values exceeding xx Million in 2024.
- Innovation Drivers: Digital payment adoption, consumer preferences, regulatory changes.
- Product Substitutes: Mobile wallets, bank transfers.
MEA Payment Gateway Market Dynamics & Trends
The MEA Payment Gateway Market is experiencing robust growth, fueled by several key factors. The rising adoption of e-commerce and online transactions is a primary driver, creating increased demand for secure and reliable payment processing solutions. The region's burgeoning digital economy, coupled with increasing smartphone penetration and internet access, further fuels this growth. Technological disruptions, such as the emergence of innovative payment technologies (e.g., biometric authentication, blockchain-based solutions), are transforming the market landscape. Consumer preferences are shifting towards convenient, secure, and user-friendly payment options, driving the adoption of mobile payment solutions and contactless payments. Competitive dynamics are characterized by intense competition among established players and emerging fintech companies. The market is projected to exhibit a Compound Annual Growth Rate (CAGR) of xx% during the forecast period (2025-2033), with market penetration expected to reach xx% by 2033.
Dominant Regions & Segments in MEA Payment Gateway Market
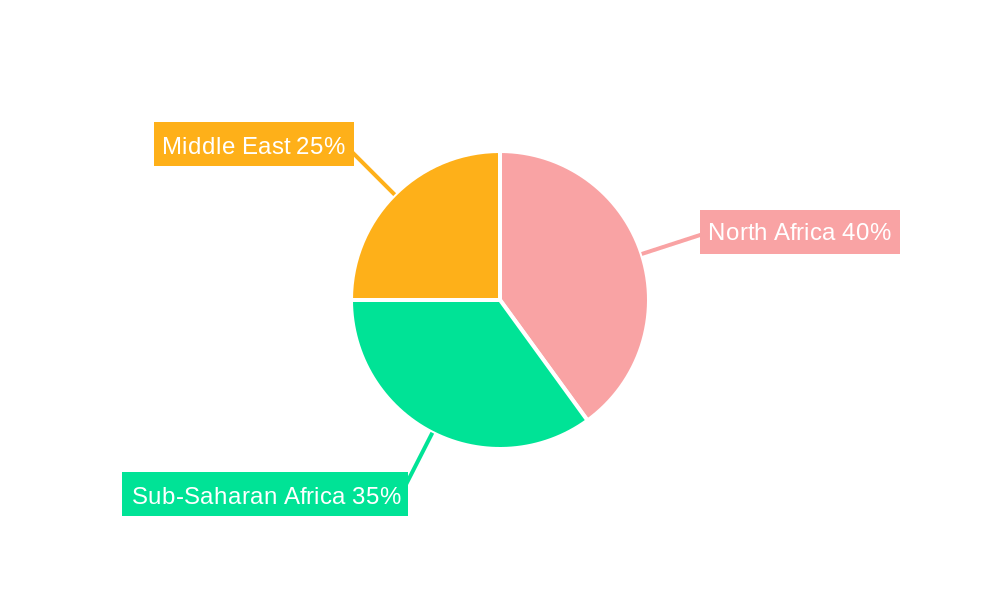
The UAE and Saudi Arabia are currently the dominant regions within the MEA Payment Gateway Market, driven by their advanced digital infrastructure, strong e-commerce sectors, and supportive government policies promoting financial technology innovation. Other key markets include Egypt, South Africa, and Nigeria.
- Key Drivers in Dominant Regions:
- UAE: Robust digital infrastructure, thriving e-commerce sector, government initiatives supporting fintech.
- Saudi Arabia: Government's Vision 2030, focus on digital transformation, growing e-commerce adoption.
- Dominance Analysis: Strong regulatory frameworks, favorable economic conditions, and a high concentration of tech-savvy consumers contribute to the dominance of the UAE and Saudi Arabia.
MEA Payment Gateway Market Product Innovations
Recent product innovations in the MEA payment gateway market include the integration of advanced security features, such as fraud detection and prevention systems, and the development of user-friendly mobile applications that streamline payment processes. The integration of AI and machine learning is also enhancing efficiency and personalization. These innovations address growing market needs for enhanced security, convenience, and speed, improving customer experience and enhancing competitive advantages.
Report Scope & Segmentation Analysis
This report segments the MEA Payment Gateway Market based on several key parameters, including payment type (credit/debit cards, mobile wallets, bank transfers), deployment type (cloud-based, on-premise), enterprise size (SMEs, large enterprises), and industry vertical (e-commerce, retail, travel, etc.). Each segment exhibits unique growth dynamics and competitive landscapes. For instance, the mobile wallet segment is anticipated to experience the highest CAGR during the forecast period, driven by the widespread adoption of smartphones and mobile payment solutions. The market size of each segment is detailed in the report, along with growth projections and competitive analysis.
Key Drivers of MEA Payment Gateway Market Growth
Several key factors are driving the growth of the MEA Payment Gateway Market. These include the rapid expansion of the e-commerce sector, increasing smartphone penetration, rising internet adoption, and supportive government regulations promoting digital financial inclusion. Furthermore, the growing adoption of mobile payment solutions and contactless payments, coupled with technological advancements, is fueling market expansion. The shift towards digitalization across various industries further strengthens market growth.
Challenges in the MEA Payment Gateway Market Sector
The MEA Payment Gateway Market faces several challenges, including regulatory hurdles, varying infrastructure across different regions, cybersecurity threats, and intense competition. Lack of awareness and trust in digital payments in certain segments of the population also poses a barrier. The cost of implementation and maintenance of payment gateway systems can be high for smaller businesses, thus limiting adoption.
Emerging Opportunities in MEA Payment Gateway Market
The MEA Payment Gateway Market presents numerous opportunities, including the expansion into underserved markets, the adoption of innovative payment technologies like blockchain and AI, and the growth of cross-border payment solutions. There is significant potential for the development of specialized payment solutions tailored to specific industries and consumer needs. The rising adoption of Buy Now Pay Later (BNPL) solutions also presents a substantial opportunity.
Leading Players in the MEA Payment Gateway Market Market
- PayTabs LLC
- Amazon Payments Inc
- PayPal Holdings Inc
- HyperPay
- CashU
Key Developments in MEA Payment Gateway Market Industry
- September 2024: Barq partners with Mastercard to enhance payment acceptance solutions for merchants and consumers in Saudi Arabia, focusing on cross-border services and remittances.
- June 2024: CellPoint Digital partners with Riyadh Air to provide cutting-edge payment technology, supporting Riyadh Air's digital-first strategy.
Future Outlook for MEA Payment Gateway Market Market
The MEA Payment Gateway Market is poised for continued growth, driven by increasing digitalization, expanding e-commerce activities, and supportive government policies. Strategic investments in infrastructure, technology, and cybersecurity will be crucial for sustained growth. The market will likely witness further consolidation through mergers and acquisitions, as companies strive for scale and market share. Innovation in areas like AI, blockchain, and mobile payment technologies will remain key to future success.
MEA Payment Gateway Market Segmentation
-
1. Type
- 1.1. Hosted
- 1.2. Non-Hosted
-
2. Enterprise
- 2.1. Small and Medium Enterprise (SME)
- 2.2. Large Enterprise
-
3. End User
- 3.1. Travel
- 3.2. Retail
- 3.3. BFSI
- 3.4. Media and Entertainment
- 3.5. Other End Users
-
4. Geography
- 4.1. Saudi Arabia
- 4.2. Israel
- 4.3. Qatar
- 4.4. United Arab Emirates
- 4.5. Rest of MEA
MEA Payment Gateway Market Segmentation By Geography
- 1. Saudi Arabia
- 2. Israel
- 3. Qatar
- 4. United Arab Emirates
- 5. Rest of MEA
MEA Payment Gateway Market REPORT HIGHLIGHTS
| Aspects | Details |
|---|---|
| Study Period | 2019-2033 |
| Base Year | 2024 |
| Estimated Year | 2025 |
| Forecast Period | 2025-2033 |
| Historical Period | 2019-2024 |
| Growth Rate | CAGR of 23.65% from 2019-2033 |
| Segmentation |
|
Table of Contents
- 1. Introduction
- 1.1. Research Scope
- 1.2. Market Segmentation
- 1.3. Research Methodology
- 1.4. Definitions and Assumptions
- 2. Executive Summary
- 2.1. Introduction
- 3. Market Dynamics
- 3.1. Introduction
- 3.2. Market Drivers
- 3.2.1. Increased E-commerce Sales and High Internet Penetration Rate; Increased Demand for Mobile-based Payments; Growing Adoption of Payment Gateways in Retail
- 3.3. Market Restrains
- 3.3.1. Increased E-commerce Sales and High Internet Penetration Rate; Increased Demand for Mobile-based Payments; Growing Adoption of Payment Gateways in Retail
- 3.4. Market Trends
- 3.4.1. Increased E-commerce Sales and High Internet Penetration Rate
- 4. Market Factor Analysis
- 4.1. Porters Five Forces
- 4.2. Supply/Value Chain
- 4.3. PESTEL analysis
- 4.4. Market Entropy
- 4.5. Patent/Trademark Analysis
- 5. Global MEA Payment Gateway Market Analysis, Insights and Forecast, 2019-2031
- 5.1. Market Analysis, Insights and Forecast - by Type
- 5.1.1. Hosted
- 5.1.2. Non-Hosted
- 5.2. Market Analysis, Insights and Forecast - by Enterprise
- 5.2.1. Small and Medium Enterprise (SME)
- 5.2.2. Large Enterprise
- 5.3. Market Analysis, Insights and Forecast - by End User
- 5.3.1. Travel
- 5.3.2. Retail
- 5.3.3. BFSI
- 5.3.4. Media and Entertainment
- 5.3.5. Other End Users
- 5.4. Market Analysis, Insights and Forecast - by Geography
- 5.4.1. Saudi Arabia
- 5.4.2. Israel
- 5.4.3. Qatar
- 5.4.4. United Arab Emirates
- 5.4.5. Rest of MEA
- 5.5. Market Analysis, Insights and Forecast - by Region
- 5.5.1. Saudi Arabia
- 5.5.2. Israel
- 5.5.3. Qatar
- 5.5.4. United Arab Emirates
- 5.5.5. Rest of MEA
- 5.1. Market Analysis, Insights and Forecast - by Type
- 6. Saudi Arabia MEA Payment Gateway Market Analysis, Insights and Forecast, 2019-2031
- 6.1. Market Analysis, Insights and Forecast - by Type
- 6.1.1. Hosted
- 6.1.2. Non-Hosted
- 6.2. Market Analysis, Insights and Forecast - by Enterprise
- 6.2.1. Small and Medium Enterprise (SME)
- 6.2.2. Large Enterprise
- 6.3. Market Analysis, Insights and Forecast - by End User
- 6.3.1. Travel
- 6.3.2. Retail
- 6.3.3. BFSI
- 6.3.4. Media and Entertainment
- 6.3.5. Other End Users
- 6.4. Market Analysis, Insights and Forecast - by Geography
- 6.4.1. Saudi Arabia
- 6.4.2. Israel
- 6.4.3. Qatar
- 6.4.4. United Arab Emirates
- 6.4.5. Rest of MEA
- 6.1. Market Analysis, Insights and Forecast - by Type
- 7. Israel MEA Payment Gateway Market Analysis, Insights and Forecast, 2019-2031
- 7.1. Market Analysis, Insights and Forecast - by Type
- 7.1.1. Hosted
- 7.1.2. Non-Hosted
- 7.2. Market Analysis, Insights and Forecast - by Enterprise
- 7.2.1. Small and Medium Enterprise (SME)
- 7.2.2. Large Enterprise
- 7.3. Market Analysis, Insights and Forecast - by End User
- 7.3.1. Travel
- 7.3.2. Retail
- 7.3.3. BFSI
- 7.3.4. Media and Entertainment
- 7.3.5. Other End Users
- 7.4. Market Analysis, Insights and Forecast - by Geography
- 7.4.1. Saudi Arabia
- 7.4.2. Israel
- 7.4.3. Qatar
- 7.4.4. United Arab Emirates
- 7.4.5. Rest of MEA
- 7.1. Market Analysis, Insights and Forecast - by Type
- 8. Qatar MEA Payment Gateway Market Analysis, Insights and Forecast, 2019-2031
- 8.1. Market Analysis, Insights and Forecast - by Type
- 8.1.1. Hosted
- 8.1.2. Non-Hosted
- 8.2. Market Analysis, Insights and Forecast - by Enterprise
- 8.2.1. Small and Medium Enterprise (SME)
- 8.2.2. Large Enterprise
- 8.3. Market Analysis, Insights and Forecast - by End User
- 8.3.1. Travel
- 8.3.2. Retail
- 8.3.3. BFSI
- 8.3.4. Media and Entertainment
- 8.3.5. Other End Users
- 8.4. Market Analysis, Insights and Forecast - by Geography
- 8.4.1. Saudi Arabia
- 8.4.2. Israel
- 8.4.3. Qatar
- 8.4.4. United Arab Emirates
- 8.4.5. Rest of MEA
- 8.1. Market Analysis, Insights and Forecast - by Type
- 9. United Arab Emirates MEA Payment Gateway Market Analysis, Insights and Forecast, 2019-2031
- 9.1. Market Analysis, Insights and Forecast - by Type
- 9.1.1. Hosted
- 9.1.2. Non-Hosted
- 9.2. Market Analysis, Insights and Forecast - by Enterprise
- 9.2.1. Small and Medium Enterprise (SME)
- 9.2.2. Large Enterprise
- 9.3. Market Analysis, Insights and Forecast - by End User
- 9.3.1. Travel
- 9.3.2. Retail
- 9.3.3. BFSI
- 9.3.4. Media and Entertainment
- 9.3.5. Other End Users
- 9.4. Market Analysis, Insights and Forecast - by Geography
- 9.4.1. Saudi Arabia
- 9.4.2. Israel
- 9.4.3. Qatar
- 9.4.4. United Arab Emirates
- 9.4.5. Rest of MEA
- 9.1. Market Analysis, Insights and Forecast - by Type
- 10. Rest of MEA MEA Payment Gateway Market Analysis, Insights and Forecast, 2019-2031
- 10.1. Market Analysis, Insights and Forecast - by Type
- 10.1.1. Hosted
- 10.1.2. Non-Hosted
- 10.2. Market Analysis, Insights and Forecast - by Enterprise
- 10.2.1. Small and Medium Enterprise (SME)
- 10.2.2. Large Enterprise
- 10.3. Market Analysis, Insights and Forecast - by End User
- 10.3.1. Travel
- 10.3.2. Retail
- 10.3.3. BFSI
- 10.3.4. Media and Entertainment
- 10.3.5. Other End Users
- 10.4. Market Analysis, Insights and Forecast - by Geography
- 10.4.1. Saudi Arabia
- 10.4.2. Israel
- 10.4.3. Qatar
- 10.4.4. United Arab Emirates
- 10.4.5. Rest of MEA
- 10.1. Market Analysis, Insights and Forecast - by Type
- 11. Competitive Analysis
- 11.1. Global Market Share Analysis 2024
- 11.2. Company Profiles
- 11.2.1 PayTabs LLC
- 11.2.1.1. Overview
- 11.2.1.2. Products
- 11.2.1.3. SWOT Analysis
- 11.2.1.4. Recent Developments
- 11.2.1.5. Financials (Based on Availability)
- 11.2.2 Amazon Payments Inc
- 11.2.2.1. Overview
- 11.2.2.2. Products
- 11.2.2.3. SWOT Analysis
- 11.2.2.4. Recent Developments
- 11.2.2.5. Financials (Based on Availability)
- 11.2.3 PayPal Holdings Inc
- 11.2.3.1. Overview
- 11.2.3.2. Products
- 11.2.3.3. SWOT Analysis
- 11.2.3.4. Recent Developments
- 11.2.3.5. Financials (Based on Availability)
- 11.2.4 HyperPay
- 11.2.4.1. Overview
- 11.2.4.2. Products
- 11.2.4.3. SWOT Analysis
- 11.2.4.4. Recent Developments
- 11.2.4.5. Financials (Based on Availability)
- 11.2.5 CashU*List Not Exhaustive
- 11.2.5.1. Overview
- 11.2.5.2. Products
- 11.2.5.3. SWOT Analysis
- 11.2.5.4. Recent Developments
- 11.2.5.5. Financials (Based on Availability)
- 11.2.1 PayTabs LLC
List of Figures
- Figure 1: Global MEA Payment Gateway Market Revenue Breakdown (Million, %) by Region 2024 & 2032
- Figure 2: Global MEA Payment Gateway Market Volume Breakdown (Billion, %) by Region 2024 & 2032
- Figure 3: Saudi Arabia MEA Payment Gateway Market Revenue (Million), by Type 2024 & 2032
- Figure 4: Saudi Arabia MEA Payment Gateway Market Volume (Billion), by Type 2024 & 2032
- Figure 5: Saudi Arabia MEA Payment Gateway Market Revenue Share (%), by Type 2024 & 2032
- Figure 6: Saudi Arabia MEA Payment Gateway Market Volume Share (%), by Type 2024 & 2032
- Figure 7: Saudi Arabia MEA Payment Gateway Market Revenue (Million), by Enterprise 2024 & 2032
- Figure 8: Saudi Arabia MEA Payment Gateway Market Volume (Billion), by Enterprise 2024 & 2032
- Figure 9: Saudi Arabia MEA Payment Gateway Market Revenue Share (%), by Enterprise 2024 & 2032
- Figure 10: Saudi Arabia MEA Payment Gateway Market Volume Share (%), by Enterprise 2024 & 2032
- Figure 11: Saudi Arabia MEA Payment Gateway Market Revenue (Million), by End User 2024 & 2032
- Figure 12: Saudi Arabia MEA Payment Gateway Market Volume (Billion), by End User 2024 & 2032
- Figure 13: Saudi Arabia MEA Payment Gateway Market Revenue Share (%), by End User 2024 & 2032
- Figure 14: Saudi Arabia MEA Payment Gateway Market Volume Share (%), by End User 2024 & 2032
- Figure 15: Saudi Arabia MEA Payment Gateway Market Revenue (Million), by Geography 2024 & 2032
- Figure 16: Saudi Arabia MEA Payment Gateway Market Volume (Billion), by Geography 2024 & 2032
- Figure 17: Saudi Arabia MEA Payment Gateway Market Revenue Share (%), by Geography 2024 & 2032
- Figure 18: Saudi Arabia MEA Payment Gateway Market Volume Share (%), by Geography 2024 & 2032
- Figure 19: Saudi Arabia MEA Payment Gateway Market Revenue (Million), by Country 2024 & 2032
- Figure 20: Saudi Arabia MEA Payment Gateway Market Volume (Billion), by Country 2024 & 2032
- Figure 21: Saudi Arabia MEA Payment Gateway Market Revenue Share (%), by Country 2024 & 2032
- Figure 22: Saudi Arabia MEA Payment Gateway Market Volume Share (%), by Country 2024 & 2032
- Figure 23: Israel MEA Payment Gateway Market Revenue (Million), by Type 2024 & 2032
- Figure 24: Israel MEA Payment Gateway Market Volume (Billion), by Type 2024 & 2032
- Figure 25: Israel MEA Payment Gateway Market Revenue Share (%), by Type 2024 & 2032
- Figure 26: Israel MEA Payment Gateway Market Volume Share (%), by Type 2024 & 2032
- Figure 27: Israel MEA Payment Gateway Market Revenue (Million), by Enterprise 2024 & 2032
- Figure 28: Israel MEA Payment Gateway Market Volume (Billion), by Enterprise 2024 & 2032
- Figure 29: Israel MEA Payment Gateway Market Revenue Share (%), by Enterprise 2024 & 2032
- Figure 30: Israel MEA Payment Gateway Market Volume Share (%), by Enterprise 2024 & 2032
- Figure 31: Israel MEA Payment Gateway Market Revenue (Million), by End User 2024 & 2032
- Figure 32: Israel MEA Payment Gateway Market Volume (Billion), by End User 2024 & 2032
- Figure 33: Israel MEA Payment Gateway Market Revenue Share (%), by End User 2024 & 2032
- Figure 34: Israel MEA Payment Gateway Market Volume Share (%), by End User 2024 & 2032
- Figure 35: Israel MEA Payment Gateway Market Revenue (Million), by Geography 2024 & 2032
- Figure 36: Israel MEA Payment Gateway Market Volume (Billion), by Geography 2024 & 2032
- Figure 37: Israel MEA Payment Gateway Market Revenue Share (%), by Geography 2024 & 2032
- Figure 38: Israel MEA Payment Gateway Market Volume Share (%), by Geography 2024 & 2032
- Figure 39: Israel MEA Payment Gateway Market Revenue (Million), by Country 2024 & 2032
- Figure 40: Israel MEA Payment Gateway Market Volume (Billion), by Country 2024 & 2032
- Figure 41: Israel MEA Payment Gateway Market Revenue Share (%), by Country 2024 & 2032
- Figure 42: Israel MEA Payment Gateway Market Volume Share (%), by Country 2024 & 2032
- Figure 43: Qatar MEA Payment Gateway Market Revenue (Million), by Type 2024 & 2032
- Figure 44: Qatar MEA Payment Gateway Market Volume (Billion), by Type 2024 & 2032
- Figure 45: Qatar MEA Payment Gateway Market Revenue Share (%), by Type 2024 & 2032
- Figure 46: Qatar MEA Payment Gateway Market Volume Share (%), by Type 2024 & 2032
- Figure 47: Qatar MEA Payment Gateway Market Revenue (Million), by Enterprise 2024 & 2032
- Figure 48: Qatar MEA Payment Gateway Market Volume (Billion), by Enterprise 2024 & 2032
- Figure 49: Qatar MEA Payment Gateway Market Revenue Share (%), by Enterprise 2024 & 2032
- Figure 50: Qatar MEA Payment Gateway Market Volume Share (%), by Enterprise 2024 & 2032
- Figure 51: Qatar MEA Payment Gateway Market Revenue (Million), by End User 2024 & 2032
- Figure 52: Qatar MEA Payment Gateway Market Volume (Billion), by End User 2024 & 2032
- Figure 53: Qatar MEA Payment Gateway Market Revenue Share (%), by End User 2024 & 2032
- Figure 54: Qatar MEA Payment Gateway Market Volume Share (%), by End User 2024 & 2032
- Figure 55: Qatar MEA Payment Gateway Market Revenue (Million), by Geography 2024 & 2032
- Figure 56: Qatar MEA Payment Gateway Market Volume (Billion), by Geography 2024 & 2032
- Figure 57: Qatar MEA Payment Gateway Market Revenue Share (%), by Geography 2024 & 2032
- Figure 58: Qatar MEA Payment Gateway Market Volume Share (%), by Geography 2024 & 2032
- Figure 59: Qatar MEA Payment Gateway Market Revenue (Million), by Country 2024 & 2032
- Figure 60: Qatar MEA Payment Gateway Market Volume (Billion), by Country 2024 & 2032
- Figure 61: Qatar MEA Payment Gateway Market Revenue Share (%), by Country 2024 & 2032
- Figure 62: Qatar MEA Payment Gateway Market Volume Share (%), by Country 2024 & 2032
- Figure 63: United Arab Emirates MEA Payment Gateway Market Revenue (Million), by Type 2024 & 2032
- Figure 64: United Arab Emirates MEA Payment Gateway Market Volume (Billion), by Type 2024 & 2032
- Figure 65: United Arab Emirates MEA Payment Gateway Market Revenue Share (%), by Type 2024 & 2032
- Figure 66: United Arab Emirates MEA Payment Gateway Market Volume Share (%), by Type 2024 & 2032
- Figure 67: United Arab Emirates MEA Payment Gateway Market Revenue (Million), by Enterprise 2024 & 2032
- Figure 68: United Arab Emirates MEA Payment Gateway Market Volume (Billion), by Enterprise 2024 & 2032
- Figure 69: United Arab Emirates MEA Payment Gateway Market Revenue Share (%), by Enterprise 2024 & 2032
- Figure 70: United Arab Emirates MEA Payment Gateway Market Volume Share (%), by Enterprise 2024 & 2032
- Figure 71: United Arab Emirates MEA Payment Gateway Market Revenue (Million), by End User 2024 & 2032
- Figure 72: United Arab Emirates MEA Payment Gateway Market Volume (Billion), by End User 2024 & 2032
- Figure 73: United Arab Emirates MEA Payment Gateway Market Revenue Share (%), by End User 2024 & 2032
- Figure 74: United Arab Emirates MEA Payment Gateway Market Volume Share (%), by End User 2024 & 2032
- Figure 75: United Arab Emirates MEA Payment Gateway Market Revenue (Million), by Geography 2024 & 2032
- Figure 76: United Arab Emirates MEA Payment Gateway Market Volume (Billion), by Geography 2024 & 2032
- Figure 77: United Arab Emirates MEA Payment Gateway Market Revenue Share (%), by Geography 2024 & 2032
- Figure 78: United Arab Emirates MEA Payment Gateway Market Volume Share (%), by Geography 2024 & 2032
- Figure 79: United Arab Emirates MEA Payment Gateway Market Revenue (Million), by Country 2024 & 2032
- Figure 80: United Arab Emirates MEA Payment Gateway Market Volume (Billion), by Country 2024 & 2032
- Figure 81: United Arab Emirates MEA Payment Gateway Market Revenue Share (%), by Country 2024 & 2032
- Figure 82: United Arab Emirates MEA Payment Gateway Market Volume Share (%), by Country 2024 & 2032
- Figure 83: Rest of MEA MEA Payment Gateway Market Revenue (Million), by Type 2024 & 2032
- Figure 84: Rest of MEA MEA Payment Gateway Market Volume (Billion), by Type 2024 & 2032
- Figure 85: Rest of MEA MEA Payment Gateway Market Revenue Share (%), by Type 2024 & 2032
- Figure 86: Rest of MEA MEA Payment Gateway Market Volume Share (%), by Type 2024 & 2032
- Figure 87: Rest of MEA MEA Payment Gateway Market Revenue (Million), by Enterprise 2024 & 2032
- Figure 88: Rest of MEA MEA Payment Gateway Market Volume (Billion), by Enterprise 2024 & 2032
- Figure 89: Rest of MEA MEA Payment Gateway Market Revenue Share (%), by Enterprise 2024 & 2032
- Figure 90: Rest of MEA MEA Payment Gateway Market Volume Share (%), by Enterprise 2024 & 2032
- Figure 91: Rest of MEA MEA Payment Gateway Market Revenue (Million), by End User 2024 & 2032
- Figure 92: Rest of MEA MEA Payment Gateway Market Volume (Billion), by End User 2024 & 2032
- Figure 93: Rest of MEA MEA Payment Gateway Market Revenue Share (%), by End User 2024 & 2032
- Figure 94: Rest of MEA MEA Payment Gateway Market Volume Share (%), by End User 2024 & 2032
- Figure 95: Rest of MEA MEA Payment Gateway Market Revenue (Million), by Geography 2024 & 2032
- Figure 96: Rest of MEA MEA Payment Gateway Market Volume (Billion), by Geography 2024 & 2032
- Figure 97: Rest of MEA MEA Payment Gateway Market Revenue Share (%), by Geography 2024 & 2032
- Figure 98: Rest of MEA MEA Payment Gateway Market Volume Share (%), by Geography 2024 & 2032
- Figure 99: Rest of MEA MEA Payment Gateway Market Revenue (Million), by Country 2024 & 2032
- Figure 100: Rest of MEA MEA Payment Gateway Market Volume (Billion), by Country 2024 & 2032
- Figure 101: Rest of MEA MEA Payment Gateway Market Revenue Share (%), by Country 2024 & 2032
- Figure 102: Rest of MEA MEA Payment Gateway Market Volume Share (%), by Country 2024 & 2032
List of Tables
- Table 1: Global MEA Payment Gateway Market Revenue Million Forecast, by Region 2019 & 2032
- Table 2: Global MEA Payment Gateway Market Volume Billion Forecast, by Region 2019 & 2032
- Table 3: Global MEA Payment Gateway Market Revenue Million Forecast, by Type 2019 & 2032
- Table 4: Global MEA Payment Gateway Market Volume Billion Forecast, by Type 2019 & 2032
- Table 5: Global MEA Payment Gateway Market Revenue Million Forecast, by Enterprise 2019 & 2032
- Table 6: Global MEA Payment Gateway Market Volume Billion Forecast, by Enterprise 2019 & 2032
- Table 7: Global MEA Payment Gateway Market Revenue Million Forecast, by End User 2019 & 2032
- Table 8: Global MEA Payment Gateway Market Volume Billion Forecast, by End User 2019 & 2032
- Table 9: Global MEA Payment Gateway Market Revenue Million Forecast, by Geography 2019 & 2032
- Table 10: Global MEA Payment Gateway Market Volume Billion Forecast, by Geography 2019 & 2032
- Table 11: Global MEA Payment Gateway Market Revenue Million Forecast, by Region 2019 & 2032
- Table 12: Global MEA Payment Gateway Market Volume Billion Forecast, by Region 2019 & 2032
- Table 13: Global MEA Payment Gateway Market Revenue Million Forecast, by Type 2019 & 2032
- Table 14: Global MEA Payment Gateway Market Volume Billion Forecast, by Type 2019 & 2032
- Table 15: Global MEA Payment Gateway Market Revenue Million Forecast, by Enterprise 2019 & 2032
- Table 16: Global MEA Payment Gateway Market Volume Billion Forecast, by Enterprise 2019 & 2032
- Table 17: Global MEA Payment Gateway Market Revenue Million Forecast, by End User 2019 & 2032
- Table 18: Global MEA Payment Gateway Market Volume Billion Forecast, by End User 2019 & 2032
- Table 19: Global MEA Payment Gateway Market Revenue Million Forecast, by Geography 2019 & 2032
- Table 20: Global MEA Payment Gateway Market Volume Billion Forecast, by Geography 2019 & 2032
- Table 21: Global MEA Payment Gateway Market Revenue Million Forecast, by Country 2019 & 2032
- Table 22: Global MEA Payment Gateway Market Volume Billion Forecast, by Country 2019 & 2032
- Table 23: Global MEA Payment Gateway Market Revenue Million Forecast, by Type 2019 & 2032
- Table 24: Global MEA Payment Gateway Market Volume Billion Forecast, by Type 2019 & 2032
- Table 25: Global MEA Payment Gateway Market Revenue Million Forecast, by Enterprise 2019 & 2032
- Table 26: Global MEA Payment Gateway Market Volume Billion Forecast, by Enterprise 2019 & 2032
- Table 27: Global MEA Payment Gateway Market Revenue Million Forecast, by End User 2019 & 2032
- Table 28: Global MEA Payment Gateway Market Volume Billion Forecast, by End User 2019 & 2032
- Table 29: Global MEA Payment Gateway Market Revenue Million Forecast, by Geography 2019 & 2032
- Table 30: Global MEA Payment Gateway Market Volume Billion Forecast, by Geography 2019 & 2032
- Table 31: Global MEA Payment Gateway Market Revenue Million Forecast, by Country 2019 & 2032
- Table 32: Global MEA Payment Gateway Market Volume Billion Forecast, by Country 2019 & 2032
- Table 33: Global MEA Payment Gateway Market Revenue Million Forecast, by Type 2019 & 2032
- Table 34: Global MEA Payment Gateway Market Volume Billion Forecast, by Type 2019 & 2032
- Table 35: Global MEA Payment Gateway Market Revenue Million Forecast, by Enterprise 2019 & 2032
- Table 36: Global MEA Payment Gateway Market Volume Billion Forecast, by Enterprise 2019 & 2032
- Table 37: Global MEA Payment Gateway Market Revenue Million Forecast, by End User 2019 & 2032
- Table 38: Global MEA Payment Gateway Market Volume Billion Forecast, by End User 2019 & 2032
- Table 39: Global MEA Payment Gateway Market Revenue Million Forecast, by Geography 2019 & 2032
- Table 40: Global MEA Payment Gateway Market Volume Billion Forecast, by Geography 2019 & 2032
- Table 41: Global MEA Payment Gateway Market Revenue Million Forecast, by Country 2019 & 2032
- Table 42: Global MEA Payment Gateway Market Volume Billion Forecast, by Country 2019 & 2032
- Table 43: Global MEA Payment Gateway Market Revenue Million Forecast, by Type 2019 & 2032
- Table 44: Global MEA Payment Gateway Market Volume Billion Forecast, by Type 2019 & 2032
- Table 45: Global MEA Payment Gateway Market Revenue Million Forecast, by Enterprise 2019 & 2032
- Table 46: Global MEA Payment Gateway Market Volume Billion Forecast, by Enterprise 2019 & 2032
- Table 47: Global MEA Payment Gateway Market Revenue Million Forecast, by End User 2019 & 2032
- Table 48: Global MEA Payment Gateway Market Volume Billion Forecast, by End User 2019 & 2032
- Table 49: Global MEA Payment Gateway Market Revenue Million Forecast, by Geography 2019 & 2032
- Table 50: Global MEA Payment Gateway Market Volume Billion Forecast, by Geography 2019 & 2032
- Table 51: Global MEA Payment Gateway Market Revenue Million Forecast, by Country 2019 & 2032
- Table 52: Global MEA Payment Gateway Market Volume Billion Forecast, by Country 2019 & 2032
- Table 53: Global MEA Payment Gateway Market Revenue Million Forecast, by Type 2019 & 2032
- Table 54: Global MEA Payment Gateway Market Volume Billion Forecast, by Type 2019 & 2032
- Table 55: Global MEA Payment Gateway Market Revenue Million Forecast, by Enterprise 2019 & 2032
- Table 56: Global MEA Payment Gateway Market Volume Billion Forecast, by Enterprise 2019 & 2032
- Table 57: Global MEA Payment Gateway Market Revenue Million Forecast, by End User 2019 & 2032
- Table 58: Global MEA Payment Gateway Market Volume Billion Forecast, by End User 2019 & 2032
- Table 59: Global MEA Payment Gateway Market Revenue Million Forecast, by Geography 2019 & 2032
- Table 60: Global MEA Payment Gateway Market Volume Billion Forecast, by Geography 2019 & 2032
- Table 61: Global MEA Payment Gateway Market Revenue Million Forecast, by Country 2019 & 2032
- Table 62: Global MEA Payment Gateway Market Volume Billion Forecast, by Country 2019 & 2032
Frequently Asked Questions
1. What is the projected Compound Annual Growth Rate (CAGR) of the MEA Payment Gateway Market?
The projected CAGR is approximately 23.65%.
2. Which companies are prominent players in the MEA Payment Gateway Market?
Key companies in the market include PayTabs LLC, Amazon Payments Inc, PayPal Holdings Inc, HyperPay, CashU*List Not Exhaustive.
3. What are the main segments of the MEA Payment Gateway Market?
The market segments include Type, Enterprise, End User, Geography.
4. Can you provide details about the market size?
The market size is estimated to be USD 3.31 Million as of 2022.
5. What are some drivers contributing to market growth?
Increased E-commerce Sales and High Internet Penetration Rate; Increased Demand for Mobile-based Payments; Growing Adoption of Payment Gateways in Retail.
6. What are the notable trends driving market growth?
Increased E-commerce Sales and High Internet Penetration Rate.
7. Are there any restraints impacting market growth?
Increased E-commerce Sales and High Internet Penetration Rate; Increased Demand for Mobile-based Payments; Growing Adoption of Payment Gateways in Retail.
8. Can you provide examples of recent developments in the market?
September 2024: Barq, a Saudi financial services startup, is set to enhance its payment acceptance solutions for merchants and consumers by utilizing Mastercard's Gateway technology. Through this collaboration, Barq aims to provide expanded services to Saudi businesses, citizens, and residents, catering to their growing demand for cross-border services and remittance solutions.June 2024: CellPoint Digital, a global leader in payment orchestration and a provider of payment solutions to the airline industry, has forged a new partnership with Riyadh Air, the newest national airline in Saudi Arabia. This collaboration will empower Riyadh Air with cutting-edge payment technology, aligning with its digital-first business strategy and setting it apart as it gears up for commercial operations in 2025. Through this partnership, Riyadh Air gains access to CellPoint Digital’s Payment Orchestration platform, streamlining both local and cross-border transaction processing.
9. What pricing options are available for accessing the report?
Pricing options include single-user, multi-user, and enterprise licenses priced at USD 4750, USD 5250, and USD 8750 respectively.
10. Is the market size provided in terms of value or volume?
The market size is provided in terms of value, measured in Million and volume, measured in Billion.
11. Are there any specific market keywords associated with the report?
Yes, the market keyword associated with the report is "MEA Payment Gateway Market," which aids in identifying and referencing the specific market segment covered.
12. How do I determine which pricing option suits my needs best?
The pricing options vary based on user requirements and access needs. Individual users may opt for single-user licenses, while businesses requiring broader access may choose multi-user or enterprise licenses for cost-effective access to the report.
13. Are there any additional resources or data provided in the MEA Payment Gateway Market report?
While the report offers comprehensive insights, it's advisable to review the specific contents or supplementary materials provided to ascertain if additional resources or data are available.
14. How can I stay updated on further developments or reports in the MEA Payment Gateway Market?
To stay informed about further developments, trends, and reports in the MEA Payment Gateway Market, consider subscribing to industry newsletters, following relevant companies and organizations, or regularly checking reputable industry news sources and publications.
Methodology
Step 1 - Identification of Relevant Samples Size from Population Database


Step 2 - Approaches for Defining Global Market Size (Value, Volume* & Price*)

Note*: In applicable scenarios
Step 3 - Data Sources
Primary Research
- Web Analytics
- Survey Reports
- Research Institute
- Latest Research Reports
- Opinion Leaders
Secondary Research
- Annual Reports
- White Paper
- Latest Press Release
- Industry Association
- Paid Database
- Investor Presentations

Step 4 - Data Triangulation
Involves using different sources of information in order to increase the validity of a study
These sources are likely to be stakeholders in a program - participants, other researchers, program staff, other community members, and so on.
Then we put all data in single framework & apply various statistical tools to find out the dynamic on the market.
During the analysis stage, feedback from the stakeholder groups would be compared to determine areas of agreement as well as areas of divergence


