
Key Insights
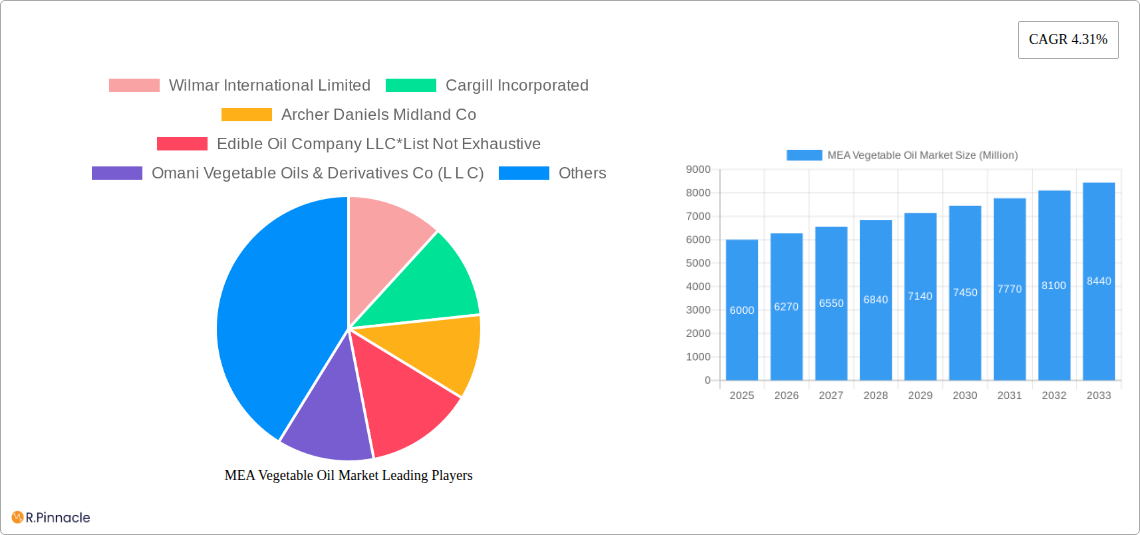
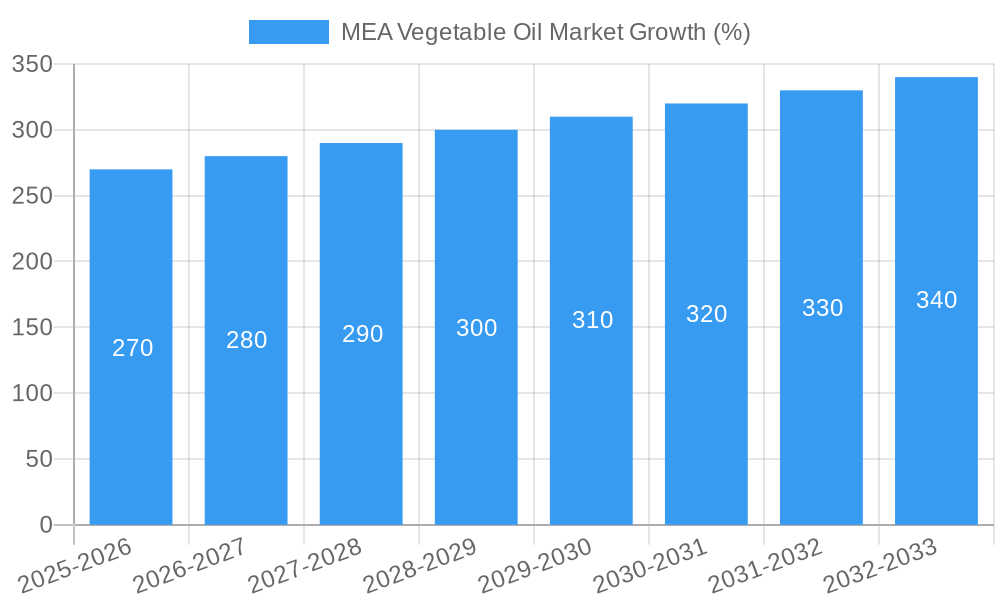
The Middle East and Africa (MEA) vegetable oil market presents a compelling investment opportunity, driven by rising populations, increasing urbanization, and shifting dietary habits towards processed foods. A projected CAGR of 4.31% from 2025 to 2033 indicates consistent growth, although the exact market size for 2025 is unavailable and requires estimation. Considering global vegetable oil market trends and the MEA region's economic development, a reasonable estimate for the 2025 MEA vegetable oil market size could be between $5 billion and $7 billion USD. This range reflects the significant consumption within the region, particularly in countries like the UAE and Saudi Arabia, balanced against potential economic volatility impacting purchasing power in other areas. Growth is fueled by expanding food processing and manufacturing sectors, along with increasing demand for biofuels, leading to higher production and import volumes. The prevalent use of vegetable oils in traditional cuisine further strengthens market demand. Palm, soybean, and sunflower oils are expected to be dominant product types, driven by their affordability and accessibility. However, health consciousness is fostering growth in higher-value oils like olive oil, presenting a niche opportunity for premium brands.
Major challenges include price volatility tied to global commodity markets, fluctuating crude oil prices (affecting biofuel production), and the impact of climate change on crop yields. Furthermore, competition from other cooking oils and regional preferences influence consumer choices. Leading players in the MEA market, including Wilmar International, Cargill, and local companies like Omani Vegetable Oils & Derivatives Co., are adapting their strategies to navigate these challenges, focusing on sustainable sourcing, product diversification, and innovative marketing to maintain market share. The market's future growth hinges on successfully addressing these challenges and capitalizing on the growing demand, primarily driven by the expanding middle class and changing consumption patterns within the region.
MEA Vegetable Oil Market: A Comprehensive Report (2019-2033)
This comprehensive report provides an in-depth analysis of the Middle East and Africa (MEA) vegetable oil market, offering invaluable insights for industry professionals, investors, and strategists. Covering the period from 2019 to 2033, with a base year of 2025, this report forecasts market trends and growth opportunities, analyzing key segments, dominant players, and emerging challenges. The market size is projected to reach xx Million by 2033, exhibiting a CAGR of xx% during the forecast period (2025-2033).
MEA Vegetable Oil Market Structure & Innovation Trends
This section analyzes the MEA vegetable oil market's competitive landscape, highlighting market concentration, innovation drivers, regulatory frameworks, and M&A activities. Key players like Wilmar International Limited, Cargill Incorporated, and Archer Daniels Midland Co. shape the market dynamics, alongside regional players such as Al Ghurair and Omani Vegetable Oils & Derivatives Co (L L C).
- Market Concentration: The MEA vegetable oil market exhibits a moderately concentrated structure, with a few major players holding significant market share. The exact market share distribution varies by product type and region.
- Innovation Drivers: Growing demand for healthier oils, increasing focus on sustainability, and advancements in oil extraction and processing technologies are key innovation drivers.
- Regulatory Framework: Government regulations concerning food safety, labeling, and import/export policies influence market dynamics.
- Product Substitutes: The market faces competition from alternative cooking oils and fats, impacting demand for certain vegetable oils.
- M&A Activities: The report examines significant mergers and acquisitions, such as Al Ghurair's acquisition of Edible Oil Company LLC in 2021, analyzing their impact on market consolidation and competitive dynamics. These deals often involve significant investments, with values reaching xx Million in some cases. For instance, the Al Ghurair acquisition of EOCD was valued at approximately xx Million.
- End-User Demographics: Shifting consumer preferences, particularly towards healthier and sustainable options, are influencing market trends.
MEA Vegetable Oil Market Dynamics & Trends
This section delves into the key factors driving market growth, including rising consumer demand, technological advancements, and evolving consumer preferences. The report analyzes market growth drivers, technological disruptions, consumer preferences, and competitive dynamics.
The MEA vegetable oil market is experiencing significant growth driven by factors such as a rising population, increasing urbanization, changing dietary habits, and the growing food processing industry. Technological advancements in oil extraction and refining, as well as the development of sustainable and healthier vegetable oil options, further contribute to market expansion. Consumer preferences are shifting towards healthier options, influencing the demand for specific vegetable oils like olive oil and sunflower oil. Competitive dynamics are shaped by both established multinational companies and regional players, leading to price competition and product diversification. The market penetration of different vegetable oil types varies significantly, with palm oil currently dominating, although this may change with growing consumer awareness of sustainability issues.
Dominant Regions & Segments in MEA Vegetable Oil Market
This section identifies the leading regions and segments within the MEA vegetable oil market. Analysis is conducted based on both product type (Palm Oil, Soybean Oil, Rapeseed Oil, Sunflower Oil, Olive Oil, Other Product Types) and application (Food, Feed, Industrial).
Dominant Regions: The report identifies specific countries within the MEA region that are driving market growth. Factors driving dominance include:
- Economic Policies: Government support for agriculture and food processing influences production and consumption.
- Infrastructure: Efficient transportation networks and storage facilities support market growth.
- Population Growth: A growing population increases the demand for vegetable oils.
Dominant Segments: The report highlights the leading segments by product type and application, explaining the factors contributing to their dominance. For example, palm oil might be dominant in food applications due to its cost-effectiveness, while soybean oil could be important in the feed segment due to its protein content. A detailed analysis of market share and growth potential for each segment is provided.
MEA Vegetable Oil Market Product Innovations
Recent product innovations in the MEA vegetable oil market include the development of healthier and sustainable vegetable oil options, as well as advancements in oil extraction and refining technologies. These innovations aim to cater to the growing consumer demand for healthier and more sustainable food products. The market is witnessing the introduction of refined, bleached, and deodorized (RBD) oils with improved quality and shelf life. The adoption of new technologies, such as advanced filtration and purification techniques, enhances the efficiency and sustainability of oil processing. This focus on improved quality and sustainability provides a competitive advantage for companies offering premium vegetable oils.
Report Scope & Segmentation Analysis
This report provides a comprehensive segmentation analysis of the MEA vegetable oil market based on product type and application.
By Product Type: The report analyzes market size, growth projections, and competitive dynamics for each product type: Palm Oil, Soybean Oil, Rapeseed Oil, Sunflower Oil, Olive Oil, and Other Product Types. Growth projections for each segment will vary based on factors like consumer preferences and production costs.
By Application: The report provides a similar analysis for each application: Food, Feed, and Industrial. Market sizes and growth projections vary across these segments, reflecting differences in demand drivers and consumer behavior. The competitive dynamics in each segment are also analyzed.
Key Drivers of MEA Vegetable Oil Market Growth
Several key factors drive the growth of the MEA vegetable oil market. These include:
- Rising Population and Urbanization: The increasing population and rapid urbanization in the MEA region boost the demand for vegetable oils for cooking and food processing.
- Changing Dietary Habits: Shifting dietary preferences toward more processed foods and convenience products increase reliance on vegetable oils.
- Government Initiatives: Government policies promoting agricultural development and food security encourage vegetable oil production and consumption.
Challenges in the MEA Vegetable Oil Market Sector
The MEA vegetable oil market faces challenges such as:
- Fluctuations in Raw Material Prices: The cost of raw materials significantly impacts the profitability of vegetable oil production.
- Supply Chain Disruptions: Geopolitical instability and logistical issues can disrupt the supply chain, affecting the availability of vegetable oils.
- Competition: Intense competition from both established multinational companies and regional players puts pressure on profit margins.
Emerging Opportunities in MEA Vegetable Oil Market
The MEA vegetable oil market presents several emerging opportunities:
- Growing Demand for Healthier Oils: The increasing consumer awareness of health benefits is driving demand for healthier vegetable oils like olive oil and sunflower oil.
- Sustainable Oil Production: The growing emphasis on sustainability opens opportunities for companies producing and sourcing vegetable oils sustainably.
- Expansion into New Markets: Untapped markets in the MEA region offer potential for growth and expansion.
Leading Players in the MEA Vegetable Oil Market Market
- Wilmar International Limited
- Cargill Incorporated
- Archer Daniels Midland Co
- Edible Oil Company LLC
- Omani Vegetable Oils & Derivatives Co (L L C)
- Amira Nature Foods Ltd
- Al Ghurair
- Sime Darby Plantation Berhad
- ADVOC (ABU DHABI VEGETABLE OIL COMPANY)
- AJWA Group
Key Developments in MEA Vegetable Oil Market Industry
- 2021: Al Ghurair acquires Edible Oil Company LLC, expanding its presence in the Middle East.
- 2021: Archer Daniels Midland Co. partners with Marathon Petroleum Corp. to produce soybean oil for renewable diesel, catering to growing demand in the MEA region.
- 2019: Sime Darby Oils and Abu Dhabi Vegetable Oil Company form a strategic partnership to market oils and fats in the MENA region.
Future Outlook for MEA Vegetable Oil Market Market
The MEA vegetable oil market is poised for continued growth driven by factors such as increasing population, rising disposable incomes, and changing dietary habits. The market's future will be shaped by the adoption of sustainable practices, technological innovation, and government regulations. Opportunities exist for companies that can provide high-quality, sustainable, and innovative vegetable oil products that meet evolving consumer demands.
MEA Vegetable Oil Market Segmentation
-
1. Product Type
- 1.1. Palm Oil
- 1.2. Soybean Oil
- 1.3. Rapeseed Oil
- 1.4. Sunflower Oil
- 1.5. Olive Oil
- 1.6. Other Product Types
-
2. Application
- 2.1. Food
- 2.2. Feed
- 2.3. Industrial
-
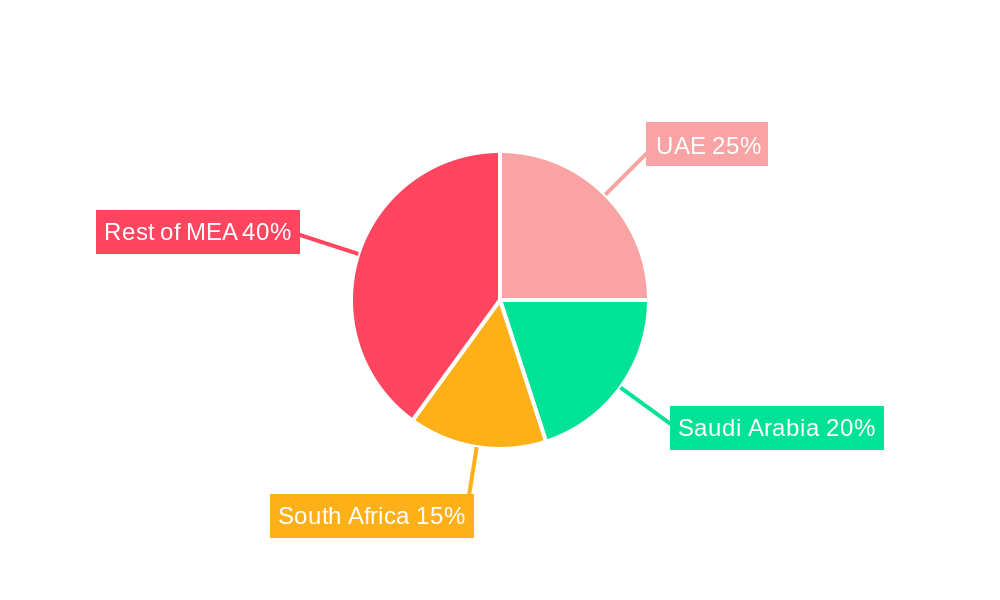
3. Geography
- 3.1. South Africa
- 3.2. United Arab Emirates
- 3.3. Rest of Middle-East and Africa
MEA Vegetable Oil Market Segmentation By Geography
- 1. South Africa
- 2. United Arab Emirates
- 3. Rest of Middle East and Africa
MEA Vegetable Oil Market REPORT HIGHLIGHTS
| Aspects | Details |
|---|---|
| Study Period | 2019-2033 |
| Base Year | 2024 |
| Estimated Year | 2025 |
| Forecast Period | 2025-2033 |
| Historical Period | 2019-2024 |
| Growth Rate | CAGR of 4.31% from 2019-2033 |
| Segmentation |
|
Table of Contents
- 1. Introduction
- 1.1. Research Scope
- 1.2. Market Segmentation
- 1.3. Research Methodology
- 1.4. Definitions and Assumptions
- 2. Executive Summary
- 2.1. Introduction
- 3. Market Dynamics
- 3.1. Introduction
- 3.2. Market Drivers
- 3.2.1. Growing Demand for Plant Based Alternatives; Expanding Application of Pea Protein Toward Food Fortification
- 3.3. Market Restrains
- 3.3.1. Low Awareness and Application of the Additive
- 3.4. Market Trends
- 3.4.1. Increasing Demand for Fortified Edible Oil
- 4. Market Factor Analysis
- 4.1. Porters Five Forces
- 4.2. Supply/Value Chain
- 4.3. PESTEL analysis
- 4.4. Market Entropy
- 4.5. Patent/Trademark Analysis
- 5. Global MEA Vegetable Oil Market Analysis, Insights and Forecast, 2019-2031
- 5.1. Market Analysis, Insights and Forecast - by Product Type
- 5.1.1. Palm Oil
- 5.1.2. Soybean Oil
- 5.1.3. Rapeseed Oil
- 5.1.4. Sunflower Oil
- 5.1.5. Olive Oil
- 5.1.6. Other Product Types
- 5.2. Market Analysis, Insights and Forecast - by Application
- 5.2.1. Food
- 5.2.2. Feed
- 5.2.3. Industrial
- 5.3. Market Analysis, Insights and Forecast - by Geography
- 5.3.1. South Africa
- 5.3.2. United Arab Emirates
- 5.3.3. Rest of Middle-East and Africa
- 5.4. Market Analysis, Insights and Forecast - by Region
- 5.4.1. South Africa
- 5.4.2. United Arab Emirates
- 5.4.3. Rest of Middle East and Africa
- 5.1. Market Analysis, Insights and Forecast - by Product Type
- 6. South Africa MEA Vegetable Oil Market Analysis, Insights and Forecast, 2019-2031
- 6.1. Market Analysis, Insights and Forecast - by Product Type
- 6.1.1. Palm Oil
- 6.1.2. Soybean Oil
- 6.1.3. Rapeseed Oil
- 6.1.4. Sunflower Oil
- 6.1.5. Olive Oil
- 6.1.6. Other Product Types
- 6.2. Market Analysis, Insights and Forecast - by Application
- 6.2.1. Food
- 6.2.2. Feed
- 6.2.3. Industrial
- 6.3. Market Analysis, Insights and Forecast - by Geography
- 6.3.1. South Africa
- 6.3.2. United Arab Emirates
- 6.3.3. Rest of Middle-East and Africa
- 6.1. Market Analysis, Insights and Forecast - by Product Type
- 7. United Arab Emirates MEA Vegetable Oil Market Analysis, Insights and Forecast, 2019-2031
- 7.1. Market Analysis, Insights and Forecast - by Product Type
- 7.1.1. Palm Oil
- 7.1.2. Soybean Oil
- 7.1.3. Rapeseed Oil
- 7.1.4. Sunflower Oil
- 7.1.5. Olive Oil
- 7.1.6. Other Product Types
- 7.2. Market Analysis, Insights and Forecast - by Application
- 7.2.1. Food
- 7.2.2. Feed
- 7.2.3. Industrial
- 7.3. Market Analysis, Insights and Forecast - by Geography
- 7.3.1. South Africa
- 7.3.2. United Arab Emirates
- 7.3.3. Rest of Middle-East and Africa
- 7.1. Market Analysis, Insights and Forecast - by Product Type
- 8. Rest of Middle East and Africa MEA Vegetable Oil Market Analysis, Insights and Forecast, 2019-2031
- 8.1. Market Analysis, Insights and Forecast - by Product Type
- 8.1.1. Palm Oil
- 8.1.2. Soybean Oil
- 8.1.3. Rapeseed Oil
- 8.1.4. Sunflower Oil
- 8.1.5. Olive Oil
- 8.1.6. Other Product Types
- 8.2. Market Analysis, Insights and Forecast - by Application
- 8.2.1. Food
- 8.2.2. Feed
- 8.2.3. Industrial
- 8.3. Market Analysis, Insights and Forecast - by Geography
- 8.3.1. South Africa
- 8.3.2. United Arab Emirates
- 8.3.3. Rest of Middle-East and Africa
- 8.1. Market Analysis, Insights and Forecast - by Product Type
- 9. North America MEA Vegetable Oil Market Analysis, Insights and Forecast, 2019-2031
- 9.1. Market Analysis, Insights and Forecast - By Country/Sub-region
- 9.1.1 United States
- 9.1.2 Canada
- 9.1.3 Mexico
- 10. Europe MEA Vegetable Oil Market Analysis, Insights and Forecast, 2019-2031
- 10.1. Market Analysis, Insights and Forecast - By Country/Sub-region
- 10.1.1 Germany
- 10.1.2 United Kingdom
- 10.1.3 France
- 10.1.4 Spain
- 10.1.5 Italy
- 10.1.6 Spain
- 10.1.7 Belgium
- 10.1.8 Netherland
- 10.1.9 Nordics
- 10.1.10 Rest of Europe
- 11. Asia Pacific MEA Vegetable Oil Market Analysis, Insights and Forecast, 2019-2031
- 11.1. Market Analysis, Insights and Forecast - By Country/Sub-region
- 11.1.1 China
- 11.1.2 Japan
- 11.1.3 India
- 11.1.4 South Korea
- 11.1.5 Southeast Asia
- 11.1.6 Australia
- 11.1.7 Indonesia
- 11.1.8 Phillipes
- 11.1.9 Singapore
- 11.1.10 Thailandc
- 11.1.11 Rest of Asia Pacific
- 12. South America MEA Vegetable Oil Market Analysis, Insights and Forecast, 2019-2031
- 12.1. Market Analysis, Insights and Forecast - By Country/Sub-region
- 12.1.1 Brazil
- 12.1.2 Argentina
- 12.1.3 Peru
- 12.1.4 Chile
- 12.1.5 Colombia
- 12.1.6 Ecuador
- 12.1.7 Venezuela
- 12.1.8 Rest of South America
- 13. North America MEA Vegetable Oil Market Analysis, Insights and Forecast, 2019-2031
- 13.1. Market Analysis, Insights and Forecast - By Country/Sub-region
- 13.1.1 United States
- 13.1.2 Canada
- 13.1.3 Mexico
- 14. MEA MEA Vegetable Oil Market Analysis, Insights and Forecast, 2019-2031
- 14.1. Market Analysis, Insights and Forecast - By Country/Sub-region
- 14.1.1 United Arab Emirates
- 14.1.2 Saudi Arabia
- 14.1.3 South Africa
- 14.1.4 Rest of Middle East and Africa
- 15. Competitive Analysis
- 15.1. Global Market Share Analysis 2024
- 15.2. Company Profiles
- 15.2.1 Wilmar International Limited
- 15.2.1.1. Overview
- 15.2.1.2. Products
- 15.2.1.3. SWOT Analysis
- 15.2.1.4. Recent Developments
- 15.2.1.5. Financials (Based on Availability)
- 15.2.2 Cargill Incorporated
- 15.2.2.1. Overview
- 15.2.2.2. Products
- 15.2.2.3. SWOT Analysis
- 15.2.2.4. Recent Developments
- 15.2.2.5. Financials (Based on Availability)
- 15.2.3 Archer Daniels Midland Co
- 15.2.3.1. Overview
- 15.2.3.2. Products
- 15.2.3.3. SWOT Analysis
- 15.2.3.4. Recent Developments
- 15.2.3.5. Financials (Based on Availability)
- 15.2.4 Edible Oil Company LLC*List Not Exhaustive
- 15.2.4.1. Overview
- 15.2.4.2. Products
- 15.2.4.3. SWOT Analysis
- 15.2.4.4. Recent Developments
- 15.2.4.5. Financials (Based on Availability)
- 15.2.5 Omani Vegetable Oils & Derivatives Co (L L C)
- 15.2.5.1. Overview
- 15.2.5.2. Products
- 15.2.5.3. SWOT Analysis
- 15.2.5.4. Recent Developments
- 15.2.5.5. Financials (Based on Availability)
- 15.2.6 Amira Nature Foods Ltd
- 15.2.6.1. Overview
- 15.2.6.2. Products
- 15.2.6.3. SWOT Analysis
- 15.2.6.4. Recent Developments
- 15.2.6.5. Financials (Based on Availability)
- 15.2.7 Al Ghurair
- 15.2.7.1. Overview
- 15.2.7.2. Products
- 15.2.7.3. SWOT Analysis
- 15.2.7.4. Recent Developments
- 15.2.7.5. Financials (Based on Availability)
- 15.2.8 Sime Darby Plantation Berhad
- 15.2.8.1. Overview
- 15.2.8.2. Products
- 15.2.8.3. SWOT Analysis
- 15.2.8.4. Recent Developments
- 15.2.8.5. Financials (Based on Availability)
- 15.2.9 ADVOC (ABU DHABI VEGETABLE OIL COMPANY)
- 15.2.9.1. Overview
- 15.2.9.2. Products
- 15.2.9.3. SWOT Analysis
- 15.2.9.4. Recent Developments
- 15.2.9.5. Financials (Based on Availability)
- 15.2.10 AJWA Group
- 15.2.10.1. Overview
- 15.2.10.2. Products
- 15.2.10.3. SWOT Analysis
- 15.2.10.4. Recent Developments
- 15.2.10.5. Financials (Based on Availability)
- 15.2.1 Wilmar International Limited
List of Figures
- Figure 1: Global MEA Vegetable Oil Market Revenue Breakdown (Million, %) by Region 2024 & 2032
- Figure 2: North America MEA Vegetable Oil Market Revenue (Million), by Country 2024 & 2032
- Figure 3: North America MEA Vegetable Oil Market Revenue Share (%), by Country 2024 & 2032
- Figure 4: Europe MEA Vegetable Oil Market Revenue (Million), by Country 2024 & 2032
- Figure 5: Europe MEA Vegetable Oil Market Revenue Share (%), by Country 2024 & 2032
- Figure 6: Asia Pacific MEA Vegetable Oil Market Revenue (Million), by Country 2024 & 2032
- Figure 7: Asia Pacific MEA Vegetable Oil Market Revenue Share (%), by Country 2024 & 2032
- Figure 8: South America MEA Vegetable Oil Market Revenue (Million), by Country 2024 & 2032
- Figure 9: South America MEA Vegetable Oil Market Revenue Share (%), by Country 2024 & 2032
- Figure 10: North America MEA Vegetable Oil Market Revenue (Million), by Country 2024 & 2032
- Figure 11: North America MEA Vegetable Oil Market Revenue Share (%), by Country 2024 & 2032
- Figure 12: MEA MEA Vegetable Oil Market Revenue (Million), by Country 2024 & 2032
- Figure 13: MEA MEA Vegetable Oil Market Revenue Share (%), by Country 2024 & 2032
- Figure 14: South Africa MEA Vegetable Oil Market Revenue (Million), by Product Type 2024 & 2032
- Figure 15: South Africa MEA Vegetable Oil Market Revenue Share (%), by Product Type 2024 & 2032
- Figure 16: South Africa MEA Vegetable Oil Market Revenue (Million), by Application 2024 & 2032
- Figure 17: South Africa MEA Vegetable Oil Market Revenue Share (%), by Application 2024 & 2032
- Figure 18: South Africa MEA Vegetable Oil Market Revenue (Million), by Geography 2024 & 2032
- Figure 19: South Africa MEA Vegetable Oil Market Revenue Share (%), by Geography 2024 & 2032
- Figure 20: South Africa MEA Vegetable Oil Market Revenue (Million), by Country 2024 & 2032
- Figure 21: South Africa MEA Vegetable Oil Market Revenue Share (%), by Country 2024 & 2032
- Figure 22: United Arab Emirates MEA Vegetable Oil Market Revenue (Million), by Product Type 2024 & 2032
- Figure 23: United Arab Emirates MEA Vegetable Oil Market Revenue Share (%), by Product Type 2024 & 2032
- Figure 24: United Arab Emirates MEA Vegetable Oil Market Revenue (Million), by Application 2024 & 2032
- Figure 25: United Arab Emirates MEA Vegetable Oil Market Revenue Share (%), by Application 2024 & 2032
- Figure 26: United Arab Emirates MEA Vegetable Oil Market Revenue (Million), by Geography 2024 & 2032
- Figure 27: United Arab Emirates MEA Vegetable Oil Market Revenue Share (%), by Geography 2024 & 2032
- Figure 28: United Arab Emirates MEA Vegetable Oil Market Revenue (Million), by Country 2024 & 2032
- Figure 29: United Arab Emirates MEA Vegetable Oil Market Revenue Share (%), by Country 2024 & 2032
- Figure 30: Rest of Middle East and Africa MEA Vegetable Oil Market Revenue (Million), by Product Type 2024 & 2032
- Figure 31: Rest of Middle East and Africa MEA Vegetable Oil Market Revenue Share (%), by Product Type 2024 & 2032
- Figure 32: Rest of Middle East and Africa MEA Vegetable Oil Market Revenue (Million), by Application 2024 & 2032
- Figure 33: Rest of Middle East and Africa MEA Vegetable Oil Market Revenue Share (%), by Application 2024 & 2032
- Figure 34: Rest of Middle East and Africa MEA Vegetable Oil Market Revenue (Million), by Geography 2024 & 2032
- Figure 35: Rest of Middle East and Africa MEA Vegetable Oil Market Revenue Share (%), by Geography 2024 & 2032
- Figure 36: Rest of Middle East and Africa MEA Vegetable Oil Market Revenue (Million), by Country 2024 & 2032
- Figure 37: Rest of Middle East and Africa MEA Vegetable Oil Market Revenue Share (%), by Country 2024 & 2032
List of Tables
- Table 1: Global MEA Vegetable Oil Market Revenue Million Forecast, by Region 2019 & 2032
- Table 2: Global MEA Vegetable Oil Market Revenue Million Forecast, by Product Type 2019 & 2032
- Table 3: Global MEA Vegetable Oil Market Revenue Million Forecast, by Application 2019 & 2032
- Table 4: Global MEA Vegetable Oil Market Revenue Million Forecast, by Geography 2019 & 2032
- Table 5: Global MEA Vegetable Oil Market Revenue Million Forecast, by Region 2019 & 2032
- Table 6: Global MEA Vegetable Oil Market Revenue Million Forecast, by Country 2019 & 2032
- Table 7: United States MEA Vegetable Oil Market Revenue (Million) Forecast, by Application 2019 & 2032
- Table 8: Canada MEA Vegetable Oil Market Revenue (Million) Forecast, by Application 2019 & 2032
- Table 9: Mexico MEA Vegetable Oil Market Revenue (Million) Forecast, by Application 2019 & 2032
- Table 10: Global MEA Vegetable Oil Market Revenue Million Forecast, by Country 2019 & 2032
- Table 11: Germany MEA Vegetable Oil Market Revenue (Million) Forecast, by Application 2019 & 2032
- Table 12: United Kingdom MEA Vegetable Oil Market Revenue (Million) Forecast, by Application 2019 & 2032
- Table 13: France MEA Vegetable Oil Market Revenue (Million) Forecast, by Application 2019 & 2032
- Table 14: Spain MEA Vegetable Oil Market Revenue (Million) Forecast, by Application 2019 & 2032
- Table 15: Italy MEA Vegetable Oil Market Revenue (Million) Forecast, by Application 2019 & 2032
- Table 16: Spain MEA Vegetable Oil Market Revenue (Million) Forecast, by Application 2019 & 2032
- Table 17: Belgium MEA Vegetable Oil Market Revenue (Million) Forecast, by Application 2019 & 2032
- Table 18: Netherland MEA Vegetable Oil Market Revenue (Million) Forecast, by Application 2019 & 2032
- Table 19: Nordics MEA Vegetable Oil Market Revenue (Million) Forecast, by Application 2019 & 2032
- Table 20: Rest of Europe MEA Vegetable Oil Market Revenue (Million) Forecast, by Application 2019 & 2032
- Table 21: Global MEA Vegetable Oil Market Revenue Million Forecast, by Country 2019 & 2032
- Table 22: China MEA Vegetable Oil Market Revenue (Million) Forecast, by Application 2019 & 2032
- Table 23: Japan MEA Vegetable Oil Market Revenue (Million) Forecast, by Application 2019 & 2032
- Table 24: India MEA Vegetable Oil Market Revenue (Million) Forecast, by Application 2019 & 2032
- Table 25: South Korea MEA Vegetable Oil Market Revenue (Million) Forecast, by Application 2019 & 2032
- Table 26: Southeast Asia MEA Vegetable Oil Market Revenue (Million) Forecast, by Application 2019 & 2032
- Table 27: Australia MEA Vegetable Oil Market Revenue (Million) Forecast, by Application 2019 & 2032
- Table 28: Indonesia MEA Vegetable Oil Market Revenue (Million) Forecast, by Application 2019 & 2032
- Table 29: Phillipes MEA Vegetable Oil Market Revenue (Million) Forecast, by Application 2019 & 2032
- Table 30: Singapore MEA Vegetable Oil Market Revenue (Million) Forecast, by Application 2019 & 2032
- Table 31: Thailandc MEA Vegetable Oil Market Revenue (Million) Forecast, by Application 2019 & 2032
- Table 32: Rest of Asia Pacific MEA Vegetable Oil Market Revenue (Million) Forecast, by Application 2019 & 2032
- Table 33: Global MEA Vegetable Oil Market Revenue Million Forecast, by Country 2019 & 2032
- Table 34: Brazil MEA Vegetable Oil Market Revenue (Million) Forecast, by Application 2019 & 2032
- Table 35: Argentina MEA Vegetable Oil Market Revenue (Million) Forecast, by Application 2019 & 2032
- Table 36: Peru MEA Vegetable Oil Market Revenue (Million) Forecast, by Application 2019 & 2032
- Table 37: Chile MEA Vegetable Oil Market Revenue (Million) Forecast, by Application 2019 & 2032
- Table 38: Colombia MEA Vegetable Oil Market Revenue (Million) Forecast, by Application 2019 & 2032
- Table 39: Ecuador MEA Vegetable Oil Market Revenue (Million) Forecast, by Application 2019 & 2032
- Table 40: Venezuela MEA Vegetable Oil Market Revenue (Million) Forecast, by Application 2019 & 2032
- Table 41: Rest of South America MEA Vegetable Oil Market Revenue (Million) Forecast, by Application 2019 & 2032
- Table 42: Global MEA Vegetable Oil Market Revenue Million Forecast, by Country 2019 & 2032
- Table 43: United States MEA Vegetable Oil Market Revenue (Million) Forecast, by Application 2019 & 2032
- Table 44: Canada MEA Vegetable Oil Market Revenue (Million) Forecast, by Application 2019 & 2032
- Table 45: Mexico MEA Vegetable Oil Market Revenue (Million) Forecast, by Application 2019 & 2032
- Table 46: Global MEA Vegetable Oil Market Revenue Million Forecast, by Country 2019 & 2032
- Table 47: United Arab Emirates MEA Vegetable Oil Market Revenue (Million) Forecast, by Application 2019 & 2032
- Table 48: Saudi Arabia MEA Vegetable Oil Market Revenue (Million) Forecast, by Application 2019 & 2032
- Table 49: South Africa MEA Vegetable Oil Market Revenue (Million) Forecast, by Application 2019 & 2032
- Table 50: Rest of Middle East and Africa MEA Vegetable Oil Market Revenue (Million) Forecast, by Application 2019 & 2032
- Table 51: Global MEA Vegetable Oil Market Revenue Million Forecast, by Product Type 2019 & 2032
- Table 52: Global MEA Vegetable Oil Market Revenue Million Forecast, by Application 2019 & 2032
- Table 53: Global MEA Vegetable Oil Market Revenue Million Forecast, by Geography 2019 & 2032
- Table 54: Global MEA Vegetable Oil Market Revenue Million Forecast, by Country 2019 & 2032
- Table 55: Global MEA Vegetable Oil Market Revenue Million Forecast, by Product Type 2019 & 2032
- Table 56: Global MEA Vegetable Oil Market Revenue Million Forecast, by Application 2019 & 2032
- Table 57: Global MEA Vegetable Oil Market Revenue Million Forecast, by Geography 2019 & 2032
- Table 58: Global MEA Vegetable Oil Market Revenue Million Forecast, by Country 2019 & 2032
- Table 59: Global MEA Vegetable Oil Market Revenue Million Forecast, by Product Type 2019 & 2032
- Table 60: Global MEA Vegetable Oil Market Revenue Million Forecast, by Application 2019 & 2032
- Table 61: Global MEA Vegetable Oil Market Revenue Million Forecast, by Geography 2019 & 2032
- Table 62: Global MEA Vegetable Oil Market Revenue Million Forecast, by Country 2019 & 2032
Frequently Asked Questions
1. What is the projected Compound Annual Growth Rate (CAGR) of the MEA Vegetable Oil Market?
The projected CAGR is approximately 4.31%.
2. Which companies are prominent players in the MEA Vegetable Oil Market?
Key companies in the market include Wilmar International Limited, Cargill Incorporated, Archer Daniels Midland Co, Edible Oil Company LLC*List Not Exhaustive, Omani Vegetable Oils & Derivatives Co (L L C), Amira Nature Foods Ltd, Al Ghurair, Sime Darby Plantation Berhad, ADVOC (ABU DHABI VEGETABLE OIL COMPANY), AJWA Group.
3. What are the main segments of the MEA Vegetable Oil Market?
The market segments include Product Type, Application, Geography.
4. Can you provide details about the market size?
The market size is estimated to be USD XX Million as of 2022.
5. What are some drivers contributing to market growth?
Growing Demand for Plant Based Alternatives; Expanding Application of Pea Protein Toward Food Fortification.
6. What are the notable trends driving market growth?
Increasing Demand for Fortified Edible Oil.
7. Are there any restraints impacting market growth?
Low Awareness and Application of the Additive.
8. Can you provide examples of recent developments in the market?
In 2021, Al Ghurair announced that they are acquiring (EOCD), 'Edible Oil Company LLC' which is a major company in multi-seed, crushing over the regions of the Middle -East. Signing this deal is to expand its resources and business operations over Dubai and other Middle-Eastern countries.
9. What pricing options are available for accessing the report?
Pricing options include single-user, multi-user, and enterprise licenses priced at USD 4750, USD 5250, and USD 8750 respectively.
10. Is the market size provided in terms of value or volume?
The market size is provided in terms of value, measured in Million.
11. Are there any specific market keywords associated with the report?
Yes, the market keyword associated with the report is "MEA Vegetable Oil Market," which aids in identifying and referencing the specific market segment covered.
12. How do I determine which pricing option suits my needs best?
The pricing options vary based on user requirements and access needs. Individual users may opt for single-user licenses, while businesses requiring broader access may choose multi-user or enterprise licenses for cost-effective access to the report.
13. Are there any additional resources or data provided in the MEA Vegetable Oil Market report?
While the report offers comprehensive insights, it's advisable to review the specific contents or supplementary materials provided to ascertain if additional resources or data are available.
14. How can I stay updated on further developments or reports in the MEA Vegetable Oil Market?
To stay informed about further developments, trends, and reports in the MEA Vegetable Oil Market, consider subscribing to industry newsletters, following relevant companies and organizations, or regularly checking reputable industry news sources and publications.
Methodology
Step 1 - Identification of Relevant Samples Size from Population Database


Step 2 - Approaches for Defining Global Market Size (Value, Volume* & Price*)

Note*: In applicable scenarios
Step 3 - Data Sources
Primary Research
- Web Analytics
- Survey Reports
- Research Institute
- Latest Research Reports
- Opinion Leaders
Secondary Research
- Annual Reports
- White Paper
- Latest Press Release
- Industry Association
- Paid Database
- Investor Presentations

Step 4 - Data Triangulation
Involves using different sources of information in order to increase the validity of a study
These sources are likely to be stakeholders in a program - participants, other researchers, program staff, other community members, and so on.
Then we put all data in single framework & apply various statistical tools to find out the dynamic on the market.
During the analysis stage, feedback from the stakeholder groups would be compared to determine areas of agreement as well as areas of divergence


