
Key Insights
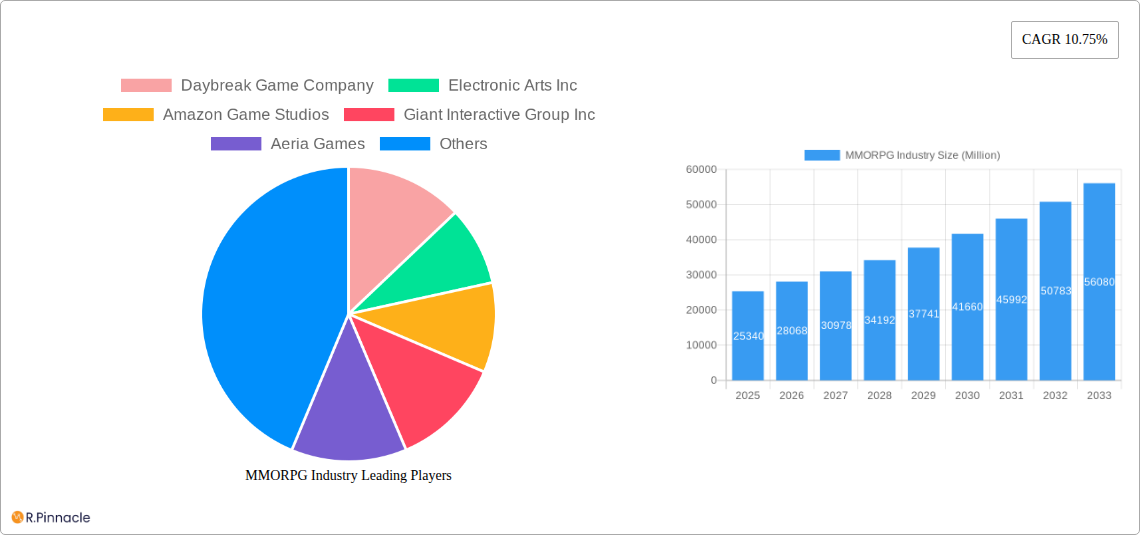
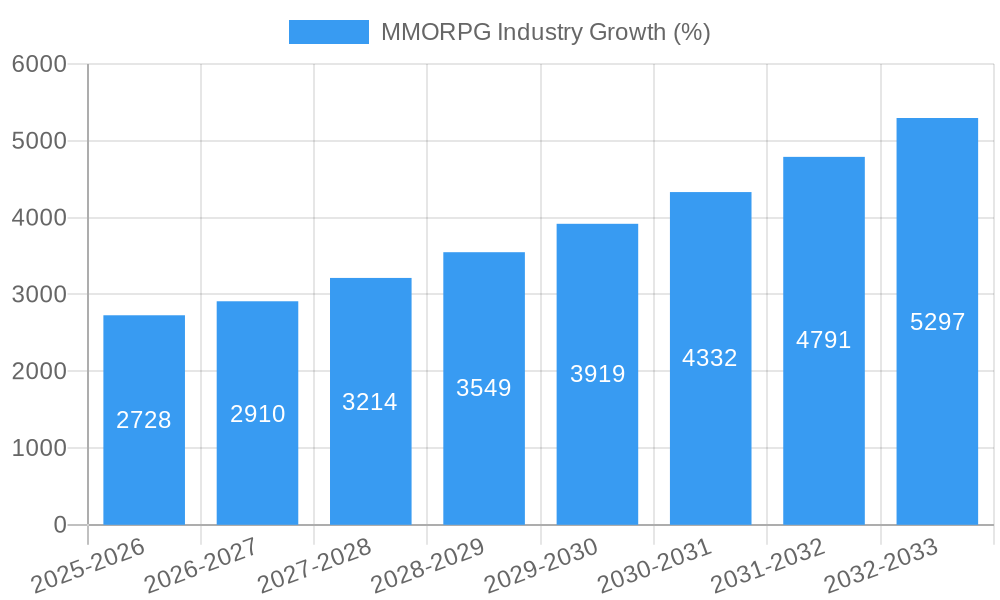
The MMORPG (Massively Multiplayer Online Role-Playing Game) market, valued at $25.34 billion in 2025, is experiencing robust growth, projected to expand at a Compound Annual Growth Rate (CAGR) of 10.75% from 2025 to 2033. This expansion is fueled by several key factors. The increasing accessibility of high-speed internet, particularly in developing regions of Asia and South America, is driving wider adoption. Technological advancements, such as enhanced graphics, improved game engines, and cross-platform play, are significantly enhancing the gaming experience, attracting both new and returning players. Furthermore, the rise of mobile gaming and the increasing popularity of esports are contributing to market growth. The integration of social and community features within MMORPGs fosters player engagement and longevity, leading to increased revenue through in-game purchases and subscriptions. Competition among established developers like Tencent Holdings Limited, Activision Blizzard Inc., and NetEasegames Inc., alongside innovative entries from independent studios, is fostering innovation and driving the market's dynamic evolution.
However, the market faces some challenges. The high development costs associated with creating and maintaining complex MMORPGs can present a significant barrier to entry for smaller developers. Furthermore, maintaining player engagement over extended periods requires consistent content updates and community management, which necessitates considerable ongoing investment. The prevalence of free-to-play models, while expanding the player base, can impact monetization strategies and revenue streams. Addressing these challenges requires a strategic balance between attracting new players, retaining existing ones, and implementing sustainable monetization models that are fair and engaging for the player community. The continued success of the MMORPG market will depend on the ability of developers to adapt to evolving player expectations, leverage technological advancements, and create immersive, engaging, and socially connected gaming experiences.
MMORPG Industry Report: 2019-2033 - A Comprehensive Market Analysis
This in-depth report provides a comprehensive analysis of the Massively Multiplayer Online Role-Playing Game (MMORPG) industry from 2019 to 2033, offering invaluable insights for industry professionals and investors. The report leverages extensive data analysis to forecast market trends, identify key players, and highlight lucrative opportunities within this dynamic sector. With a focus on actionable intelligence, this report is designed to help businesses make informed strategic decisions and navigate the evolving landscape of the MMORPG market. The study period covers 2019-2033, with 2025 serving as the base and estimated year. The forecast period spans 2025-2033, while the historical period encompasses 2019-2024. Expect detailed breakdowns across key segments including Mobile, Tablet, PC, and Gaming Console platforms. Total market value projections are in Millions.
MMORPG Industry Market Structure & Innovation Trends
This section analyzes the MMORPG market's competitive landscape, identifying key players and assessing their market share. The report delves into innovation drivers, regulatory influences, and the impact of mergers and acquisitions (M&A) on market dynamics.
Market Concentration: The MMORPG market exhibits a moderately concentrated structure, with a few dominant players controlling a significant portion (xx%) of the global revenue. This concentration is largely driven by established companies with strong brand recognition and extensive game portfolios.
Innovation Drivers: Key innovation drivers include advancements in game engine technology, the integration of virtual reality (VR) and augmented reality (AR), and the growing adoption of cloud-based gaming. The rise of Web3 technologies and blockchain integration also represents a significant driver.
Regulatory Frameworks: Varying regional regulations impact the development and distribution of MMORPGs. Compliance with data privacy laws and age-rating systems varies significantly across different markets.
Product Substitutes: The MMORPG industry faces competition from other genres of online games, including battle royale games and esports titles. These alternative gaming experiences compete for player attention and spending.
End-User Demographics: The core demographic for MMORPGs comprises young adults and millennials with a passion for interactive storytelling and community engagement. However, the target audience is steadily broadening to encompass a wider age range.
M&A Activities: The MMORPG industry has witnessed a considerable amount of M&A activity in recent years, with larger companies acquiring smaller studios to expand their market share and game portfolios. The total value of M&A deals in the period 2019-2024 is estimated to be USD xx Million.
MMORPG Industry Market Dynamics & Trends
This section provides a detailed analysis of the MMORPG market's growth drivers, technological disruptions, consumer preferences, and competitive dynamics.
The global MMORPG market experienced significant growth in the historical period (2019-2024), primarily fueled by increasing smartphone penetration, the rising popularity of esports, and the continuous advancement of game technology. The market is expected to witness a Compound Annual Growth Rate (CAGR) of xx% during the forecast period (2025-2033). Market penetration for MMORPGs across different platforms shows varying rates of adoption. Mobile platforms exhibit the highest penetration, driven by ease of access and convenience. Technological disruptions, such as the emergence of Web3 gaming and the metaverse, are expected to reshape the industry landscape, presenting both opportunities and challenges. Changing consumer preferences, a shift towards mobile gaming, and the growing demand for cross-platform compatibility are reshaping the competitive dynamics. The industry sees strong competition from established giants and emerging independent developers, leading to innovation and diverse gaming experiences.
Dominant Regions & Segments in MMORPG Industry
This section analyzes regional and segment dominance in the MMORPG market.
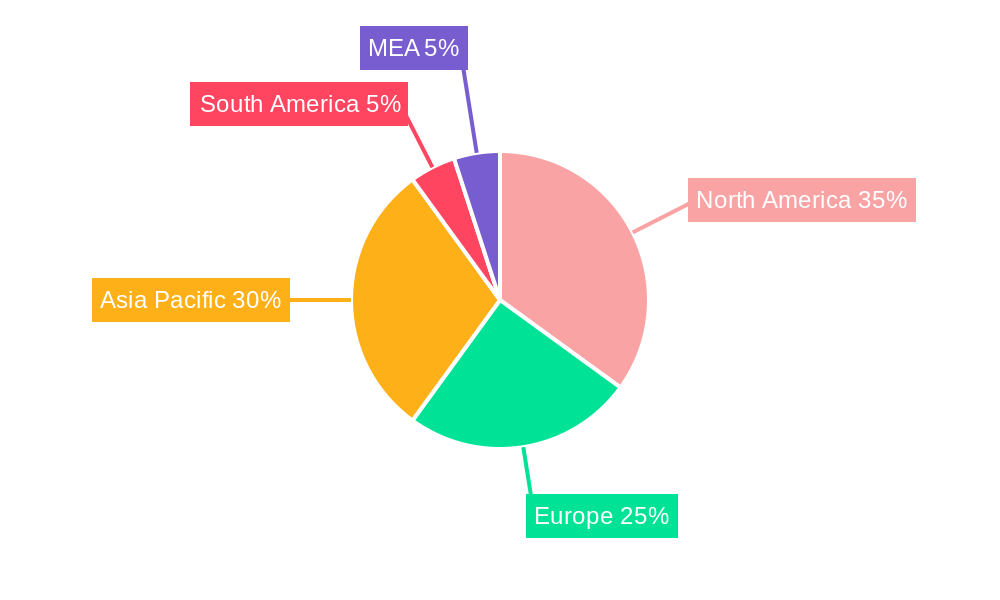
Leading Region: Asia, specifically East Asia (China, South Korea, Japan), remains the dominant region, accounting for xx% of the global MMORPG market. This dominance is driven by a large gaming population, strong internet infrastructure, and a mature mobile gaming market.
Leading Segments:
- Mobile: The mobile segment is the fastest-growing segment, driven by increasing smartphone penetration and the accessibility of mobile games.
- PC: The PC segment still retains a substantial market share due to the superior graphics and gaming experience it offers.
- Tablet: The tablet segment is smaller compared to mobile and PC, but still shows consistent growth.
- Gaming Console: The gaming console segment's growth is moderate, impacted by its higher price point and niche gaming culture.
Key Drivers for Regional Dominance: Several factors contribute to the dominance of the Asian region. These include:
- Strong Government Support: Governments in many Asian countries actively support the growth of the gaming industry through favorable policies and investments.
- High Internet Penetration: High levels of internet access provide a robust infrastructure for online gaming.
- High Mobile Penetration: High mobile phone ownership contributes to the significant growth of the mobile gaming segment.
- Strong Developer Base: A large pool of talented game developers contributes to the innovative development of MMORPGs.
MMORPG Industry Product Innovations
Recent innovations in MMORPGs include enhanced graphics, immersive storylines, improved social features, and cross-platform compatibility. Web3 integration is a notable trend, adding elements of blockchain technology and NFTs to the gaming experience. This improves user engagement and offers new monetization strategies, aligning with the increasing demand for personalized and rewarding gameplay.
Report Scope & Segmentation Analysis
This report segments the MMORPG market by Gaming Platform: Mobile, Tablet, Gaming Console, and PC.
Mobile: This segment is projected to witness the highest growth rate during the forecast period, driven by the increasing adoption of smartphones. Market size is estimated at USD xx Million in 2025. The segment is characterized by high competition and a rapidly evolving technological landscape.
Tablet: The tablet segment is expected to show steady growth, benefiting from the portability and convenience of tablets for gaming. Market size is estimated at USD xx Million in 2025. Competition in this segment is less intense than in the mobile segment.
Gaming Console: This segment experiences moderate growth, largely due to the higher initial investment and console-specific gaming communities. Market size is estimated at USD xx Million in 2025.
PC: The PC segment remains significant, fueled by its superior graphics capabilities and dedicated gamer communities. Market size is estimated at USD xx Million in 2025. The segment faces competition from other game genres and the mobile gaming segment.
Key Drivers of MMORPG Industry Growth
Several factors drive growth in the MMORPG industry: Technological advancements in game engines and graphics, increased accessibility via mobile and cloud platforms, the growing popularity of esports, and the desire for immersive social experiences. Government regulations and support for the gaming industry also play a key role, especially in regions with a high concentration of developers and players.
Challenges in the MMORPG Industry Sector
The MMORPG industry faces challenges such as maintaining player engagement in a highly competitive market, managing the costs associated with game development and maintenance, and adapting to evolving technology. Regulatory changes and ensuring data security also pose challenges. The increasing costs of game development and the fierce competition among developers pose a continuous threat to profitability. The churn rate among players poses another notable challenge.
Emerging Opportunities in MMORPG Industry
The rise of Web3 gaming, metaverse integration, and the growing demand for cross-platform compatibility present exciting opportunities for growth and innovation. Expansion into new markets and the development of specialized genres within the MMORPG niche offer further avenues for growth.
Leading Players in the MMORPG Industry Market
- Daybreak Game Company
- Electronic Arts Inc
- Amazon Game Studios
- Giant Interactive Group Inc
- Aeria Games
- CCP games UK Ltd
- NCSOFT Corporation
- Activision Blizzard Inc
- Neteasegames Inc
- Tencent Holdings Limited
- Bright Star Studios
- Ubisoft Entertainment SA
- Jagex Limited
- Gravity Corporatio
- Nexon Co Ltd
Key Developments in MMORPG Industry
- May 2022: Gravity Co Ltd launched 'Ragnarok V: Returns,' a 3D MMORPG with cross-platform functionality.
- June 2022: Clockwork Labs secured USD 22 Million in funding for its MMORPG, BitCraft.
- September 2022: ThumbAge released the mobile MMORPG Dekaron G globally.
- January 2023: The Search for Animera, a web3-native MMORPG, launched on ImmutableX.
Future Outlook for MMORPG Industry Market
The MMORPG market is poised for sustained growth, driven by technological advancements, expanding market penetration across mobile and emerging platforms, and the increasing appeal of immersive gaming experiences. Strategic opportunities exist in leveraging Web3 technologies, expanding into new markets, and focusing on developing compelling storylines and cross-platform capabilities to retain player engagement and attract a broader audience.
MMORPG Industry Segmentation
-
1. Gaming Platform
- 1.1. Mobile
- 1.2. Tablet
- 1.3. Gaming Console
- 1.4. PC
MMORPG Industry Segmentation By Geography
-
1. North America
- 1.1. United States
- 1.2. Canada
-
2. Europe
- 2.1. United Kingdom
- 2.2. Germany
- 2.3. France
- 2.4. Italy
- 2.5. Russia
-
3. Asia
- 3.1. China
- 3.2. India
- 3.3. Japan
- 3.4. South Korea
- 4. Australia and New Zealand
-
5. Latin America
- 5.1. Brazil
- 5.2. Mexico
- 5.3. Argentina
-
6. Middle East and Africa
- 6.1. United Arab Emirates
- 6.2. Saudi Arabia
- 6.3. South Africa
MMORPG Industry REPORT HIGHLIGHTS
| Aspects | Details |
|---|---|
| Study Period | 2019-2033 |
| Base Year | 2024 |
| Estimated Year | 2025 |
| Forecast Period | 2025-2033 |
| Historical Period | 2019-2024 |
| Growth Rate | CAGR of 10.75% from 2019-2033 |
| Segmentation |
|
Table of Contents
- 1. Introduction
- 1.1. Research Scope
- 1.2. Market Segmentation
- 1.3. Research Methodology
- 1.4. Definitions and Assumptions
- 2. Executive Summary
- 2.1. Introduction
- 3. Market Dynamics
- 3.1. Introduction
- 3.2. Market Drivers
- 3.2.1 Rising Smartphone Penetration and Increasing Penetration of Internet among Developing Economies; Technological Advancement such as IoT
- 3.2.2 AR
- 3.2.3 and VR; Emergence of Gamification
- 3.3. Market Restrains
- 3.3.1 Costs
- 3.3.2 Interoperability
- 3.3.3 and Security Concerns
- 3.4. Market Trends
- 3.4.1. Rising Smartphone Penetration and Increasing Penetration of Internet among Developing Economies may Drive the Market Growth
- 4. Market Factor Analysis
- 4.1. Porters Five Forces
- 4.2. Supply/Value Chain
- 4.3. PESTEL analysis
- 4.4. Market Entropy
- 4.5. Patent/Trademark Analysis
- 5. Global MMORPG Industry Analysis, Insights and Forecast, 2019-2031
- 5.1. Market Analysis, Insights and Forecast - by Gaming Platform
- 5.1.1. Mobile
- 5.1.2. Tablet
- 5.1.3. Gaming Console
- 5.1.4. PC
- 5.2. Market Analysis, Insights and Forecast - by Region
- 5.2.1. North America
- 5.2.2. Europe
- 5.2.3. Asia
- 5.2.4. Australia and New Zealand
- 5.2.5. Latin America
- 5.2.6. Middle East and Africa
- 5.1. Market Analysis, Insights and Forecast - by Gaming Platform
- 6. North America MMORPG Industry Analysis, Insights and Forecast, 2019-2031
- 6.1. Market Analysis, Insights and Forecast - by Gaming Platform
- 6.1.1. Mobile
- 6.1.2. Tablet
- 6.1.3. Gaming Console
- 6.1.4. PC
- 6.1. Market Analysis, Insights and Forecast - by Gaming Platform
- 7. Europe MMORPG Industry Analysis, Insights and Forecast, 2019-2031
- 7.1. Market Analysis, Insights and Forecast - by Gaming Platform
- 7.1.1. Mobile
- 7.1.2. Tablet
- 7.1.3. Gaming Console
- 7.1.4. PC
- 7.1. Market Analysis, Insights and Forecast - by Gaming Platform
- 8. Asia MMORPG Industry Analysis, Insights and Forecast, 2019-2031
- 8.1. Market Analysis, Insights and Forecast - by Gaming Platform
- 8.1.1. Mobile
- 8.1.2. Tablet
- 8.1.3. Gaming Console
- 8.1.4. PC
- 8.1. Market Analysis, Insights and Forecast - by Gaming Platform
- 9. Australia and New Zealand MMORPG Industry Analysis, Insights and Forecast, 2019-2031
- 9.1. Market Analysis, Insights and Forecast - by Gaming Platform
- 9.1.1. Mobile
- 9.1.2. Tablet
- 9.1.3. Gaming Console
- 9.1.4. PC
- 9.1. Market Analysis, Insights and Forecast - by Gaming Platform
- 10. Latin America MMORPG Industry Analysis, Insights and Forecast, 2019-2031
- 10.1. Market Analysis, Insights and Forecast - by Gaming Platform
- 10.1.1. Mobile
- 10.1.2. Tablet
- 10.1.3. Gaming Console
- 10.1.4. PC
- 10.1. Market Analysis, Insights and Forecast - by Gaming Platform
- 11. Middle East and Africa MMORPG Industry Analysis, Insights and Forecast, 2019-2031
- 11.1. Market Analysis, Insights and Forecast - by Gaming Platform
- 11.1.1. Mobile
- 11.1.2. Tablet
- 11.1.3. Gaming Console
- 11.1.4. PC
- 11.1. Market Analysis, Insights and Forecast - by Gaming Platform
- 12. North America MMORPG Industry Analysis, Insights and Forecast, 2019-2031
- 12.1. Market Analysis, Insights and Forecast - By Country/Sub-region
- 12.1.1 United States
- 12.1.2 Canada
- 12.1.3 Mexico
- 13. Europe MMORPG Industry Analysis, Insights and Forecast, 2019-2031
- 13.1. Market Analysis, Insights and Forecast - By Country/Sub-region
- 13.1.1 Germany
- 13.1.2 United Kingdom
- 13.1.3 France
- 13.1.4 Spain
- 13.1.5 Italy
- 13.1.6 Spain
- 13.1.7 Belgium
- 13.1.8 Netherland
- 13.1.9 Nordics
- 13.1.10 Rest of Europe
- 14. Asia Pacific MMORPG Industry Analysis, Insights and Forecast, 2019-2031
- 14.1. Market Analysis, Insights and Forecast - By Country/Sub-region
- 14.1.1 China
- 14.1.2 Japan
- 14.1.3 India
- 14.1.4 South Korea
- 14.1.5 Southeast Asia
- 14.1.6 Australia
- 14.1.7 Indonesia
- 14.1.8 Phillipes
- 14.1.9 Singapore
- 14.1.10 Thailandc
- 14.1.11 Rest of Asia Pacific
- 15. South America MMORPG Industry Analysis, Insights and Forecast, 2019-2031
- 15.1. Market Analysis, Insights and Forecast - By Country/Sub-region
- 15.1.1 Brazil
- 15.1.2 Argentina
- 15.1.3 Peru
- 15.1.4 Chile
- 15.1.5 Colombia
- 15.1.6 Ecuador
- 15.1.7 Venezuela
- 15.1.8 Rest of South America
- 16. MEA MMORPG Industry Analysis, Insights and Forecast, 2019-2031
- 16.1. Market Analysis, Insights and Forecast - By Country/Sub-region
- 16.1.1 United Arab Emirates
- 16.1.2 Saudi Arabia
- 16.1.3 South Africa
- 16.1.4 Rest of Middle East and Africa
- 17. Competitive Analysis
- 17.1. Global Market Share Analysis 2024
- 17.2. Company Profiles
- 17.2.1 Daybreak Game Company
- 17.2.1.1. Overview
- 17.2.1.2. Products
- 17.2.1.3. SWOT Analysis
- 17.2.1.4. Recent Developments
- 17.2.1.5. Financials (Based on Availability)
- 17.2.2 Electronic Arts Inc
- 17.2.2.1. Overview
- 17.2.2.2. Products
- 17.2.2.3. SWOT Analysis
- 17.2.2.4. Recent Developments
- 17.2.2.5. Financials (Based on Availability)
- 17.2.3 Amazon Game Studios
- 17.2.3.1. Overview
- 17.2.3.2. Products
- 17.2.3.3. SWOT Analysis
- 17.2.3.4. Recent Developments
- 17.2.3.5. Financials (Based on Availability)
- 17.2.4 Giant Interactive Group Inc
- 17.2.4.1. Overview
- 17.2.4.2. Products
- 17.2.4.3. SWOT Analysis
- 17.2.4.4. Recent Developments
- 17.2.4.5. Financials (Based on Availability)
- 17.2.5 Aeria Games
- 17.2.5.1. Overview
- 17.2.5.2. Products
- 17.2.5.3. SWOT Analysis
- 17.2.5.4. Recent Developments
- 17.2.5.5. Financials (Based on Availability)
- 17.2.6 CCP games UK Ltd
- 17.2.6.1. Overview
- 17.2.6.2. Products
- 17.2.6.3. SWOT Analysis
- 17.2.6.4. Recent Developments
- 17.2.6.5. Financials (Based on Availability)
- 17.2.7 NCSOFT Corporation
- 17.2.7.1. Overview
- 17.2.7.2. Products
- 17.2.7.3. SWOT Analysis
- 17.2.7.4. Recent Developments
- 17.2.7.5. Financials (Based on Availability)
- 17.2.8 Activision Blizzard Inc
- 17.2.8.1. Overview
- 17.2.8.2. Products
- 17.2.8.3. SWOT Analysis
- 17.2.8.4. Recent Developments
- 17.2.8.5. Financials (Based on Availability)
- 17.2.9 Neteasegames Inc
- 17.2.9.1. Overview
- 17.2.9.2. Products
- 17.2.9.3. SWOT Analysis
- 17.2.9.4. Recent Developments
- 17.2.9.5. Financials (Based on Availability)
- 17.2.10 Tencent Holdings Limited
- 17.2.10.1. Overview
- 17.2.10.2. Products
- 17.2.10.3. SWOT Analysis
- 17.2.10.4. Recent Developments
- 17.2.10.5. Financials (Based on Availability)
- 17.2.11 Bright Star Studios
- 17.2.11.1. Overview
- 17.2.11.2. Products
- 17.2.11.3. SWOT Analysis
- 17.2.11.4. Recent Developments
- 17.2.11.5. Financials (Based on Availability)
- 17.2.12 Ubisoft Entertainment SA
- 17.2.12.1. Overview
- 17.2.12.2. Products
- 17.2.12.3. SWOT Analysis
- 17.2.12.4. Recent Developments
- 17.2.12.5. Financials (Based on Availability)
- 17.2.13 Jagex Limited
- 17.2.13.1. Overview
- 17.2.13.2. Products
- 17.2.13.3. SWOT Analysis
- 17.2.13.4. Recent Developments
- 17.2.13.5. Financials (Based on Availability)
- 17.2.14 Gravity Corporatio
- 17.2.14.1. Overview
- 17.2.14.2. Products
- 17.2.14.3. SWOT Analysis
- 17.2.14.4. Recent Developments
- 17.2.14.5. Financials (Based on Availability)
- 17.2.15 Nexon Co Ltd
- 17.2.15.1. Overview
- 17.2.15.2. Products
- 17.2.15.3. SWOT Analysis
- 17.2.15.4. Recent Developments
- 17.2.15.5. Financials (Based on Availability)
- 17.2.1 Daybreak Game Company
List of Figures
- Figure 1: Global MMORPG Industry Revenue Breakdown (Million, %) by Region 2024 & 2032
- Figure 2: North America MMORPG Industry Revenue (Million), by Country 2024 & 2032
- Figure 3: North America MMORPG Industry Revenue Share (%), by Country 2024 & 2032
- Figure 4: Europe MMORPG Industry Revenue (Million), by Country 2024 & 2032
- Figure 5: Europe MMORPG Industry Revenue Share (%), by Country 2024 & 2032
- Figure 6: Asia Pacific MMORPG Industry Revenue (Million), by Country 2024 & 2032
- Figure 7: Asia Pacific MMORPG Industry Revenue Share (%), by Country 2024 & 2032
- Figure 8: South America MMORPG Industry Revenue (Million), by Country 2024 & 2032
- Figure 9: South America MMORPG Industry Revenue Share (%), by Country 2024 & 2032
- Figure 10: MEA MMORPG Industry Revenue (Million), by Country 2024 & 2032
- Figure 11: MEA MMORPG Industry Revenue Share (%), by Country 2024 & 2032
- Figure 12: North America MMORPG Industry Revenue (Million), by Gaming Platform 2024 & 2032
- Figure 13: North America MMORPG Industry Revenue Share (%), by Gaming Platform 2024 & 2032
- Figure 14: North America MMORPG Industry Revenue (Million), by Country 2024 & 2032
- Figure 15: North America MMORPG Industry Revenue Share (%), by Country 2024 & 2032
- Figure 16: Europe MMORPG Industry Revenue (Million), by Gaming Platform 2024 & 2032
- Figure 17: Europe MMORPG Industry Revenue Share (%), by Gaming Platform 2024 & 2032
- Figure 18: Europe MMORPG Industry Revenue (Million), by Country 2024 & 2032
- Figure 19: Europe MMORPG Industry Revenue Share (%), by Country 2024 & 2032
- Figure 20: Asia MMORPG Industry Revenue (Million), by Gaming Platform 2024 & 2032
- Figure 21: Asia MMORPG Industry Revenue Share (%), by Gaming Platform 2024 & 2032
- Figure 22: Asia MMORPG Industry Revenue (Million), by Country 2024 & 2032
- Figure 23: Asia MMORPG Industry Revenue Share (%), by Country 2024 & 2032
- Figure 24: Australia and New Zealand MMORPG Industry Revenue (Million), by Gaming Platform 2024 & 2032
- Figure 25: Australia and New Zealand MMORPG Industry Revenue Share (%), by Gaming Platform 2024 & 2032
- Figure 26: Australia and New Zealand MMORPG Industry Revenue (Million), by Country 2024 & 2032
- Figure 27: Australia and New Zealand MMORPG Industry Revenue Share (%), by Country 2024 & 2032
- Figure 28: Latin America MMORPG Industry Revenue (Million), by Gaming Platform 2024 & 2032
- Figure 29: Latin America MMORPG Industry Revenue Share (%), by Gaming Platform 2024 & 2032
- Figure 30: Latin America MMORPG Industry Revenue (Million), by Country 2024 & 2032
- Figure 31: Latin America MMORPG Industry Revenue Share (%), by Country 2024 & 2032
- Figure 32: Middle East and Africa MMORPG Industry Revenue (Million), by Gaming Platform 2024 & 2032
- Figure 33: Middle East and Africa MMORPG Industry Revenue Share (%), by Gaming Platform 2024 & 2032
- Figure 34: Middle East and Africa MMORPG Industry Revenue (Million), by Country 2024 & 2032
- Figure 35: Middle East and Africa MMORPG Industry Revenue Share (%), by Country 2024 & 2032
List of Tables
- Table 1: Global MMORPG Industry Revenue Million Forecast, by Region 2019 & 2032
- Table 2: Global MMORPG Industry Revenue Million Forecast, by Gaming Platform 2019 & 2032
- Table 3: Global MMORPG Industry Revenue Million Forecast, by Region 2019 & 2032
- Table 4: Global MMORPG Industry Revenue Million Forecast, by Country 2019 & 2032
- Table 5: United States MMORPG Industry Revenue (Million) Forecast, by Application 2019 & 2032
- Table 6: Canada MMORPG Industry Revenue (Million) Forecast, by Application 2019 & 2032
- Table 7: Mexico MMORPG Industry Revenue (Million) Forecast, by Application 2019 & 2032
- Table 8: Global MMORPG Industry Revenue Million Forecast, by Country 2019 & 2032
- Table 9: Germany MMORPG Industry Revenue (Million) Forecast, by Application 2019 & 2032
- Table 10: United Kingdom MMORPG Industry Revenue (Million) Forecast, by Application 2019 & 2032
- Table 11: France MMORPG Industry Revenue (Million) Forecast, by Application 2019 & 2032
- Table 12: Spain MMORPG Industry Revenue (Million) Forecast, by Application 2019 & 2032
- Table 13: Italy MMORPG Industry Revenue (Million) Forecast, by Application 2019 & 2032
- Table 14: Spain MMORPG Industry Revenue (Million) Forecast, by Application 2019 & 2032
- Table 15: Belgium MMORPG Industry Revenue (Million) Forecast, by Application 2019 & 2032
- Table 16: Netherland MMORPG Industry Revenue (Million) Forecast, by Application 2019 & 2032
- Table 17: Nordics MMORPG Industry Revenue (Million) Forecast, by Application 2019 & 2032
- Table 18: Rest of Europe MMORPG Industry Revenue (Million) Forecast, by Application 2019 & 2032
- Table 19: Global MMORPG Industry Revenue Million Forecast, by Country 2019 & 2032
- Table 20: China MMORPG Industry Revenue (Million) Forecast, by Application 2019 & 2032
- Table 21: Japan MMORPG Industry Revenue (Million) Forecast, by Application 2019 & 2032
- Table 22: India MMORPG Industry Revenue (Million) Forecast, by Application 2019 & 2032
- Table 23: South Korea MMORPG Industry Revenue (Million) Forecast, by Application 2019 & 2032
- Table 24: Southeast Asia MMORPG Industry Revenue (Million) Forecast, by Application 2019 & 2032
- Table 25: Australia MMORPG Industry Revenue (Million) Forecast, by Application 2019 & 2032
- Table 26: Indonesia MMORPG Industry Revenue (Million) Forecast, by Application 2019 & 2032
- Table 27: Phillipes MMORPG Industry Revenue (Million) Forecast, by Application 2019 & 2032
- Table 28: Singapore MMORPG Industry Revenue (Million) Forecast, by Application 2019 & 2032
- Table 29: Thailandc MMORPG Industry Revenue (Million) Forecast, by Application 2019 & 2032
- Table 30: Rest of Asia Pacific MMORPG Industry Revenue (Million) Forecast, by Application 2019 & 2032
- Table 31: Global MMORPG Industry Revenue Million Forecast, by Country 2019 & 2032
- Table 32: Brazil MMORPG Industry Revenue (Million) Forecast, by Application 2019 & 2032
- Table 33: Argentina MMORPG Industry Revenue (Million) Forecast, by Application 2019 & 2032
- Table 34: Peru MMORPG Industry Revenue (Million) Forecast, by Application 2019 & 2032
- Table 35: Chile MMORPG Industry Revenue (Million) Forecast, by Application 2019 & 2032
- Table 36: Colombia MMORPG Industry Revenue (Million) Forecast, by Application 2019 & 2032
- Table 37: Ecuador MMORPG Industry Revenue (Million) Forecast, by Application 2019 & 2032
- Table 38: Venezuela MMORPG Industry Revenue (Million) Forecast, by Application 2019 & 2032
- Table 39: Rest of South America MMORPG Industry Revenue (Million) Forecast, by Application 2019 & 2032
- Table 40: Global MMORPG Industry Revenue Million Forecast, by Country 2019 & 2032
- Table 41: United Arab Emirates MMORPG Industry Revenue (Million) Forecast, by Application 2019 & 2032
- Table 42: Saudi Arabia MMORPG Industry Revenue (Million) Forecast, by Application 2019 & 2032
- Table 43: South Africa MMORPG Industry Revenue (Million) Forecast, by Application 2019 & 2032
- Table 44: Rest of Middle East and Africa MMORPG Industry Revenue (Million) Forecast, by Application 2019 & 2032
- Table 45: Global MMORPG Industry Revenue Million Forecast, by Gaming Platform 2019 & 2032
- Table 46: Global MMORPG Industry Revenue Million Forecast, by Country 2019 & 2032
- Table 47: United States MMORPG Industry Revenue (Million) Forecast, by Application 2019 & 2032
- Table 48: Canada MMORPG Industry Revenue (Million) Forecast, by Application 2019 & 2032
- Table 49: Global MMORPG Industry Revenue Million Forecast, by Gaming Platform 2019 & 2032
- Table 50: Global MMORPG Industry Revenue Million Forecast, by Country 2019 & 2032
- Table 51: United Kingdom MMORPG Industry Revenue (Million) Forecast, by Application 2019 & 2032
- Table 52: Germany MMORPG Industry Revenue (Million) Forecast, by Application 2019 & 2032
- Table 53: France MMORPG Industry Revenue (Million) Forecast, by Application 2019 & 2032
- Table 54: Italy MMORPG Industry Revenue (Million) Forecast, by Application 2019 & 2032
- Table 55: Russia MMORPG Industry Revenue (Million) Forecast, by Application 2019 & 2032
- Table 56: Global MMORPG Industry Revenue Million Forecast, by Gaming Platform 2019 & 2032
- Table 57: Global MMORPG Industry Revenue Million Forecast, by Country 2019 & 2032
- Table 58: China MMORPG Industry Revenue (Million) Forecast, by Application 2019 & 2032
- Table 59: India MMORPG Industry Revenue (Million) Forecast, by Application 2019 & 2032
- Table 60: Japan MMORPG Industry Revenue (Million) Forecast, by Application 2019 & 2032
- Table 61: South Korea MMORPG Industry Revenue (Million) Forecast, by Application 2019 & 2032
- Table 62: Global MMORPG Industry Revenue Million Forecast, by Gaming Platform 2019 & 2032
- Table 63: Global MMORPG Industry Revenue Million Forecast, by Country 2019 & 2032
- Table 64: Global MMORPG Industry Revenue Million Forecast, by Gaming Platform 2019 & 2032
- Table 65: Global MMORPG Industry Revenue Million Forecast, by Country 2019 & 2032
- Table 66: Brazil MMORPG Industry Revenue (Million) Forecast, by Application 2019 & 2032
- Table 67: Mexico MMORPG Industry Revenue (Million) Forecast, by Application 2019 & 2032
- Table 68: Argentina MMORPG Industry Revenue (Million) Forecast, by Application 2019 & 2032
- Table 69: Global MMORPG Industry Revenue Million Forecast, by Gaming Platform 2019 & 2032
- Table 70: Global MMORPG Industry Revenue Million Forecast, by Country 2019 & 2032
- Table 71: United Arab Emirates MMORPG Industry Revenue (Million) Forecast, by Application 2019 & 2032
- Table 72: Saudi Arabia MMORPG Industry Revenue (Million) Forecast, by Application 2019 & 2032
- Table 73: South Africa MMORPG Industry Revenue (Million) Forecast, by Application 2019 & 2032
Frequently Asked Questions
1. What is the projected Compound Annual Growth Rate (CAGR) of the MMORPG Industry?
The projected CAGR is approximately 10.75%.
2. Which companies are prominent players in the MMORPG Industry?
Key companies in the market include Daybreak Game Company, Electronic Arts Inc, Amazon Game Studios, Giant Interactive Group Inc, Aeria Games, CCP games UK Ltd, NCSOFT Corporation, Activision Blizzard Inc, Neteasegames Inc, Tencent Holdings Limited, Bright Star Studios, Ubisoft Entertainment SA, Jagex Limited, Gravity Corporatio, Nexon Co Ltd.
3. What are the main segments of the MMORPG Industry?
The market segments include Gaming Platform.
4. Can you provide details about the market size?
The market size is estimated to be USD 25.34 Million as of 2022.
5. What are some drivers contributing to market growth?
Rising Smartphone Penetration and Increasing Penetration of Internet among Developing Economies; Technological Advancement such as IoT. AR. and VR; Emergence of Gamification.
6. What are the notable trends driving market growth?
Rising Smartphone Penetration and Increasing Penetration of Internet among Developing Economies may Drive the Market Growth.
7. Are there any restraints impacting market growth?
Costs. Interoperability. and Security Concerns.
8. Can you provide examples of recent developments in the market?
January 2023: The development team behind Search for Animera, a web3-native massively multiplayer online role-playing game (MMORPG), announced the game's launch on ImmutableX, the go-to Ethereum platform for creating and scaling web3 games. By partnering with ImmutableX and utilizing its platform for the project's infrastructure, the developers of Animera can make sure that users may benefit from the simplicity of quick transactions, free mining, and trade, as well as the strength of Ethereum's built-in security.
9. What pricing options are available for accessing the report?
Pricing options include single-user, multi-user, and enterprise licenses priced at USD 4750, USD 5250, and USD 8750 respectively.
10. Is the market size provided in terms of value or volume?
The market size is provided in terms of value, measured in Million.
11. Are there any specific market keywords associated with the report?
Yes, the market keyword associated with the report is "MMORPG Industry," which aids in identifying and referencing the specific market segment covered.
12. How do I determine which pricing option suits my needs best?
The pricing options vary based on user requirements and access needs. Individual users may opt for single-user licenses, while businesses requiring broader access may choose multi-user or enterprise licenses for cost-effective access to the report.
13. Are there any additional resources or data provided in the MMORPG Industry report?
While the report offers comprehensive insights, it's advisable to review the specific contents or supplementary materials provided to ascertain if additional resources or data are available.
14. How can I stay updated on further developments or reports in the MMORPG Industry?
To stay informed about further developments, trends, and reports in the MMORPG Industry, consider subscribing to industry newsletters, following relevant companies and organizations, or regularly checking reputable industry news sources and publications.
Methodology
Step 1 - Identification of Relevant Samples Size from Population Database


Step 2 - Approaches for Defining Global Market Size (Value, Volume* & Price*)

Note*: In applicable scenarios
Step 3 - Data Sources
Primary Research
- Web Analytics
- Survey Reports
- Research Institute
- Latest Research Reports
- Opinion Leaders
Secondary Research
- Annual Reports
- White Paper
- Latest Press Release
- Industry Association
- Paid Database
- Investor Presentations

Step 4 - Data Triangulation
Involves using different sources of information in order to increase the validity of a study
These sources are likely to be stakeholders in a program - participants, other researchers, program staff, other community members, and so on.
Then we put all data in single framework & apply various statistical tools to find out the dynamic on the market.
During the analysis stage, feedback from the stakeholder groups would be compared to determine areas of agreement as well as areas of divergence


