
Key Insights
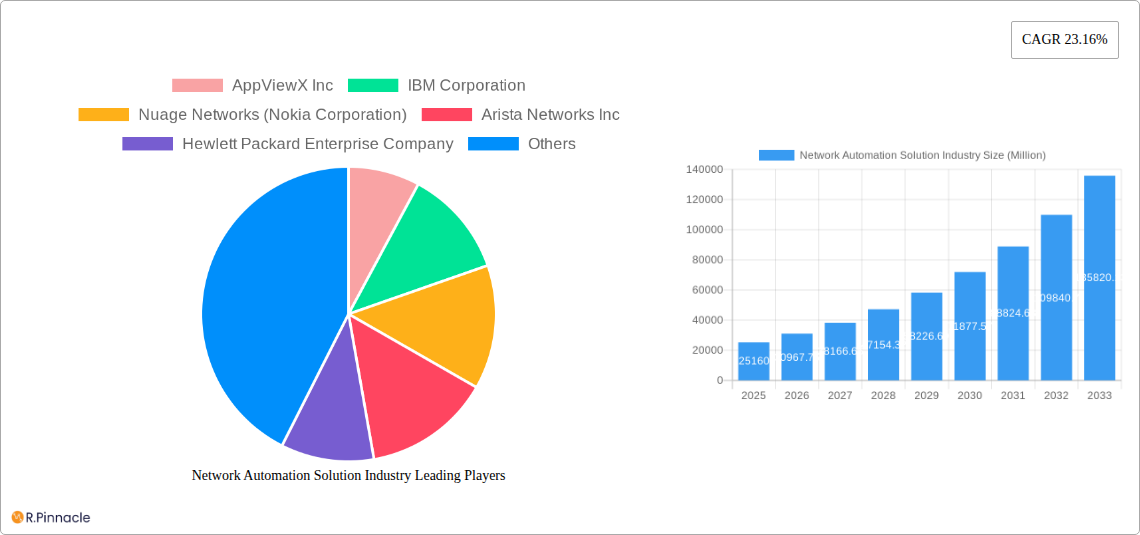
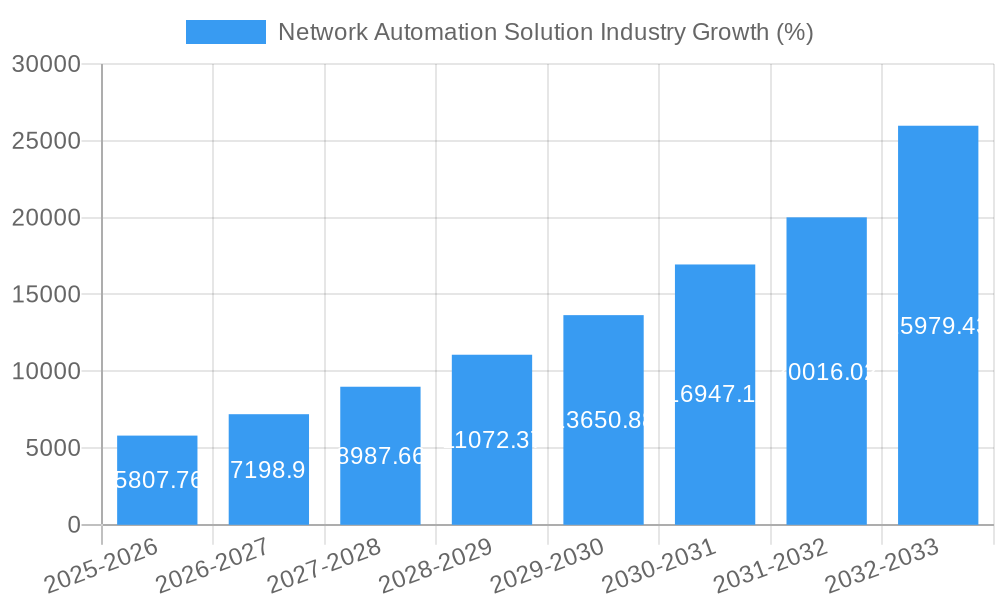
The Network Automation Solutions market is experiencing robust growth, projected to reach \$25.16 billion in 2025 and exhibiting a Compound Annual Growth Rate (CAGR) of 23.16% from 2025 to 2033. This expansion is driven by several key factors. Firstly, the increasing complexity of network infrastructure, particularly with the rise of cloud computing and multi-cloud environments, necessitates automation for efficient management and reduced operational costs. Secondly, the growing adoption of DevOps and Agile methodologies within IT organizations demands automated network provisioning and configuration to accelerate deployment cycles and improve agility. Thirdly, the escalating cybersecurity threats necessitate automated security measures, including vulnerability management and incident response, to enhance network resilience. Finally, the shortage of skilled network engineers globally fuels the demand for automated tools that streamline operations and reduce the reliance on manual intervention.
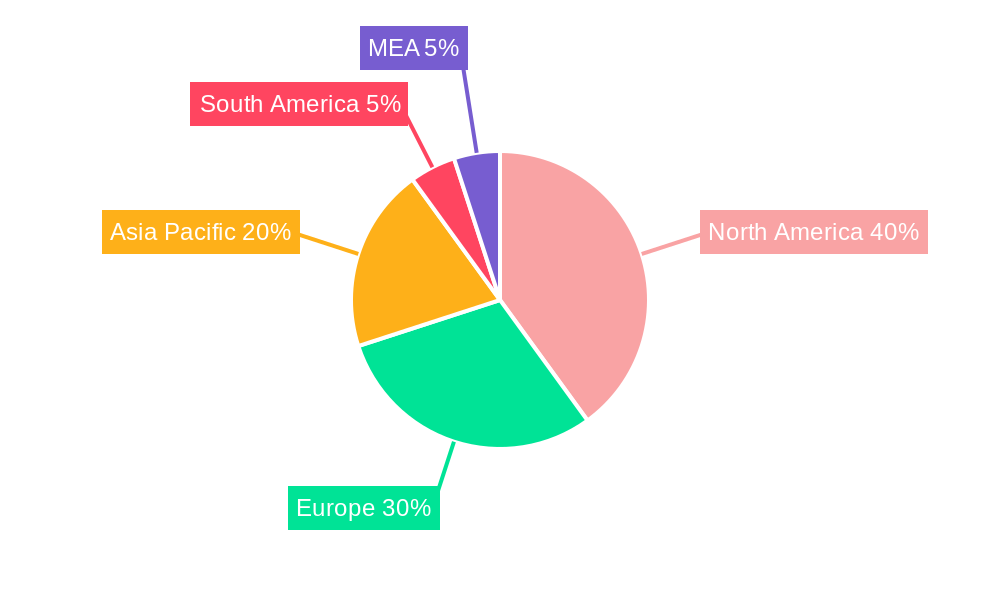
Segmentation analysis reveals that the solution type segment (e.g., network configuration automation, network monitoring, and orchestration) is likely to hold a significant market share, driven by the increasing demand for comprehensive network management capabilities. Geographically, North America currently dominates the market due to early adoption of automation technologies and a robust IT infrastructure. However, the Asia-Pacific region is anticipated to show the fastest growth over the forecast period, driven by increasing digital transformation initiatives and investments in advanced technologies across several sectors including IT & Telecom, Manufacturing, and Energy & Utilities. Competitive rivalry is intense, with established players like Cisco, IBM, and Juniper Networks competing with emerging companies offering specialized solutions. The market is expected to see further consolidation in the coming years, with larger companies potentially acquiring smaller, specialized firms to expand their automation portfolios.
Network Automation Solution Industry Report: 2019-2033
This comprehensive report provides an in-depth analysis of the Network Automation Solution industry, projecting a robust market expansion throughout the forecast period (2025-2033). The study covers market sizing, segmentation, competitive landscape, and key growth drivers, offering invaluable insights for industry professionals, investors, and strategic decision-makers. With a base year of 2025 and a study period spanning 2019-2033, this report offers a historical perspective and future projections, enabling informed strategic planning. The global market valuation is projected at xx Million in 2025, demonstrating significant growth potential.
Network Automation Solution Industry Market Structure & Innovation Trends
The Network Automation Solution market exhibits a moderately concentrated structure, with several key players holding significant market share. The leading companies include IBM Corporation, Cisco Systems Inc, Juniper Networks Inc, Arista Networks Inc, and Hewlett Packard Enterprise Company. However, the market also accommodates numerous smaller players and niche providers, fostering innovation and competition.
Market share distribution is dynamic, with larger players continually investing in research and development (R&D) to maintain a competitive edge. In 2024, IBM held an estimated xx% market share, while Cisco held approximately xx%. Smaller players typically focus on specific segments or specialized solutions to cater to unique customer needs.
Innovation drivers include the growing adoption of cloud computing, software-defined networking (SDN), and the Internet of Things (IoT). Regulatory frameworks, such as data privacy regulations (GDPR, CCPA), influence the design and deployment of network automation solutions. Product substitutes, while limited, include manual network management practices, but these are increasingly inefficient for managing complex modern networks.
M&A activity has been substantial, with deal values exceeding xx Million in the last five years. These activities reflect the consolidation trend within the industry and the pursuit of technological synergies. For instance, a significant merger between two major players in 2023 resulted in a market valuation increase of approximately xx Million.
- Market Concentration: Moderately concentrated, with several major players dominating the market.
- Innovation Drivers: Cloud computing, SDN, IoT, and increasing network complexity.
- Regulatory Frameworks: Influence solution design and data privacy compliance.
- M&A Activity: Significant activity exceeding xx Million over the past five years.
Network Automation Solution Industry Market Dynamics & Trends
The Network Automation Solution market exhibits a robust Compound Annual Growth Rate (CAGR) of xx% during the forecast period (2025-2033). This growth is propelled by several key factors. The increasing complexity of modern networks, driven by the expansion of cloud deployments and the proliferation of IoT devices, necessitates efficient automation solutions. Businesses across various industries are actively seeking ways to reduce operational costs, improve network efficiency, and enhance security, thereby driving market penetration for network automation solutions.
Technological disruptions, such as advancements in artificial intelligence (AI) and machine learning (ML), are further enhancing the capabilities of network automation tools. These technologies enable predictive analytics and proactive network management, leading to improved performance and reduced downtime. Consumer preferences are shifting towards cloud-based and software-as-a-service (SaaS) solutions, due to their scalability, accessibility, and cost-effectiveness. This preference significantly impacts market dynamics.
Competitive dynamics are shaping the market, with established players facing increased pressure from emerging companies offering innovative solutions. The market is witnessing a surge in strategic partnerships and alliances, emphasizing the importance of collaboration in achieving market leadership. Market penetration is steadily increasing across various industry sectors, with strong adoption rates observed in IT & Telecom and the financial services sector.
Dominant Regions & Segments in Network Automation Solution Industry
North America currently holds the largest market share in the Network Automation Solution industry, driven by early adoption of advanced technologies and a robust IT infrastructure. Europe is a rapidly growing market, while the Asia-Pacific region shows immense potential for future expansion.
Key Drivers by Segment:
- By Component: Solution Type: Network management solutions currently dominate, followed by network monitoring and analytics. However, the intent-based networking segment demonstrates the highest growth potential.
- Intent-based Networking: Service Type: Network optimization and automation services are highly sought-after, followed by security and compliance services.
- By Deployment: Cloud-based solutions are experiencing the most rapid growth due to scalability and cost-effectiveness, followed by hybrid deployments. On-premise deployments remain prevalent in specific industry segments.
- By End-user Industry: The IT and Telecom sector is the leading adopter, followed by Banking and Financial Services. Manufacturing and Energy & Utility sectors are experiencing increasing adoption rates.
- By Network Type: Virtual and hybrid network deployments are driving the growth in the market due to their flexibility and scalability, with physical networks maintaining significant adoption.
Dominance Analysis:
North America's dominance stems from substantial investments in IT infrastructure, high technological proficiency, and the presence of major technology companies. The region's advanced regulatory frameworks also stimulate innovation. The strong growth in the cloud-based deployment segment reflects the industry's ongoing digital transformation. The IT and Telecom sector's leading role is attributed to its high dependence on sophisticated network management and the need for high network availability.
Network Automation Solution Industry Product Innovations
Recent product innovations focus on AI-powered network management, predictive analytics, and enhanced security features. The integration of machine learning algorithms enables proactive identification and resolution of network issues, minimizing downtime and improving efficiency. A key trend is the emergence of intent-based networking, which allows network administrators to define desired network outcomes instead of configuring individual devices. These solutions align with the market's increasing demand for simplified network management and improved operational efficiency. These innovations deliver significant competitive advantages by providing improved network visibility, automation capabilities, and reduced operational costs, thereby attracting a broader range of customers.
Report Scope & Segmentation Analysis
This report segments the Network Automation Solution market comprehensively:
- By Component: Solution Type (Network Management, Network Monitoring & Analytics, Intent-based Networking, and others) – projecting a xx Million market size for Network Management by 2033.
- Intent-based Networking: Service Type: Network Optimization and Automation, Security and Compliance, others – with Network Optimization and Automation leading at xx Million by 2033.
- By Deployment: Cloud, On-premise, Hybrid – Cloud deployments projected to dominate with xx Million by 2033.
- By End-user Industry: IT and Telecom, Manufacturing, Energy and Utility, Banking and Financial Services, Education, Other End-user Industries – IT and Telecom leading at xx Million by 2033.
- By Network Type: Physical, Virtual, Hybrid – Hybrid networks showing the highest growth at xx Million by 2033.
Each segment’s growth is projected based on current market trends, technological advancements, and evolving customer needs. Competitive dynamics vary across segments, with some experiencing higher levels of competition than others.
Key Drivers of Network Automation Solution Industry Growth
The Network Automation Solution market's growth is driven by several factors:
- Technological Advancements: AI, ML, and SDN technologies are improving network efficiency and management.
- Increasing Network Complexity: The expansion of cloud computing and IoT necessitates automation.
- Cost Optimization: Automation reduces operational expenses and improves resource allocation.
- Enhanced Security: Network automation solutions provide enhanced security features to mitigate cyber threats.
- Improved Network Performance: Automation improves overall network performance, leading to higher business productivity and reduced downtime.
Challenges in the Network Automation Solution Industry Sector
The industry faces several challenges:
- High Initial Investment Costs: Implementing network automation solutions can require significant upfront investment.
- Integration Complexity: Integrating automation solutions with existing infrastructure can be complex and time-consuming.
- Skill Gap: A shortage of skilled professionals capable of designing, implementing, and managing these solutions presents a barrier.
- Security Concerns: Ensuring the security of automated networks is crucial, and vulnerabilities could lead to significant financial losses and reputational damage. Data breaches cost businesses an average of xx Million annually.
Emerging Opportunities in Network Automation Solution Industry
Several emerging opportunities exist:
- Edge Computing Automation: The growth of edge computing creates a demand for automated management of edge devices.
- AI-driven Network Optimization: Advancements in AI enable more intelligent and proactive network management.
- Zero Trust Security: Network automation solutions will be crucial in implementing Zero Trust security models.
- Expansion into New Verticals: The adoption of automation is expanding into new industry sectors beyond IT and Telecom.
Leading Players in the Network Automation Solution Industry Market
- AppViewX Inc
- IBM Corporation
- Nuage Networks (Nokia Corporation)
- Arista Networks Inc
- Hewlett Packard Enterprise Company
- Cisco Systems Inc
- Broadcom Inc
- Fujitsu Limited
- Juniper Networks Inc
- BMC Software Inc
- Extreme Networks Inc
- NetBrain Technologies Inc
- Forward Networks Inc
- Solarwinds Corporation
- Open Text Corporation
- Fortra LLC
Key Developments in Network Automation Solution Industry Industry
- March 2024: Arista announced CloudVision Universal Network Observability (CV UNOTM), enhancing network automation and application visibility. This launch is expected to boost Arista’s market share by xx% within the next year.
- March 2024: Nokia enhanced its WaveSuite optical network automation platform, addressing increased bandwidth and reliability needs. This upgrade is anticipated to drive a xx% increase in Nokia's revenue from the optical networking segment.
Future Outlook for Network Automation Solution Industry Market
The Network Automation Solution market is poised for significant growth, fueled by increasing network complexity, digital transformation initiatives, and technological advancements. The adoption of AI, ML, and edge computing will further drive innovation and create new opportunities. Strategic partnerships and acquisitions will continue to shape the competitive landscape. The market is expected to experience a sustained CAGR of xx%, exceeding xx Million by 2033, driven by the ongoing demand for efficient, secure, and scalable network solutions across various industry verticals.
Network Automation Solution Industry Segmentation
-
1. Network Type
- 1.1. Physical
- 1.2. Virtual
- 1.3. Hybrid
-
2. Component
-
2.1. Solution Type
- 2.1.1. Network Automation Tools
- 2.1.2. SD-WAN and Network Virtualization
- 2.1.3. Intent-based Networking
-
2.2. Service Type
- 2.2.1. Managed Service
- 2.2.2. Professional Service
-
2.1. Solution Type
-
3. Deployment
- 3.1. Cloud
- 3.2. On-premise
- 3.3. Hybrid
-
4. End-user Industry
- 4.1. IT and Telecom
- 4.2. Manufacturing
- 4.3. Energy and Utility
- 4.4. Banking and Financial Services
- 4.5. Education
- 4.6. Other End-user Industries
Network Automation Solution Industry Segmentation By Geography
- 1. North America
- 2. Europe
- 3. Asia
- 4. Australia and New Zealand
- 5. Latin America
- 6. Middle East and Africa
Network Automation Solution Industry REPORT HIGHLIGHTS
| Aspects | Details |
|---|---|
| Study Period | 2019-2033 |
| Base Year | 2024 |
| Estimated Year | 2025 |
| Forecast Period | 2025-2033 |
| Historical Period | 2019-2024 |
| Growth Rate | CAGR of 23.16% from 2019-2033 |
| Segmentation |
|
Table of Contents
- 1. Introduction
- 1.1. Research Scope
- 1.2. Market Segmentation
- 1.3. Research Methodology
- 1.4. Definitions and Assumptions
- 2. Executive Summary
- 2.1. Introduction
- 3. Market Dynamics
- 3.1. Introduction
- 3.2. Market Drivers
- 3.2.1. Increasing Demand for Data Center Network; Rising Trend of Connected Devices
- 3.3. Market Restrains
- 3.3.1. Lack of Skilled Professional Across Industries
- 3.4. Market Trends
- 3.4.1. IT and Telecom End-user Industry is Expected to Hold Significant Market Share
- 4. Market Factor Analysis
- 4.1. Porters Five Forces
- 4.2. Supply/Value Chain
- 4.3. PESTEL analysis
- 4.4. Market Entropy
- 4.5. Patent/Trademark Analysis
- 5. Global Network Automation Solution Industry Analysis, Insights and Forecast, 2019-2031
- 5.1. Market Analysis, Insights and Forecast - by Network Type
- 5.1.1. Physical
- 5.1.2. Virtual
- 5.1.3. Hybrid
- 5.2. Market Analysis, Insights and Forecast - by Component
- 5.2.1. Solution Type
- 5.2.1.1. Network Automation Tools
- 5.2.1.2. SD-WAN and Network Virtualization
- 5.2.1.3. Intent-based Networking
- 5.2.2. Service Type
- 5.2.2.1. Managed Service
- 5.2.2.2. Professional Service
- 5.2.1. Solution Type
- 5.3. Market Analysis, Insights and Forecast - by Deployment
- 5.3.1. Cloud
- 5.3.2. On-premise
- 5.3.3. Hybrid
- 5.4. Market Analysis, Insights and Forecast - by End-user Industry
- 5.4.1. IT and Telecom
- 5.4.2. Manufacturing
- 5.4.3. Energy and Utility
- 5.4.4. Banking and Financial Services
- 5.4.5. Education
- 5.4.6. Other End-user Industries
- 5.5. Market Analysis, Insights and Forecast - by Region
- 5.5.1. North America
- 5.5.2. Europe
- 5.5.3. Asia
- 5.5.4. Australia and New Zealand
- 5.5.5. Latin America
- 5.5.6. Middle East and Africa
- 5.1. Market Analysis, Insights and Forecast - by Network Type
- 6. North America Network Automation Solution Industry Analysis, Insights and Forecast, 2019-2031
- 6.1. Market Analysis, Insights and Forecast - by Network Type
- 6.1.1. Physical
- 6.1.2. Virtual
- 6.1.3. Hybrid
- 6.2. Market Analysis, Insights and Forecast - by Component
- 6.2.1. Solution Type
- 6.2.1.1. Network Automation Tools
- 6.2.1.2. SD-WAN and Network Virtualization
- 6.2.1.3. Intent-based Networking
- 6.2.2. Service Type
- 6.2.2.1. Managed Service
- 6.2.2.2. Professional Service
- 6.2.1. Solution Type
- 6.3. Market Analysis, Insights and Forecast - by Deployment
- 6.3.1. Cloud
- 6.3.2. On-premise
- 6.3.3. Hybrid
- 6.4. Market Analysis, Insights and Forecast - by End-user Industry
- 6.4.1. IT and Telecom
- 6.4.2. Manufacturing
- 6.4.3. Energy and Utility
- 6.4.4. Banking and Financial Services
- 6.4.5. Education
- 6.4.6. Other End-user Industries
- 6.1. Market Analysis, Insights and Forecast - by Network Type
- 7. Europe Network Automation Solution Industry Analysis, Insights and Forecast, 2019-2031
- 7.1. Market Analysis, Insights and Forecast - by Network Type
- 7.1.1. Physical
- 7.1.2. Virtual
- 7.1.3. Hybrid
- 7.2. Market Analysis, Insights and Forecast - by Component
- 7.2.1. Solution Type
- 7.2.1.1. Network Automation Tools
- 7.2.1.2. SD-WAN and Network Virtualization
- 7.2.1.3. Intent-based Networking
- 7.2.2. Service Type
- 7.2.2.1. Managed Service
- 7.2.2.2. Professional Service
- 7.2.1. Solution Type
- 7.3. Market Analysis, Insights and Forecast - by Deployment
- 7.3.1. Cloud
- 7.3.2. On-premise
- 7.3.3. Hybrid
- 7.4. Market Analysis, Insights and Forecast - by End-user Industry
- 7.4.1. IT and Telecom
- 7.4.2. Manufacturing
- 7.4.3. Energy and Utility
- 7.4.4. Banking and Financial Services
- 7.4.5. Education
- 7.4.6. Other End-user Industries
- 7.1. Market Analysis, Insights and Forecast - by Network Type
- 8. Asia Network Automation Solution Industry Analysis, Insights and Forecast, 2019-2031
- 8.1. Market Analysis, Insights and Forecast - by Network Type
- 8.1.1. Physical
- 8.1.2. Virtual
- 8.1.3. Hybrid
- 8.2. Market Analysis, Insights and Forecast - by Component
- 8.2.1. Solution Type
- 8.2.1.1. Network Automation Tools
- 8.2.1.2. SD-WAN and Network Virtualization
- 8.2.1.3. Intent-based Networking
- 8.2.2. Service Type
- 8.2.2.1. Managed Service
- 8.2.2.2. Professional Service
- 8.2.1. Solution Type
- 8.3. Market Analysis, Insights and Forecast - by Deployment
- 8.3.1. Cloud
- 8.3.2. On-premise
- 8.3.3. Hybrid
- 8.4. Market Analysis, Insights and Forecast - by End-user Industry
- 8.4.1. IT and Telecom
- 8.4.2. Manufacturing
- 8.4.3. Energy and Utility
- 8.4.4. Banking and Financial Services
- 8.4.5. Education
- 8.4.6. Other End-user Industries
- 8.1. Market Analysis, Insights and Forecast - by Network Type
- 9. Australia and New Zealand Network Automation Solution Industry Analysis, Insights and Forecast, 2019-2031
- 9.1. Market Analysis, Insights and Forecast - by Network Type
- 9.1.1. Physical
- 9.1.2. Virtual
- 9.1.3. Hybrid
- 9.2. Market Analysis, Insights and Forecast - by Component
- 9.2.1. Solution Type
- 9.2.1.1. Network Automation Tools
- 9.2.1.2. SD-WAN and Network Virtualization
- 9.2.1.3. Intent-based Networking
- 9.2.2. Service Type
- 9.2.2.1. Managed Service
- 9.2.2.2. Professional Service
- 9.2.1. Solution Type
- 9.3. Market Analysis, Insights and Forecast - by Deployment
- 9.3.1. Cloud
- 9.3.2. On-premise
- 9.3.3. Hybrid
- 9.4. Market Analysis, Insights and Forecast - by End-user Industry
- 9.4.1. IT and Telecom
- 9.4.2. Manufacturing
- 9.4.3. Energy and Utility
- 9.4.4. Banking and Financial Services
- 9.4.5. Education
- 9.4.6. Other End-user Industries
- 9.1. Market Analysis, Insights and Forecast - by Network Type
- 10. Latin America Network Automation Solution Industry Analysis, Insights and Forecast, 2019-2031
- 10.1. Market Analysis, Insights and Forecast - by Network Type
- 10.1.1. Physical
- 10.1.2. Virtual
- 10.1.3. Hybrid
- 10.2. Market Analysis, Insights and Forecast - by Component
- 10.2.1. Solution Type
- 10.2.1.1. Network Automation Tools
- 10.2.1.2. SD-WAN and Network Virtualization
- 10.2.1.3. Intent-based Networking
- 10.2.2. Service Type
- 10.2.2.1. Managed Service
- 10.2.2.2. Professional Service
- 10.2.1. Solution Type
- 10.3. Market Analysis, Insights and Forecast - by Deployment
- 10.3.1. Cloud
- 10.3.2. On-premise
- 10.3.3. Hybrid
- 10.4. Market Analysis, Insights and Forecast - by End-user Industry
- 10.4.1. IT and Telecom
- 10.4.2. Manufacturing
- 10.4.3. Energy and Utility
- 10.4.4. Banking and Financial Services
- 10.4.5. Education
- 10.4.6. Other End-user Industries
- 10.1. Market Analysis, Insights and Forecast - by Network Type
- 11. Middle East and Africa Network Automation Solution Industry Analysis, Insights and Forecast, 2019-2031
- 11.1. Market Analysis, Insights and Forecast - by Network Type
- 11.1.1. Physical
- 11.1.2. Virtual
- 11.1.3. Hybrid
- 11.2. Market Analysis, Insights and Forecast - by Component
- 11.2.1. Solution Type
- 11.2.1.1. Network Automation Tools
- 11.2.1.2. SD-WAN and Network Virtualization
- 11.2.1.3. Intent-based Networking
- 11.2.2. Service Type
- 11.2.2.1. Managed Service
- 11.2.2.2. Professional Service
- 11.2.1. Solution Type
- 11.3. Market Analysis, Insights and Forecast - by Deployment
- 11.3.1. Cloud
- 11.3.2. On-premise
- 11.3.3. Hybrid
- 11.4. Market Analysis, Insights and Forecast - by End-user Industry
- 11.4.1. IT and Telecom
- 11.4.2. Manufacturing
- 11.4.3. Energy and Utility
- 11.4.4. Banking and Financial Services
- 11.4.5. Education
- 11.4.6. Other End-user Industries
- 11.1. Market Analysis, Insights and Forecast - by Network Type
- 12. North America Network Automation Solution Industry Analysis, Insights and Forecast, 2019-2031
- 12.1. Market Analysis, Insights and Forecast - By Country/Sub-region
- 12.1.1 United States
- 12.1.2 Canada
- 12.1.3 Mexico
- 13. Europe Network Automation Solution Industry Analysis, Insights and Forecast, 2019-2031
- 13.1. Market Analysis, Insights and Forecast - By Country/Sub-region
- 13.1.1 Germany
- 13.1.2 United Kingdom
- 13.1.3 France
- 13.1.4 Spain
- 13.1.5 Italy
- 13.1.6 Spain
- 13.1.7 Belgium
- 13.1.8 Netherland
- 13.1.9 Nordics
- 13.1.10 Rest of Europe
- 14. Asia Pacific Network Automation Solution Industry Analysis, Insights and Forecast, 2019-2031
- 14.1. Market Analysis, Insights and Forecast - By Country/Sub-region
- 14.1.1 China
- 14.1.2 Japan
- 14.1.3 India
- 14.1.4 South Korea
- 14.1.5 Southeast Asia
- 14.1.6 Australia
- 14.1.7 Indonesia
- 14.1.8 Phillipes
- 14.1.9 Singapore
- 14.1.10 Thailandc
- 14.1.11 Rest of Asia Pacific
- 15. South America Network Automation Solution Industry Analysis, Insights and Forecast, 2019-2031
- 15.1. Market Analysis, Insights and Forecast - By Country/Sub-region
- 15.1.1 Brazil
- 15.1.2 Argentina
- 15.1.3 Peru
- 15.1.4 Chile
- 15.1.5 Colombia
- 15.1.6 Ecuador
- 15.1.7 Venezuela
- 15.1.8 Rest of South America
- 16. North America Network Automation Solution Industry Analysis, Insights and Forecast, 2019-2031
- 16.1. Market Analysis, Insights and Forecast - By Country/Sub-region
- 16.1.1 United States
- 16.1.2 Canada
- 16.1.3 Mexico
- 17. MEA Network Automation Solution Industry Analysis, Insights and Forecast, 2019-2031
- 17.1. Market Analysis, Insights and Forecast - By Country/Sub-region
- 17.1.1 United Arab Emirates
- 17.1.2 Saudi Arabia
- 17.1.3 South Africa
- 17.1.4 Rest of Middle East and Africa
- 18. Competitive Analysis
- 18.1. Global Market Share Analysis 2024
- 18.2. Company Profiles
- 18.2.1 AppViewX Inc
- 18.2.1.1. Overview
- 18.2.1.2. Products
- 18.2.1.3. SWOT Analysis
- 18.2.1.4. Recent Developments
- 18.2.1.5. Financials (Based on Availability)
- 18.2.2 IBM Corporation
- 18.2.2.1. Overview
- 18.2.2.2. Products
- 18.2.2.3. SWOT Analysis
- 18.2.2.4. Recent Developments
- 18.2.2.5. Financials (Based on Availability)
- 18.2.3 Nuage Networks (Nokia Corporation)
- 18.2.3.1. Overview
- 18.2.3.2. Products
- 18.2.3.3. SWOT Analysis
- 18.2.3.4. Recent Developments
- 18.2.3.5. Financials (Based on Availability)
- 18.2.4 Arista Networks Inc
- 18.2.4.1. Overview
- 18.2.4.2. Products
- 18.2.4.3. SWOT Analysis
- 18.2.4.4. Recent Developments
- 18.2.4.5. Financials (Based on Availability)
- 18.2.5 Hewlett Packard Enterprise Company
- 18.2.5.1. Overview
- 18.2.5.2. Products
- 18.2.5.3. SWOT Analysis
- 18.2.5.4. Recent Developments
- 18.2.5.5. Financials (Based on Availability)
- 18.2.6 Cisco Systems Inc
- 18.2.6.1. Overview
- 18.2.6.2. Products
- 18.2.6.3. SWOT Analysis
- 18.2.6.4. Recent Developments
- 18.2.6.5. Financials (Based on Availability)
- 18.2.7 Broadcom Inc
- 18.2.7.1. Overview
- 18.2.7.2. Products
- 18.2.7.3. SWOT Analysis
- 18.2.7.4. Recent Developments
- 18.2.7.5. Financials (Based on Availability)
- 18.2.8 Fujitsu Limited
- 18.2.8.1. Overview
- 18.2.8.2. Products
- 18.2.8.3. SWOT Analysis
- 18.2.8.4. Recent Developments
- 18.2.8.5. Financials (Based on Availability)
- 18.2.9 Juniper Networks Inc
- 18.2.9.1. Overview
- 18.2.9.2. Products
- 18.2.9.3. SWOT Analysis
- 18.2.9.4. Recent Developments
- 18.2.9.5. Financials (Based on Availability)
- 18.2.10 BMC Software Inc
- 18.2.10.1. Overview
- 18.2.10.2. Products
- 18.2.10.3. SWOT Analysis
- 18.2.10.4. Recent Developments
- 18.2.10.5. Financials (Based on Availability)
- 18.2.11 Extreme Networks Inc
- 18.2.11.1. Overview
- 18.2.11.2. Products
- 18.2.11.3. SWOT Analysis
- 18.2.11.4. Recent Developments
- 18.2.11.5. Financials (Based on Availability)
- 18.2.12 NetBrain Technologies Inc
- 18.2.12.1. Overview
- 18.2.12.2. Products
- 18.2.12.3. SWOT Analysis
- 18.2.12.4. Recent Developments
- 18.2.12.5. Financials (Based on Availability)
- 18.2.13 Forward Networks Inc
- 18.2.13.1. Overview
- 18.2.13.2. Products
- 18.2.13.3. SWOT Analysis
- 18.2.13.4. Recent Developments
- 18.2.13.5. Financials (Based on Availability)
- 18.2.14 Solarwinds Corporation
- 18.2.14.1. Overview
- 18.2.14.2. Products
- 18.2.14.3. SWOT Analysis
- 18.2.14.4. Recent Developments
- 18.2.14.5. Financials (Based on Availability)
- 18.2.15 Open Text Corporation
- 18.2.15.1. Overview
- 18.2.15.2. Products
- 18.2.15.3. SWOT Analysis
- 18.2.15.4. Recent Developments
- 18.2.15.5. Financials (Based on Availability)
- 18.2.16 Fortra LLC
- 18.2.16.1. Overview
- 18.2.16.2. Products
- 18.2.16.3. SWOT Analysis
- 18.2.16.4. Recent Developments
- 18.2.16.5. Financials (Based on Availability)
- 18.2.1 AppViewX Inc
List of Figures
- Figure 1: Global Network Automation Solution Industry Revenue Breakdown (Million, %) by Region 2024 & 2032
- Figure 2: North America Network Automation Solution Industry Revenue (Million), by Country 2024 & 2032
- Figure 3: North America Network Automation Solution Industry Revenue Share (%), by Country 2024 & 2032
- Figure 4: Europe Network Automation Solution Industry Revenue (Million), by Country 2024 & 2032
- Figure 5: Europe Network Automation Solution Industry Revenue Share (%), by Country 2024 & 2032
- Figure 6: Asia Pacific Network Automation Solution Industry Revenue (Million), by Country 2024 & 2032
- Figure 7: Asia Pacific Network Automation Solution Industry Revenue Share (%), by Country 2024 & 2032
- Figure 8: South America Network Automation Solution Industry Revenue (Million), by Country 2024 & 2032
- Figure 9: South America Network Automation Solution Industry Revenue Share (%), by Country 2024 & 2032
- Figure 10: North America Network Automation Solution Industry Revenue (Million), by Country 2024 & 2032
- Figure 11: North America Network Automation Solution Industry Revenue Share (%), by Country 2024 & 2032
- Figure 12: MEA Network Automation Solution Industry Revenue (Million), by Country 2024 & 2032
- Figure 13: MEA Network Automation Solution Industry Revenue Share (%), by Country 2024 & 2032
- Figure 14: North America Network Automation Solution Industry Revenue (Million), by Network Type 2024 & 2032
- Figure 15: North America Network Automation Solution Industry Revenue Share (%), by Network Type 2024 & 2032
- Figure 16: North America Network Automation Solution Industry Revenue (Million), by Component 2024 & 2032
- Figure 17: North America Network Automation Solution Industry Revenue Share (%), by Component 2024 & 2032
- Figure 18: North America Network Automation Solution Industry Revenue (Million), by Deployment 2024 & 2032
- Figure 19: North America Network Automation Solution Industry Revenue Share (%), by Deployment 2024 & 2032
- Figure 20: North America Network Automation Solution Industry Revenue (Million), by End-user Industry 2024 & 2032
- Figure 21: North America Network Automation Solution Industry Revenue Share (%), by End-user Industry 2024 & 2032
- Figure 22: North America Network Automation Solution Industry Revenue (Million), by Country 2024 & 2032
- Figure 23: North America Network Automation Solution Industry Revenue Share (%), by Country 2024 & 2032
- Figure 24: Europe Network Automation Solution Industry Revenue (Million), by Network Type 2024 & 2032
- Figure 25: Europe Network Automation Solution Industry Revenue Share (%), by Network Type 2024 & 2032
- Figure 26: Europe Network Automation Solution Industry Revenue (Million), by Component 2024 & 2032
- Figure 27: Europe Network Automation Solution Industry Revenue Share (%), by Component 2024 & 2032
- Figure 28: Europe Network Automation Solution Industry Revenue (Million), by Deployment 2024 & 2032
- Figure 29: Europe Network Automation Solution Industry Revenue Share (%), by Deployment 2024 & 2032
- Figure 30: Europe Network Automation Solution Industry Revenue (Million), by End-user Industry 2024 & 2032
- Figure 31: Europe Network Automation Solution Industry Revenue Share (%), by End-user Industry 2024 & 2032
- Figure 32: Europe Network Automation Solution Industry Revenue (Million), by Country 2024 & 2032
- Figure 33: Europe Network Automation Solution Industry Revenue Share (%), by Country 2024 & 2032
- Figure 34: Asia Network Automation Solution Industry Revenue (Million), by Network Type 2024 & 2032
- Figure 35: Asia Network Automation Solution Industry Revenue Share (%), by Network Type 2024 & 2032
- Figure 36: Asia Network Automation Solution Industry Revenue (Million), by Component 2024 & 2032
- Figure 37: Asia Network Automation Solution Industry Revenue Share (%), by Component 2024 & 2032
- Figure 38: Asia Network Automation Solution Industry Revenue (Million), by Deployment 2024 & 2032
- Figure 39: Asia Network Automation Solution Industry Revenue Share (%), by Deployment 2024 & 2032
- Figure 40: Asia Network Automation Solution Industry Revenue (Million), by End-user Industry 2024 & 2032
- Figure 41: Asia Network Automation Solution Industry Revenue Share (%), by End-user Industry 2024 & 2032
- Figure 42: Asia Network Automation Solution Industry Revenue (Million), by Country 2024 & 2032
- Figure 43: Asia Network Automation Solution Industry Revenue Share (%), by Country 2024 & 2032
- Figure 44: Australia and New Zealand Network Automation Solution Industry Revenue (Million), by Network Type 2024 & 2032
- Figure 45: Australia and New Zealand Network Automation Solution Industry Revenue Share (%), by Network Type 2024 & 2032
- Figure 46: Australia and New Zealand Network Automation Solution Industry Revenue (Million), by Component 2024 & 2032
- Figure 47: Australia and New Zealand Network Automation Solution Industry Revenue Share (%), by Component 2024 & 2032
- Figure 48: Australia and New Zealand Network Automation Solution Industry Revenue (Million), by Deployment 2024 & 2032
- Figure 49: Australia and New Zealand Network Automation Solution Industry Revenue Share (%), by Deployment 2024 & 2032
- Figure 50: Australia and New Zealand Network Automation Solution Industry Revenue (Million), by End-user Industry 2024 & 2032
- Figure 51: Australia and New Zealand Network Automation Solution Industry Revenue Share (%), by End-user Industry 2024 & 2032
- Figure 52: Australia and New Zealand Network Automation Solution Industry Revenue (Million), by Country 2024 & 2032
- Figure 53: Australia and New Zealand Network Automation Solution Industry Revenue Share (%), by Country 2024 & 2032
- Figure 54: Latin America Network Automation Solution Industry Revenue (Million), by Network Type 2024 & 2032
- Figure 55: Latin America Network Automation Solution Industry Revenue Share (%), by Network Type 2024 & 2032
- Figure 56: Latin America Network Automation Solution Industry Revenue (Million), by Component 2024 & 2032
- Figure 57: Latin America Network Automation Solution Industry Revenue Share (%), by Component 2024 & 2032
- Figure 58: Latin America Network Automation Solution Industry Revenue (Million), by Deployment 2024 & 2032
- Figure 59: Latin America Network Automation Solution Industry Revenue Share (%), by Deployment 2024 & 2032
- Figure 60: Latin America Network Automation Solution Industry Revenue (Million), by End-user Industry 2024 & 2032
- Figure 61: Latin America Network Automation Solution Industry Revenue Share (%), by End-user Industry 2024 & 2032
- Figure 62: Latin America Network Automation Solution Industry Revenue (Million), by Country 2024 & 2032
- Figure 63: Latin America Network Automation Solution Industry Revenue Share (%), by Country 2024 & 2032
- Figure 64: Middle East and Africa Network Automation Solution Industry Revenue (Million), by Network Type 2024 & 2032
- Figure 65: Middle East and Africa Network Automation Solution Industry Revenue Share (%), by Network Type 2024 & 2032
- Figure 66: Middle East and Africa Network Automation Solution Industry Revenue (Million), by Component 2024 & 2032
- Figure 67: Middle East and Africa Network Automation Solution Industry Revenue Share (%), by Component 2024 & 2032
- Figure 68: Middle East and Africa Network Automation Solution Industry Revenue (Million), by Deployment 2024 & 2032
- Figure 69: Middle East and Africa Network Automation Solution Industry Revenue Share (%), by Deployment 2024 & 2032
- Figure 70: Middle East and Africa Network Automation Solution Industry Revenue (Million), by End-user Industry 2024 & 2032
- Figure 71: Middle East and Africa Network Automation Solution Industry Revenue Share (%), by End-user Industry 2024 & 2032
- Figure 72: Middle East and Africa Network Automation Solution Industry Revenue (Million), by Country 2024 & 2032
- Figure 73: Middle East and Africa Network Automation Solution Industry Revenue Share (%), by Country 2024 & 2032
List of Tables
- Table 1: Global Network Automation Solution Industry Revenue Million Forecast, by Region 2019 & 2032
- Table 2: Global Network Automation Solution Industry Revenue Million Forecast, by Network Type 2019 & 2032
- Table 3: Global Network Automation Solution Industry Revenue Million Forecast, by Component 2019 & 2032
- Table 4: Global Network Automation Solution Industry Revenue Million Forecast, by Deployment 2019 & 2032
- Table 5: Global Network Automation Solution Industry Revenue Million Forecast, by End-user Industry 2019 & 2032
- Table 6: Global Network Automation Solution Industry Revenue Million Forecast, by Region 2019 & 2032
- Table 7: Global Network Automation Solution Industry Revenue Million Forecast, by Country 2019 & 2032
- Table 8: United States Network Automation Solution Industry Revenue (Million) Forecast, by Application 2019 & 2032
- Table 9: Canada Network Automation Solution Industry Revenue (Million) Forecast, by Application 2019 & 2032
- Table 10: Mexico Network Automation Solution Industry Revenue (Million) Forecast, by Application 2019 & 2032
- Table 11: Global Network Automation Solution Industry Revenue Million Forecast, by Country 2019 & 2032
- Table 12: Germany Network Automation Solution Industry Revenue (Million) Forecast, by Application 2019 & 2032
- Table 13: United Kingdom Network Automation Solution Industry Revenue (Million) Forecast, by Application 2019 & 2032
- Table 14: France Network Automation Solution Industry Revenue (Million) Forecast, by Application 2019 & 2032
- Table 15: Spain Network Automation Solution Industry Revenue (Million) Forecast, by Application 2019 & 2032
- Table 16: Italy Network Automation Solution Industry Revenue (Million) Forecast, by Application 2019 & 2032
- Table 17: Spain Network Automation Solution Industry Revenue (Million) Forecast, by Application 2019 & 2032
- Table 18: Belgium Network Automation Solution Industry Revenue (Million) Forecast, by Application 2019 & 2032
- Table 19: Netherland Network Automation Solution Industry Revenue (Million) Forecast, by Application 2019 & 2032
- Table 20: Nordics Network Automation Solution Industry Revenue (Million) Forecast, by Application 2019 & 2032
- Table 21: Rest of Europe Network Automation Solution Industry Revenue (Million) Forecast, by Application 2019 & 2032
- Table 22: Global Network Automation Solution Industry Revenue Million Forecast, by Country 2019 & 2032
- Table 23: China Network Automation Solution Industry Revenue (Million) Forecast, by Application 2019 & 2032
- Table 24: Japan Network Automation Solution Industry Revenue (Million) Forecast, by Application 2019 & 2032
- Table 25: India Network Automation Solution Industry Revenue (Million) Forecast, by Application 2019 & 2032
- Table 26: South Korea Network Automation Solution Industry Revenue (Million) Forecast, by Application 2019 & 2032
- Table 27: Southeast Asia Network Automation Solution Industry Revenue (Million) Forecast, by Application 2019 & 2032
- Table 28: Australia Network Automation Solution Industry Revenue (Million) Forecast, by Application 2019 & 2032
- Table 29: Indonesia Network Automation Solution Industry Revenue (Million) Forecast, by Application 2019 & 2032
- Table 30: Phillipes Network Automation Solution Industry Revenue (Million) Forecast, by Application 2019 & 2032
- Table 31: Singapore Network Automation Solution Industry Revenue (Million) Forecast, by Application 2019 & 2032
- Table 32: Thailandc Network Automation Solution Industry Revenue (Million) Forecast, by Application 2019 & 2032
- Table 33: Rest of Asia Pacific Network Automation Solution Industry Revenue (Million) Forecast, by Application 2019 & 2032
- Table 34: Global Network Automation Solution Industry Revenue Million Forecast, by Country 2019 & 2032
- Table 35: Brazil Network Automation Solution Industry Revenue (Million) Forecast, by Application 2019 & 2032
- Table 36: Argentina Network Automation Solution Industry Revenue (Million) Forecast, by Application 2019 & 2032
- Table 37: Peru Network Automation Solution Industry Revenue (Million) Forecast, by Application 2019 & 2032
- Table 38: Chile Network Automation Solution Industry Revenue (Million) Forecast, by Application 2019 & 2032
- Table 39: Colombia Network Automation Solution Industry Revenue (Million) Forecast, by Application 2019 & 2032
- Table 40: Ecuador Network Automation Solution Industry Revenue (Million) Forecast, by Application 2019 & 2032
- Table 41: Venezuela Network Automation Solution Industry Revenue (Million) Forecast, by Application 2019 & 2032
- Table 42: Rest of South America Network Automation Solution Industry Revenue (Million) Forecast, by Application 2019 & 2032
- Table 43: Global Network Automation Solution Industry Revenue Million Forecast, by Country 2019 & 2032
- Table 44: United States Network Automation Solution Industry Revenue (Million) Forecast, by Application 2019 & 2032
- Table 45: Canada Network Automation Solution Industry Revenue (Million) Forecast, by Application 2019 & 2032
- Table 46: Mexico Network Automation Solution Industry Revenue (Million) Forecast, by Application 2019 & 2032
- Table 47: Global Network Automation Solution Industry Revenue Million Forecast, by Country 2019 & 2032
- Table 48: United Arab Emirates Network Automation Solution Industry Revenue (Million) Forecast, by Application 2019 & 2032
- Table 49: Saudi Arabia Network Automation Solution Industry Revenue (Million) Forecast, by Application 2019 & 2032
- Table 50: South Africa Network Automation Solution Industry Revenue (Million) Forecast, by Application 2019 & 2032
- Table 51: Rest of Middle East and Africa Network Automation Solution Industry Revenue (Million) Forecast, by Application 2019 & 2032
- Table 52: Global Network Automation Solution Industry Revenue Million Forecast, by Network Type 2019 & 2032
- Table 53: Global Network Automation Solution Industry Revenue Million Forecast, by Component 2019 & 2032
- Table 54: Global Network Automation Solution Industry Revenue Million Forecast, by Deployment 2019 & 2032
- Table 55: Global Network Automation Solution Industry Revenue Million Forecast, by End-user Industry 2019 & 2032
- Table 56: Global Network Automation Solution Industry Revenue Million Forecast, by Country 2019 & 2032
- Table 57: Global Network Automation Solution Industry Revenue Million Forecast, by Network Type 2019 & 2032
- Table 58: Global Network Automation Solution Industry Revenue Million Forecast, by Component 2019 & 2032
- Table 59: Global Network Automation Solution Industry Revenue Million Forecast, by Deployment 2019 & 2032
- Table 60: Global Network Automation Solution Industry Revenue Million Forecast, by End-user Industry 2019 & 2032
- Table 61: Global Network Automation Solution Industry Revenue Million Forecast, by Country 2019 & 2032
- Table 62: Global Network Automation Solution Industry Revenue Million Forecast, by Network Type 2019 & 2032
- Table 63: Global Network Automation Solution Industry Revenue Million Forecast, by Component 2019 & 2032
- Table 64: Global Network Automation Solution Industry Revenue Million Forecast, by Deployment 2019 & 2032
- Table 65: Global Network Automation Solution Industry Revenue Million Forecast, by End-user Industry 2019 & 2032
- Table 66: Global Network Automation Solution Industry Revenue Million Forecast, by Country 2019 & 2032
- Table 67: Global Network Automation Solution Industry Revenue Million Forecast, by Network Type 2019 & 2032
- Table 68: Global Network Automation Solution Industry Revenue Million Forecast, by Component 2019 & 2032
- Table 69: Global Network Automation Solution Industry Revenue Million Forecast, by Deployment 2019 & 2032
- Table 70: Global Network Automation Solution Industry Revenue Million Forecast, by End-user Industry 2019 & 2032
- Table 71: Global Network Automation Solution Industry Revenue Million Forecast, by Country 2019 & 2032
- Table 72: Global Network Automation Solution Industry Revenue Million Forecast, by Network Type 2019 & 2032
- Table 73: Global Network Automation Solution Industry Revenue Million Forecast, by Component 2019 & 2032
- Table 74: Global Network Automation Solution Industry Revenue Million Forecast, by Deployment 2019 & 2032
- Table 75: Global Network Automation Solution Industry Revenue Million Forecast, by End-user Industry 2019 & 2032
- Table 76: Global Network Automation Solution Industry Revenue Million Forecast, by Country 2019 & 2032
- Table 77: Global Network Automation Solution Industry Revenue Million Forecast, by Network Type 2019 & 2032
- Table 78: Global Network Automation Solution Industry Revenue Million Forecast, by Component 2019 & 2032
- Table 79: Global Network Automation Solution Industry Revenue Million Forecast, by Deployment 2019 & 2032
- Table 80: Global Network Automation Solution Industry Revenue Million Forecast, by End-user Industry 2019 & 2032
- Table 81: Global Network Automation Solution Industry Revenue Million Forecast, by Country 2019 & 2032
Frequently Asked Questions
1. What is the projected Compound Annual Growth Rate (CAGR) of the Network Automation Solution Industry?
The projected CAGR is approximately 23.16%.
2. Which companies are prominent players in the Network Automation Solution Industry?
Key companies in the market include AppViewX Inc, IBM Corporation, Nuage Networks (Nokia Corporation), Arista Networks Inc, Hewlett Packard Enterprise Company, Cisco Systems Inc, Broadcom Inc, Fujitsu Limited, Juniper Networks Inc, BMC Software Inc, Extreme Networks Inc, NetBrain Technologies Inc, Forward Networks Inc, Solarwinds Corporation, Open Text Corporation, Fortra LLC.
3. What are the main segments of the Network Automation Solution Industry?
The market segments include Network Type, Component, Deployment, End-user Industry.
4. Can you provide details about the market size?
The market size is estimated to be USD 25.16 Million as of 2022.
5. What are some drivers contributing to market growth?
Increasing Demand for Data Center Network; Rising Trend of Connected Devices.
6. What are the notable trends driving market growth?
IT and Telecom End-user Industry is Expected to Hold Significant Market Share.
7. Are there any restraints impacting market growth?
Lack of Skilled Professional Across Industries.
8. Can you provide examples of recent developments in the market?
March 2024: Arista announced a new network observability software. This offering integrates data from network infrastructure performance with insights from compute and server systems to provide comprehensive insights into application and workload performance across data centers, campuses, and wide-area networks. Arista’s CloudVision Universal Network ObservabilityTM (CV UNOTM) system, available as a premium feature on Arista CloudVision, facilitates network automation, systems, and application visibility.
9. What pricing options are available for accessing the report?
Pricing options include single-user, multi-user, and enterprise licenses priced at USD 4750, USD 5250, and USD 8750 respectively.
10. Is the market size provided in terms of value or volume?
The market size is provided in terms of value, measured in Million.
11. Are there any specific market keywords associated with the report?
Yes, the market keyword associated with the report is "Network Automation Solution Industry," which aids in identifying and referencing the specific market segment covered.
12. How do I determine which pricing option suits my needs best?
The pricing options vary based on user requirements and access needs. Individual users may opt for single-user licenses, while businesses requiring broader access may choose multi-user or enterprise licenses for cost-effective access to the report.
13. Are there any additional resources or data provided in the Network Automation Solution Industry report?
While the report offers comprehensive insights, it's advisable to review the specific contents or supplementary materials provided to ascertain if additional resources or data are available.
14. How can I stay updated on further developments or reports in the Network Automation Solution Industry?
To stay informed about further developments, trends, and reports in the Network Automation Solution Industry, consider subscribing to industry newsletters, following relevant companies and organizations, or regularly checking reputable industry news sources and publications.
Methodology
Step 1 - Identification of Relevant Samples Size from Population Database


Step 2 - Approaches for Defining Global Market Size (Value, Volume* & Price*)

Note*: In applicable scenarios
Step 3 - Data Sources
Primary Research
- Web Analytics
- Survey Reports
- Research Institute
- Latest Research Reports
- Opinion Leaders
Secondary Research
- Annual Reports
- White Paper
- Latest Press Release
- Industry Association
- Paid Database
- Investor Presentations

Step 4 - Data Triangulation
Involves using different sources of information in order to increase the validity of a study
These sources are likely to be stakeholders in a program - participants, other researchers, program staff, other community members, and so on.
Then we put all data in single framework & apply various statistical tools to find out the dynamic on the market.
During the analysis stage, feedback from the stakeholder groups would be compared to determine areas of agreement as well as areas of divergence


