
Key Insights
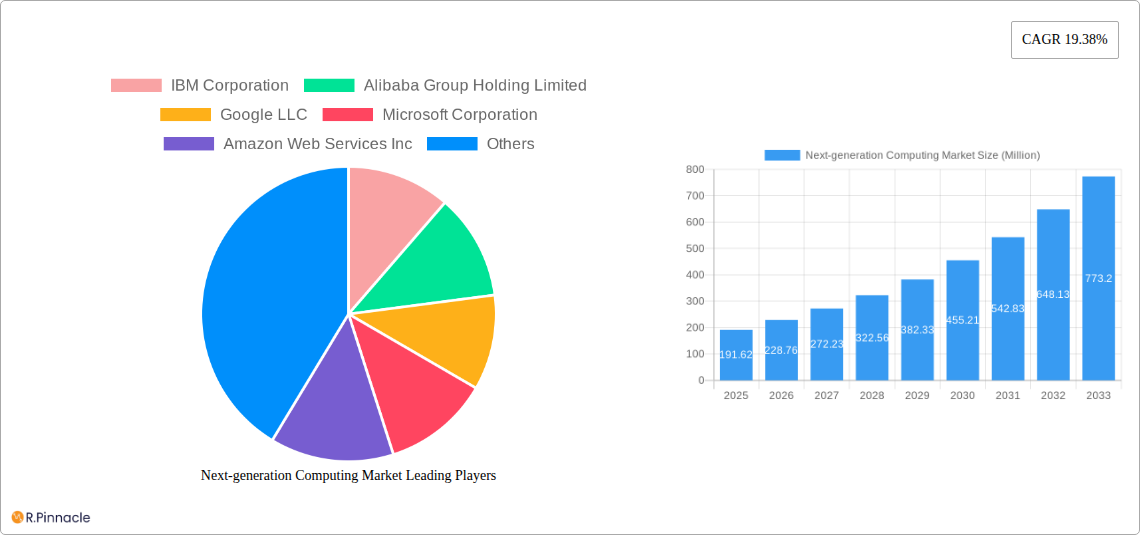
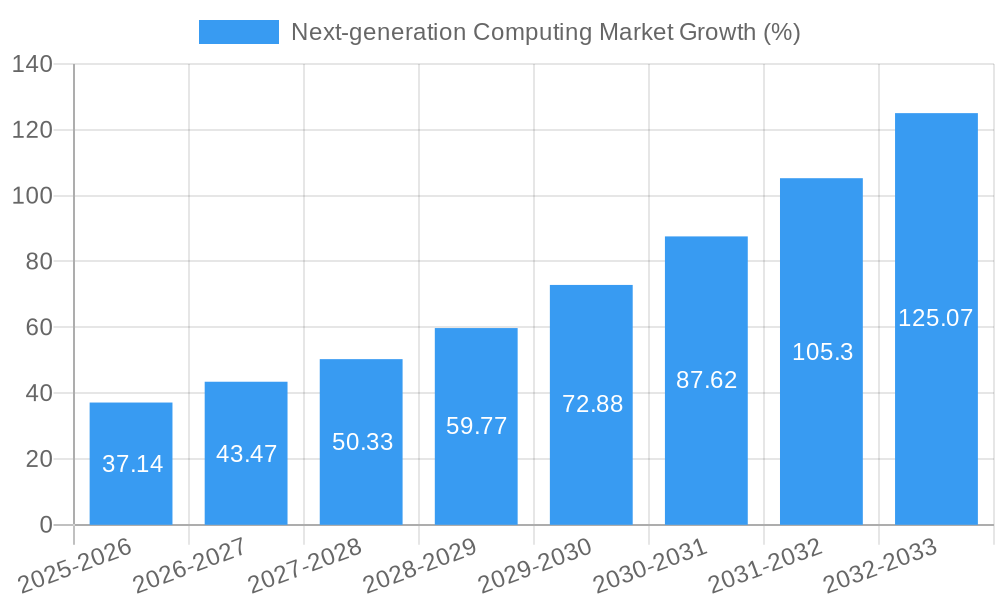
The next-generation computing market, valued at $191.62 million in 2025, is projected to experience robust growth, driven by a Compound Annual Growth Rate (CAGR) of 19.38% from 2025 to 2033. This expansion is fueled by several key factors. The increasing demand for high-performance computing (HPC) in sectors like automotive, energy, and healthcare, is a significant driver. Advancements in quantum computing and optical computing technologies, while still nascent, are creating considerable excitement and investment, promising breakthroughs in areas like drug discovery and materials science. The rise of edge computing, enabling faster processing closer to data sources, is another major catalyst. Businesses are increasingly adopting cloud-based deployment models for enhanced scalability and cost-effectiveness, further propelling market growth. While challenges such as high initial investment costs for advanced technologies and a shortage of skilled professionals exist, the overall market trajectory remains highly positive.
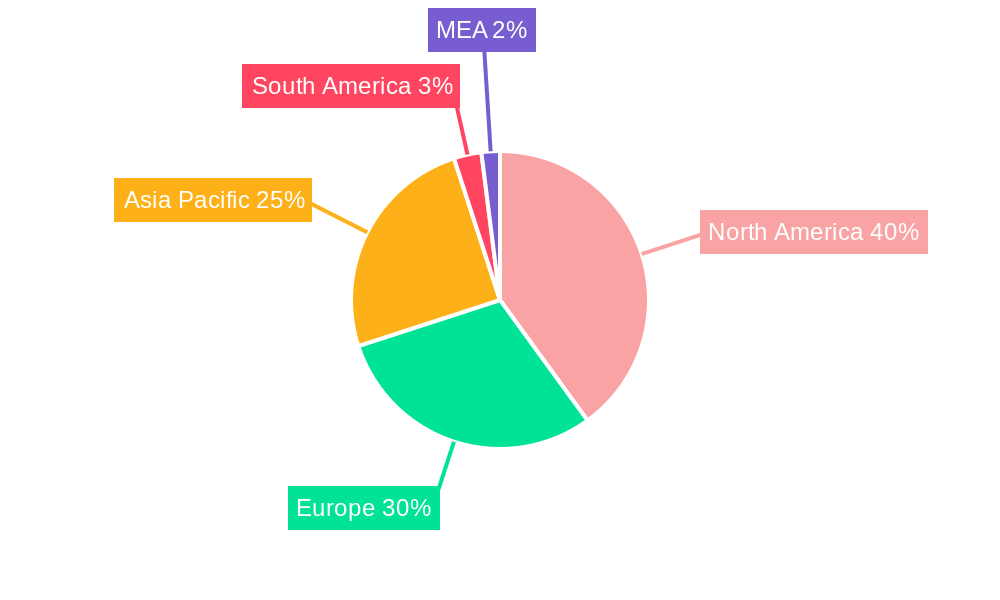
The market segmentation reveals diverse opportunities. High-performance computing currently dominates, followed by a rapidly growing edge computing segment. Cloud deployment is preferred for its flexibility, while on-premise deployments remain relevant in sectors prioritizing data security. Significant regional variations exist, with North America and Asia Pacific leading in market share, fueled by technological advancements and robust adoption rates. Key players like IBM, Google, and Amazon are actively investing in R&D and strategic partnerships to consolidate their positions and capitalize on emerging technologies. The competitive landscape is dynamic, with established tech giants and innovative startups vying for market share. The forecast indicates sustained growth throughout the forecast period (2025-2033), with the market likely exceeding $1 billion by the end of the decade, making it an attractive sector for investment and innovation.
Next-Generation Computing Market Report: 2019-2033
This comprehensive report provides a detailed analysis of the Next-Generation Computing Market, offering invaluable insights for industry professionals, investors, and strategists. Covering the period from 2019 to 2033, with a focus on 2025, this report analyzes market dynamics, key players, and future growth potential. The market is segmented by component (hardware, software, services), computing type (high-performance, quantum, optical, edge, others), deployment (cloud, on-premise), and end-user (automotive, energy, healthcare, BFSI, aerospace, media, IT, retail, manufacturing, others). The report projects a market value exceeding xx Million by 2033, driven by significant technological advancements and increasing adoption across diverse sectors.
Next-generation Computing Market Structure & Innovation Trends
The next-generation computing market is characterized by a moderately concentrated landscape, with key players such as IBM Corporation, Alibaba Group Holding Limited, Google LLC, Microsoft Corporation, and Amazon Web Services Inc holding significant market share. Market share data for 2025 estimates IBM at approximately 15%, Microsoft at 12%, and Google at 10%, with the remaining share distributed among other players and emerging companies. The market exhibits substantial innovation, driven by advancements in quantum computing, AI, and edge technologies. Regulatory frameworks, particularly concerning data privacy and cybersecurity, significantly influence market growth. While no direct substitutes exist for next-generation computing technologies, legacy systems present competitive pressures. Mergers and acquisitions (M&A) play a crucial role in shaping the market landscape. Significant M&A activity in the period 2019-2024 totaled an estimated xx Million, with a noticeable increase in activity in 2023, reflecting the strategic importance of next-generation computing capabilities.
- Market Concentration: Moderately concentrated with a few dominant players.
- Innovation Drivers: Quantum computing, AI, edge technologies.
- Regulatory Frameworks: Data privacy and cybersecurity regulations are key.
- Product Substitutes: Limited direct substitutes; legacy systems pose competition.
- End-User Demographics: Diverse, spanning various industries.
- M&A Activity: Significant activity with an estimated xx Million in deals (2019-2024).
Next-generation Computing Market Dynamics & Trends
The next-generation computing market is experiencing robust growth, projected to achieve a Compound Annual Growth Rate (CAGR) of xx% from 2025 to 2033. This growth is propelled by several key factors. The increasing demand for high-performance computing in sectors like AI and machine learning fuels market expansion. Technological disruptions, such as the advancements in quantum computing and the rise of edge computing, are reshaping the market landscape. Consumer preference for faster, more efficient computing solutions, coupled with heightened security concerns, is driving adoption. Competitive dynamics are intense, with established players and emerging startups vying for market share through innovation and strategic partnerships. Market penetration is steadily increasing, with cloud deployment models gaining significant traction.
Dominant Regions & Segments in Next-generation Computing Market
North America currently holds the dominant position in the next-generation computing market, followed by Europe and Asia-Pacific.
- Key Drivers for North America: Strong presence of major technology companies, robust R&D investments, advanced infrastructure.
- Key Drivers for Europe: Growing adoption in various industries, government initiatives promoting technological advancement.
- Key Drivers for Asia-Pacific: Rapid economic growth, increasing government support for digital transformation.
Segment Dominance:
- By Component: Hardware currently holds the largest market share, driven by the demand for high-performance computing systems. However, the software and services segments are experiencing faster growth.
- By Computing Type: High-Performance Computing dominates due to its widespread applications. Quantum computing is emerging as a high-growth segment, although still in its nascent stage.
- By Deployment: Cloud deployment is rapidly gaining traction due to its scalability and cost-effectiveness.
- By End-user: The IT & Telecom sector shows strong adoption, followed by the BFSI and Automotive & Transportation sectors.
Next-generation Computing Market Product Innovations
Recent years have witnessed significant product innovations in next-generation computing, including advancements in AI-powered chips, enhanced cloud platforms for high-performance computing, and the development of more energy-efficient hardware. These innovations are leading to improved processing speeds, enhanced data analytics capabilities, and more robust security measures. This aligns well with the growing demand for sophisticated computing solutions across diverse industries. The market is witnessing a strong focus on developing integrated solutions that seamlessly combine hardware, software, and services.
Report Scope & Segmentation Analysis
This report provides a detailed analysis of the next-generation computing market across various segments:
- By Component: Hardware (xx Million in 2025, xx% CAGR), Software (xx Million in 2025, xx% CAGR), Services (xx Million in 2025, xx% CAGR).
- By Computing Type: High-Performance Computing (xx Million in 2025, xx% CAGR), Quantum Computing (xx Million in 2025, xx% CAGR), Optical Computing (xx Million in 2025, xx% CAGR), Edge Computing (xx Million in 2025, xx% CAGR), Other Computing Types (xx Million in 2025, xx% CAGR).
- By Deployment: Cloud (xx Million in 2025, xx% CAGR), On-Premise (xx Million in 2025, xx% CAGR).
- By End-user: Each end-user segment exhibits varying growth rates based on industry-specific adoption rates and technological requirements.
Key Drivers of Next-generation Computing Market Growth
The next-generation computing market is fueled by several key growth drivers: the increasing demand for advanced computing power in AI and machine learning applications, the need for enhanced data processing and analytics across industries, the rising adoption of cloud-based computing solutions, and ongoing technological advancements, particularly in quantum computing and edge computing. Government initiatives promoting digital transformation also play a crucial role.
Challenges in the Next-generation Computing Market Sector
Challenges include the high cost of next-generation computing technologies, the complexity of implementation and integration, the shortage of skilled professionals, the potential for security vulnerabilities, and the ongoing evolution of technological standards. These factors can impact market growth and adoption rates. Supply chain disruptions can also affect availability and costs.
Emerging Opportunities in Next-generation Computing Market
The market presents significant opportunities in emerging technologies such as quantum computing, neuromorphic computing, and specialized AI accelerators. The expansion into new verticals, such as personalized medicine, smart cities, and autonomous vehicles, creates further growth potential.
Leading Players in the Next-generation Computing Market Market
- IBM Corporation
- Alibaba Group Holding Limited
- Google LLC
- Microsoft Corporation
- Amazon Web Services Inc
- NVIDIA Corp
- NEC Corporation
- Oracle Corporation
- Cisco Systems
- Intel Corporation
Key Developments in Next-generation Computing Market Industry
- July 2023: Moody's and Microsoft partnered to create next-generation data and analytics solutions for financial services using Microsoft Azure. This collaboration is expected to significantly impact the BFSI segment by enhancing risk assessment and corporate intelligence.
- September 2022: General Atomics and 3rdiTech partnered to develop next-gen integrated circuits and semiconductor technologies, potentially accelerating innovation in the hardware segment and benefiting various end-user industries.
Future Outlook for Next-generation Computing Market Market
The next-generation computing market is poised for significant growth, driven by technological advancements, increasing digitalization across industries, and the rising demand for high-performance computing solutions. Strategic partnerships, investments in R&D, and the emergence of new technologies will continue to shape the market landscape, presenting lucrative opportunities for players in the industry.
Next-generation Computing Market Segmentation
-
1. Component
- 1.1. Hardware
- 1.2. Software
- 1.3. Services
-
2. Computing Type
- 2.1. High-Performance Computing
- 2.2. Quantum Computing
- 2.3. Optical Computing
- 2.4. Edge Computing
- 2.5. Other Computing Types
-
3. Deployement
- 3.1. Cloud
- 3.2. On-Premise
-
4. End-user
- 4.1. Automotive & Transportation
- 4.2. Energy & Utilities
- 4.3. Healthcare
- 4.4. BFSI
- 4.5. Aerospace & Defense
- 4.6. Media & Entertainment
- 4.7. IT & Telecom
- 4.8. Retail
- 4.9. Manufacturing
- 4.10. Other End Users
Next-generation Computing Market Segmentation By Geography
- 1. North America
- 2. Europe
- 3. Asia
- 4. Australia and New Zealand
- 5. Latin America
- 6. Middle East and Africa
Next-generation Computing Market REPORT HIGHLIGHTS
| Aspects | Details |
|---|---|
| Study Period | 2019-2033 |
| Base Year | 2024 |
| Estimated Year | 2025 |
| Forecast Period | 2025-2033 |
| Historical Period | 2019-2024 |
| Growth Rate | CAGR of 19.38% from 2019-2033 |
| Segmentation |
|
Table of Contents
- 1. Introduction
- 1.1. Research Scope
- 1.2. Market Segmentation
- 1.3. Research Methodology
- 1.4. Definitions and Assumptions
- 2. Executive Summary
- 2.1. Introduction
- 3. Market Dynamics
- 3.1. Introduction
- 3.2. Market Drivers
- 3.2.1. Growth in demand for high performance computing; Adoption of Advanced Analytics in SMEs
- 3.3. Market Restrains
- 3.3.1. Risk of Data Breach in Storing and Processing Large Data in Next-gen Computing; High operational challenges in Implementing the Solution
- 3.4. Market Trends
- 3.4.1. The Cloud Deployment of The Solutions Significantly Contributes to The Market Growth
- 4. Market Factor Analysis
- 4.1. Porters Five Forces
- 4.2. Supply/Value Chain
- 4.3. PESTEL analysis
- 4.4. Market Entropy
- 4.5. Patent/Trademark Analysis
- 5. Global Next-generation Computing Market Analysis, Insights and Forecast, 2019-2031
- 5.1. Market Analysis, Insights and Forecast - by Component
- 5.1.1. Hardware
- 5.1.2. Software
- 5.1.3. Services
- 5.2. Market Analysis, Insights and Forecast - by Computing Type
- 5.2.1. High-Performance Computing
- 5.2.2. Quantum Computing
- 5.2.3. Optical Computing
- 5.2.4. Edge Computing
- 5.2.5. Other Computing Types
- 5.3. Market Analysis, Insights and Forecast - by Deployement
- 5.3.1. Cloud
- 5.3.2. On-Premise
- 5.4. Market Analysis, Insights and Forecast - by End-user
- 5.4.1. Automotive & Transportation
- 5.4.2. Energy & Utilities
- 5.4.3. Healthcare
- 5.4.4. BFSI
- 5.4.5. Aerospace & Defense
- 5.4.6. Media & Entertainment
- 5.4.7. IT & Telecom
- 5.4.8. Retail
- 5.4.9. Manufacturing
- 5.4.10. Other End Users
- 5.5. Market Analysis, Insights and Forecast - by Region
- 5.5.1. North America
- 5.5.2. Europe
- 5.5.3. Asia
- 5.5.4. Australia and New Zealand
- 5.5.5. Latin America
- 5.5.6. Middle East and Africa
- 5.1. Market Analysis, Insights and Forecast - by Component
- 6. North America Next-generation Computing Market Analysis, Insights and Forecast, 2019-2031
- 6.1. Market Analysis, Insights and Forecast - by Component
- 6.1.1. Hardware
- 6.1.2. Software
- 6.1.3. Services
- 6.2. Market Analysis, Insights and Forecast - by Computing Type
- 6.2.1. High-Performance Computing
- 6.2.2. Quantum Computing
- 6.2.3. Optical Computing
- 6.2.4. Edge Computing
- 6.2.5. Other Computing Types
- 6.3. Market Analysis, Insights and Forecast - by Deployement
- 6.3.1. Cloud
- 6.3.2. On-Premise
- 6.4. Market Analysis, Insights and Forecast - by End-user
- 6.4.1. Automotive & Transportation
- 6.4.2. Energy & Utilities
- 6.4.3. Healthcare
- 6.4.4. BFSI
- 6.4.5. Aerospace & Defense
- 6.4.6. Media & Entertainment
- 6.4.7. IT & Telecom
- 6.4.8. Retail
- 6.4.9. Manufacturing
- 6.4.10. Other End Users
- 6.1. Market Analysis, Insights and Forecast - by Component
- 7. Europe Next-generation Computing Market Analysis, Insights and Forecast, 2019-2031
- 7.1. Market Analysis, Insights and Forecast - by Component
- 7.1.1. Hardware
- 7.1.2. Software
- 7.1.3. Services
- 7.2. Market Analysis, Insights and Forecast - by Computing Type
- 7.2.1. High-Performance Computing
- 7.2.2. Quantum Computing
- 7.2.3. Optical Computing
- 7.2.4. Edge Computing
- 7.2.5. Other Computing Types
- 7.3. Market Analysis, Insights and Forecast - by Deployement
- 7.3.1. Cloud
- 7.3.2. On-Premise
- 7.4. Market Analysis, Insights and Forecast - by End-user
- 7.4.1. Automotive & Transportation
- 7.4.2. Energy & Utilities
- 7.4.3. Healthcare
- 7.4.4. BFSI
- 7.4.5. Aerospace & Defense
- 7.4.6. Media & Entertainment
- 7.4.7. IT & Telecom
- 7.4.8. Retail
- 7.4.9. Manufacturing
- 7.4.10. Other End Users
- 7.1. Market Analysis, Insights and Forecast - by Component
- 8. Asia Next-generation Computing Market Analysis, Insights and Forecast, 2019-2031
- 8.1. Market Analysis, Insights and Forecast - by Component
- 8.1.1. Hardware
- 8.1.2. Software
- 8.1.3. Services
- 8.2. Market Analysis, Insights and Forecast - by Computing Type
- 8.2.1. High-Performance Computing
- 8.2.2. Quantum Computing
- 8.2.3. Optical Computing
- 8.2.4. Edge Computing
- 8.2.5. Other Computing Types
- 8.3. Market Analysis, Insights and Forecast - by Deployement
- 8.3.1. Cloud
- 8.3.2. On-Premise
- 8.4. Market Analysis, Insights and Forecast - by End-user
- 8.4.1. Automotive & Transportation
- 8.4.2. Energy & Utilities
- 8.4.3. Healthcare
- 8.4.4. BFSI
- 8.4.5. Aerospace & Defense
- 8.4.6. Media & Entertainment
- 8.4.7. IT & Telecom
- 8.4.8. Retail
- 8.4.9. Manufacturing
- 8.4.10. Other End Users
- 8.1. Market Analysis, Insights and Forecast - by Component
- 9. Australia and New Zealand Next-generation Computing Market Analysis, Insights and Forecast, 2019-2031
- 9.1. Market Analysis, Insights and Forecast - by Component
- 9.1.1. Hardware
- 9.1.2. Software
- 9.1.3. Services
- 9.2. Market Analysis, Insights and Forecast - by Computing Type
- 9.2.1. High-Performance Computing
- 9.2.2. Quantum Computing
- 9.2.3. Optical Computing
- 9.2.4. Edge Computing
- 9.2.5. Other Computing Types
- 9.3. Market Analysis, Insights and Forecast - by Deployement
- 9.3.1. Cloud
- 9.3.2. On-Premise
- 9.4. Market Analysis, Insights and Forecast - by End-user
- 9.4.1. Automotive & Transportation
- 9.4.2. Energy & Utilities
- 9.4.3. Healthcare
- 9.4.4. BFSI
- 9.4.5. Aerospace & Defense
- 9.4.6. Media & Entertainment
- 9.4.7. IT & Telecom
- 9.4.8. Retail
- 9.4.9. Manufacturing
- 9.4.10. Other End Users
- 9.1. Market Analysis, Insights and Forecast - by Component
- 10. Latin America Next-generation Computing Market Analysis, Insights and Forecast, 2019-2031
- 10.1. Market Analysis, Insights and Forecast - by Component
- 10.1.1. Hardware
- 10.1.2. Software
- 10.1.3. Services
- 10.2. Market Analysis, Insights and Forecast - by Computing Type
- 10.2.1. High-Performance Computing
- 10.2.2. Quantum Computing
- 10.2.3. Optical Computing
- 10.2.4. Edge Computing
- 10.2.5. Other Computing Types
- 10.3. Market Analysis, Insights and Forecast - by Deployement
- 10.3.1. Cloud
- 10.3.2. On-Premise
- 10.4. Market Analysis, Insights and Forecast - by End-user
- 10.4.1. Automotive & Transportation
- 10.4.2. Energy & Utilities
- 10.4.3. Healthcare
- 10.4.4. BFSI
- 10.4.5. Aerospace & Defense
- 10.4.6. Media & Entertainment
- 10.4.7. IT & Telecom
- 10.4.8. Retail
- 10.4.9. Manufacturing
- 10.4.10. Other End Users
- 10.1. Market Analysis, Insights and Forecast - by Component
- 11. Middle East and Africa Next-generation Computing Market Analysis, Insights and Forecast, 2019-2031
- 11.1. Market Analysis, Insights and Forecast - by Component
- 11.1.1. Hardware
- 11.1.2. Software
- 11.1.3. Services
- 11.2. Market Analysis, Insights and Forecast - by Computing Type
- 11.2.1. High-Performance Computing
- 11.2.2. Quantum Computing
- 11.2.3. Optical Computing
- 11.2.4. Edge Computing
- 11.2.5. Other Computing Types
- 11.3. Market Analysis, Insights and Forecast - by Deployement
- 11.3.1. Cloud
- 11.3.2. On-Premise
- 11.4. Market Analysis, Insights and Forecast - by End-user
- 11.4.1. Automotive & Transportation
- 11.4.2. Energy & Utilities
- 11.4.3. Healthcare
- 11.4.4. BFSI
- 11.4.5. Aerospace & Defense
- 11.4.6. Media & Entertainment
- 11.4.7. IT & Telecom
- 11.4.8. Retail
- 11.4.9. Manufacturing
- 11.4.10. Other End Users
- 11.1. Market Analysis, Insights and Forecast - by Component
- 12. North America Next-generation Computing Market Analysis, Insights and Forecast, 2019-2031
- 12.1. Market Analysis, Insights and Forecast - By Country/Sub-region
- 12.1.1 United States
- 12.1.2 Canada
- 12.1.3 Mexico
- 13. Europe Next-generation Computing Market Analysis, Insights and Forecast, 2019-2031
- 13.1. Market Analysis, Insights and Forecast - By Country/Sub-region
- 13.1.1 Germany
- 13.1.2 United Kingdom
- 13.1.3 France
- 13.1.4 Spain
- 13.1.5 Italy
- 13.1.6 Spain
- 13.1.7 Belgium
- 13.1.8 Netherland
- 13.1.9 Nordics
- 13.1.10 Rest of Europe
- 14. Asia Pacific Next-generation Computing Market Analysis, Insights and Forecast, 2019-2031
- 14.1. Market Analysis, Insights and Forecast - By Country/Sub-region
- 14.1.1 China
- 14.1.2 Japan
- 14.1.3 India
- 14.1.4 South Korea
- 14.1.5 Southeast Asia
- 14.1.6 Australia
- 14.1.7 Indonesia
- 14.1.8 Phillipes
- 14.1.9 Singapore
- 14.1.10 Thailandc
- 14.1.11 Rest of Asia Pacific
- 15. South America Next-generation Computing Market Analysis, Insights and Forecast, 2019-2031
- 15.1. Market Analysis, Insights and Forecast - By Country/Sub-region
- 15.1.1 Brazil
- 15.1.2 Argentina
- 15.1.3 Peru
- 15.1.4 Chile
- 15.1.5 Colombia
- 15.1.6 Ecuador
- 15.1.7 Venezuela
- 15.1.8 Rest of South America
- 16. North America Next-generation Computing Market Analysis, Insights and Forecast, 2019-2031
- 16.1. Market Analysis, Insights and Forecast - By Country/Sub-region
- 16.1.1 United States
- 16.1.2 Canada
- 16.1.3 Mexico
- 17. MEA Next-generation Computing Market Analysis, Insights and Forecast, 2019-2031
- 17.1. Market Analysis, Insights and Forecast - By Country/Sub-region
- 17.1.1 United Arab Emirates
- 17.1.2 Saudi Arabia
- 17.1.3 South Africa
- 17.1.4 Rest of Middle East and Africa
- 18. Competitive Analysis
- 18.1. Global Market Share Analysis 2024
- 18.2. Company Profiles
- 18.2.1 IBM Corporation
- 18.2.1.1. Overview
- 18.2.1.2. Products
- 18.2.1.3. SWOT Analysis
- 18.2.1.4. Recent Developments
- 18.2.1.5. Financials (Based on Availability)
- 18.2.2 Alibaba Group Holding Limited
- 18.2.2.1. Overview
- 18.2.2.2. Products
- 18.2.2.3. SWOT Analysis
- 18.2.2.4. Recent Developments
- 18.2.2.5. Financials (Based on Availability)
- 18.2.3 Google LLC
- 18.2.3.1. Overview
- 18.2.3.2. Products
- 18.2.3.3. SWOT Analysis
- 18.2.3.4. Recent Developments
- 18.2.3.5. Financials (Based on Availability)
- 18.2.4 Microsoft Corporation
- 18.2.4.1. Overview
- 18.2.4.2. Products
- 18.2.4.3. SWOT Analysis
- 18.2.4.4. Recent Developments
- 18.2.4.5. Financials (Based on Availability)
- 18.2.5 Amazon Web Services Inc
- 18.2.5.1. Overview
- 18.2.5.2. Products
- 18.2.5.3. SWOT Analysis
- 18.2.5.4. Recent Developments
- 18.2.5.5. Financials (Based on Availability)
- 18.2.6 NVIDIA Corp
- 18.2.6.1. Overview
- 18.2.6.2. Products
- 18.2.6.3. SWOT Analysis
- 18.2.6.4. Recent Developments
- 18.2.6.5. Financials (Based on Availability)
- 18.2.7 NEC Corporation
- 18.2.7.1. Overview
- 18.2.7.2. Products
- 18.2.7.3. SWOT Analysis
- 18.2.7.4. Recent Developments
- 18.2.7.5. Financials (Based on Availability)
- 18.2.8 Oracle Corporation
- 18.2.8.1. Overview
- 18.2.8.2. Products
- 18.2.8.3. SWOT Analysis
- 18.2.8.4. Recent Developments
- 18.2.8.5. Financials (Based on Availability)
- 18.2.9 Cisco Systems
- 18.2.9.1. Overview
- 18.2.9.2. Products
- 18.2.9.3. SWOT Analysis
- 18.2.9.4. Recent Developments
- 18.2.9.5. Financials (Based on Availability)
- 18.2.10 Intel Corporation
- 18.2.10.1. Overview
- 18.2.10.2. Products
- 18.2.10.3. SWOT Analysis
- 18.2.10.4. Recent Developments
- 18.2.10.5. Financials (Based on Availability)
- 18.2.1 IBM Corporation
List of Figures
- Figure 1: Global Next-generation Computing Market Revenue Breakdown (Million, %) by Region 2024 & 2032
- Figure 2: Global Next-generation Computing Market Volume Breakdown (K Unit, %) by Region 2024 & 2032
- Figure 3: North America Next-generation Computing Market Revenue (Million), by Country 2024 & 2032
- Figure 4: North America Next-generation Computing Market Volume (K Unit), by Country 2024 & 2032
- Figure 5: North America Next-generation Computing Market Revenue Share (%), by Country 2024 & 2032
- Figure 6: North America Next-generation Computing Market Volume Share (%), by Country 2024 & 2032
- Figure 7: Europe Next-generation Computing Market Revenue (Million), by Country 2024 & 2032
- Figure 8: Europe Next-generation Computing Market Volume (K Unit), by Country 2024 & 2032
- Figure 9: Europe Next-generation Computing Market Revenue Share (%), by Country 2024 & 2032
- Figure 10: Europe Next-generation Computing Market Volume Share (%), by Country 2024 & 2032
- Figure 11: Asia Pacific Next-generation Computing Market Revenue (Million), by Country 2024 & 2032
- Figure 12: Asia Pacific Next-generation Computing Market Volume (K Unit), by Country 2024 & 2032
- Figure 13: Asia Pacific Next-generation Computing Market Revenue Share (%), by Country 2024 & 2032
- Figure 14: Asia Pacific Next-generation Computing Market Volume Share (%), by Country 2024 & 2032
- Figure 15: South America Next-generation Computing Market Revenue (Million), by Country 2024 & 2032
- Figure 16: South America Next-generation Computing Market Volume (K Unit), by Country 2024 & 2032
- Figure 17: South America Next-generation Computing Market Revenue Share (%), by Country 2024 & 2032
- Figure 18: South America Next-generation Computing Market Volume Share (%), by Country 2024 & 2032
- Figure 19: North America Next-generation Computing Market Revenue (Million), by Country 2024 & 2032
- Figure 20: North America Next-generation Computing Market Volume (K Unit), by Country 2024 & 2032
- Figure 21: North America Next-generation Computing Market Revenue Share (%), by Country 2024 & 2032
- Figure 22: North America Next-generation Computing Market Volume Share (%), by Country 2024 & 2032
- Figure 23: MEA Next-generation Computing Market Revenue (Million), by Country 2024 & 2032
- Figure 24: MEA Next-generation Computing Market Volume (K Unit), by Country 2024 & 2032
- Figure 25: MEA Next-generation Computing Market Revenue Share (%), by Country 2024 & 2032
- Figure 26: MEA Next-generation Computing Market Volume Share (%), by Country 2024 & 2032
- Figure 27: North America Next-generation Computing Market Revenue (Million), by Component 2024 & 2032
- Figure 28: North America Next-generation Computing Market Volume (K Unit), by Component 2024 & 2032
- Figure 29: North America Next-generation Computing Market Revenue Share (%), by Component 2024 & 2032
- Figure 30: North America Next-generation Computing Market Volume Share (%), by Component 2024 & 2032
- Figure 31: North America Next-generation Computing Market Revenue (Million), by Computing Type 2024 & 2032
- Figure 32: North America Next-generation Computing Market Volume (K Unit), by Computing Type 2024 & 2032
- Figure 33: North America Next-generation Computing Market Revenue Share (%), by Computing Type 2024 & 2032
- Figure 34: North America Next-generation Computing Market Volume Share (%), by Computing Type 2024 & 2032
- Figure 35: North America Next-generation Computing Market Revenue (Million), by Deployement 2024 & 2032
- Figure 36: North America Next-generation Computing Market Volume (K Unit), by Deployement 2024 & 2032
- Figure 37: North America Next-generation Computing Market Revenue Share (%), by Deployement 2024 & 2032
- Figure 38: North America Next-generation Computing Market Volume Share (%), by Deployement 2024 & 2032
- Figure 39: North America Next-generation Computing Market Revenue (Million), by End-user 2024 & 2032
- Figure 40: North America Next-generation Computing Market Volume (K Unit), by End-user 2024 & 2032
- Figure 41: North America Next-generation Computing Market Revenue Share (%), by End-user 2024 & 2032
- Figure 42: North America Next-generation Computing Market Volume Share (%), by End-user 2024 & 2032
- Figure 43: North America Next-generation Computing Market Revenue (Million), by Country 2024 & 2032
- Figure 44: North America Next-generation Computing Market Volume (K Unit), by Country 2024 & 2032
- Figure 45: North America Next-generation Computing Market Revenue Share (%), by Country 2024 & 2032
- Figure 46: North America Next-generation Computing Market Volume Share (%), by Country 2024 & 2032
- Figure 47: Europe Next-generation Computing Market Revenue (Million), by Component 2024 & 2032
- Figure 48: Europe Next-generation Computing Market Volume (K Unit), by Component 2024 & 2032
- Figure 49: Europe Next-generation Computing Market Revenue Share (%), by Component 2024 & 2032
- Figure 50: Europe Next-generation Computing Market Volume Share (%), by Component 2024 & 2032
- Figure 51: Europe Next-generation Computing Market Revenue (Million), by Computing Type 2024 & 2032
- Figure 52: Europe Next-generation Computing Market Volume (K Unit), by Computing Type 2024 & 2032
- Figure 53: Europe Next-generation Computing Market Revenue Share (%), by Computing Type 2024 & 2032
- Figure 54: Europe Next-generation Computing Market Volume Share (%), by Computing Type 2024 & 2032
- Figure 55: Europe Next-generation Computing Market Revenue (Million), by Deployement 2024 & 2032
- Figure 56: Europe Next-generation Computing Market Volume (K Unit), by Deployement 2024 & 2032
- Figure 57: Europe Next-generation Computing Market Revenue Share (%), by Deployement 2024 & 2032
- Figure 58: Europe Next-generation Computing Market Volume Share (%), by Deployement 2024 & 2032
- Figure 59: Europe Next-generation Computing Market Revenue (Million), by End-user 2024 & 2032
- Figure 60: Europe Next-generation Computing Market Volume (K Unit), by End-user 2024 & 2032
- Figure 61: Europe Next-generation Computing Market Revenue Share (%), by End-user 2024 & 2032
- Figure 62: Europe Next-generation Computing Market Volume Share (%), by End-user 2024 & 2032
- Figure 63: Europe Next-generation Computing Market Revenue (Million), by Country 2024 & 2032
- Figure 64: Europe Next-generation Computing Market Volume (K Unit), by Country 2024 & 2032
- Figure 65: Europe Next-generation Computing Market Revenue Share (%), by Country 2024 & 2032
- Figure 66: Europe Next-generation Computing Market Volume Share (%), by Country 2024 & 2032
- Figure 67: Asia Next-generation Computing Market Revenue (Million), by Component 2024 & 2032
- Figure 68: Asia Next-generation Computing Market Volume (K Unit), by Component 2024 & 2032
- Figure 69: Asia Next-generation Computing Market Revenue Share (%), by Component 2024 & 2032
- Figure 70: Asia Next-generation Computing Market Volume Share (%), by Component 2024 & 2032
- Figure 71: Asia Next-generation Computing Market Revenue (Million), by Computing Type 2024 & 2032
- Figure 72: Asia Next-generation Computing Market Volume (K Unit), by Computing Type 2024 & 2032
- Figure 73: Asia Next-generation Computing Market Revenue Share (%), by Computing Type 2024 & 2032
- Figure 74: Asia Next-generation Computing Market Volume Share (%), by Computing Type 2024 & 2032
- Figure 75: Asia Next-generation Computing Market Revenue (Million), by Deployement 2024 & 2032
- Figure 76: Asia Next-generation Computing Market Volume (K Unit), by Deployement 2024 & 2032
- Figure 77: Asia Next-generation Computing Market Revenue Share (%), by Deployement 2024 & 2032
- Figure 78: Asia Next-generation Computing Market Volume Share (%), by Deployement 2024 & 2032
- Figure 79: Asia Next-generation Computing Market Revenue (Million), by End-user 2024 & 2032
- Figure 80: Asia Next-generation Computing Market Volume (K Unit), by End-user 2024 & 2032
- Figure 81: Asia Next-generation Computing Market Revenue Share (%), by End-user 2024 & 2032
- Figure 82: Asia Next-generation Computing Market Volume Share (%), by End-user 2024 & 2032
- Figure 83: Asia Next-generation Computing Market Revenue (Million), by Country 2024 & 2032
- Figure 84: Asia Next-generation Computing Market Volume (K Unit), by Country 2024 & 2032
- Figure 85: Asia Next-generation Computing Market Revenue Share (%), by Country 2024 & 2032
- Figure 86: Asia Next-generation Computing Market Volume Share (%), by Country 2024 & 2032
- Figure 87: Australia and New Zealand Next-generation Computing Market Revenue (Million), by Component 2024 & 2032
- Figure 88: Australia and New Zealand Next-generation Computing Market Volume (K Unit), by Component 2024 & 2032
- Figure 89: Australia and New Zealand Next-generation Computing Market Revenue Share (%), by Component 2024 & 2032
- Figure 90: Australia and New Zealand Next-generation Computing Market Volume Share (%), by Component 2024 & 2032
- Figure 91: Australia and New Zealand Next-generation Computing Market Revenue (Million), by Computing Type 2024 & 2032
- Figure 92: Australia and New Zealand Next-generation Computing Market Volume (K Unit), by Computing Type 2024 & 2032
- Figure 93: Australia and New Zealand Next-generation Computing Market Revenue Share (%), by Computing Type 2024 & 2032
- Figure 94: Australia and New Zealand Next-generation Computing Market Volume Share (%), by Computing Type 2024 & 2032
- Figure 95: Australia and New Zealand Next-generation Computing Market Revenue (Million), by Deployement 2024 & 2032
- Figure 96: Australia and New Zealand Next-generation Computing Market Volume (K Unit), by Deployement 2024 & 2032
- Figure 97: Australia and New Zealand Next-generation Computing Market Revenue Share (%), by Deployement 2024 & 2032
- Figure 98: Australia and New Zealand Next-generation Computing Market Volume Share (%), by Deployement 2024 & 2032
- Figure 99: Australia and New Zealand Next-generation Computing Market Revenue (Million), by End-user 2024 & 2032
- Figure 100: Australia and New Zealand Next-generation Computing Market Volume (K Unit), by End-user 2024 & 2032
- Figure 101: Australia and New Zealand Next-generation Computing Market Revenue Share (%), by End-user 2024 & 2032
- Figure 102: Australia and New Zealand Next-generation Computing Market Volume Share (%), by End-user 2024 & 2032
- Figure 103: Australia and New Zealand Next-generation Computing Market Revenue (Million), by Country 2024 & 2032
- Figure 104: Australia and New Zealand Next-generation Computing Market Volume (K Unit), by Country 2024 & 2032
- Figure 105: Australia and New Zealand Next-generation Computing Market Revenue Share (%), by Country 2024 & 2032
- Figure 106: Australia and New Zealand Next-generation Computing Market Volume Share (%), by Country 2024 & 2032
- Figure 107: Latin America Next-generation Computing Market Revenue (Million), by Component 2024 & 2032
- Figure 108: Latin America Next-generation Computing Market Volume (K Unit), by Component 2024 & 2032
- Figure 109: Latin America Next-generation Computing Market Revenue Share (%), by Component 2024 & 2032
- Figure 110: Latin America Next-generation Computing Market Volume Share (%), by Component 2024 & 2032
- Figure 111: Latin America Next-generation Computing Market Revenue (Million), by Computing Type 2024 & 2032
- Figure 112: Latin America Next-generation Computing Market Volume (K Unit), by Computing Type 2024 & 2032
- Figure 113: Latin America Next-generation Computing Market Revenue Share (%), by Computing Type 2024 & 2032
- Figure 114: Latin America Next-generation Computing Market Volume Share (%), by Computing Type 2024 & 2032
- Figure 115: Latin America Next-generation Computing Market Revenue (Million), by Deployement 2024 & 2032
- Figure 116: Latin America Next-generation Computing Market Volume (K Unit), by Deployement 2024 & 2032
- Figure 117: Latin America Next-generation Computing Market Revenue Share (%), by Deployement 2024 & 2032
- Figure 118: Latin America Next-generation Computing Market Volume Share (%), by Deployement 2024 & 2032
- Figure 119: Latin America Next-generation Computing Market Revenue (Million), by End-user 2024 & 2032
- Figure 120: Latin America Next-generation Computing Market Volume (K Unit), by End-user 2024 & 2032
- Figure 121: Latin America Next-generation Computing Market Revenue Share (%), by End-user 2024 & 2032
- Figure 122: Latin America Next-generation Computing Market Volume Share (%), by End-user 2024 & 2032
- Figure 123: Latin America Next-generation Computing Market Revenue (Million), by Country 2024 & 2032
- Figure 124: Latin America Next-generation Computing Market Volume (K Unit), by Country 2024 & 2032
- Figure 125: Latin America Next-generation Computing Market Revenue Share (%), by Country 2024 & 2032
- Figure 126: Latin America Next-generation Computing Market Volume Share (%), by Country 2024 & 2032
- Figure 127: Middle East and Africa Next-generation Computing Market Revenue (Million), by Component 2024 & 2032
- Figure 128: Middle East and Africa Next-generation Computing Market Volume (K Unit), by Component 2024 & 2032
- Figure 129: Middle East and Africa Next-generation Computing Market Revenue Share (%), by Component 2024 & 2032
- Figure 130: Middle East and Africa Next-generation Computing Market Volume Share (%), by Component 2024 & 2032
- Figure 131: Middle East and Africa Next-generation Computing Market Revenue (Million), by Computing Type 2024 & 2032
- Figure 132: Middle East and Africa Next-generation Computing Market Volume (K Unit), by Computing Type 2024 & 2032
- Figure 133: Middle East and Africa Next-generation Computing Market Revenue Share (%), by Computing Type 2024 & 2032
- Figure 134: Middle East and Africa Next-generation Computing Market Volume Share (%), by Computing Type 2024 & 2032
- Figure 135: Middle East and Africa Next-generation Computing Market Revenue (Million), by Deployement 2024 & 2032
- Figure 136: Middle East and Africa Next-generation Computing Market Volume (K Unit), by Deployement 2024 & 2032
- Figure 137: Middle East and Africa Next-generation Computing Market Revenue Share (%), by Deployement 2024 & 2032
- Figure 138: Middle East and Africa Next-generation Computing Market Volume Share (%), by Deployement 2024 & 2032
- Figure 139: Middle East and Africa Next-generation Computing Market Revenue (Million), by End-user 2024 & 2032
- Figure 140: Middle East and Africa Next-generation Computing Market Volume (K Unit), by End-user 2024 & 2032
- Figure 141: Middle East and Africa Next-generation Computing Market Revenue Share (%), by End-user 2024 & 2032
- Figure 142: Middle East and Africa Next-generation Computing Market Volume Share (%), by End-user 2024 & 2032
- Figure 143: Middle East and Africa Next-generation Computing Market Revenue (Million), by Country 2024 & 2032
- Figure 144: Middle East and Africa Next-generation Computing Market Volume (K Unit), by Country 2024 & 2032
- Figure 145: Middle East and Africa Next-generation Computing Market Revenue Share (%), by Country 2024 & 2032
- Figure 146: Middle East and Africa Next-generation Computing Market Volume Share (%), by Country 2024 & 2032
List of Tables
- Table 1: Global Next-generation Computing Market Revenue Million Forecast, by Region 2019 & 2032
- Table 2: Global Next-generation Computing Market Volume K Unit Forecast, by Region 2019 & 2032
- Table 3: Global Next-generation Computing Market Revenue Million Forecast, by Component 2019 & 2032
- Table 4: Global Next-generation Computing Market Volume K Unit Forecast, by Component 2019 & 2032
- Table 5: Global Next-generation Computing Market Revenue Million Forecast, by Computing Type 2019 & 2032
- Table 6: Global Next-generation Computing Market Volume K Unit Forecast, by Computing Type 2019 & 2032
- Table 7: Global Next-generation Computing Market Revenue Million Forecast, by Deployement 2019 & 2032
- Table 8: Global Next-generation Computing Market Volume K Unit Forecast, by Deployement 2019 & 2032
- Table 9: Global Next-generation Computing Market Revenue Million Forecast, by End-user 2019 & 2032
- Table 10: Global Next-generation Computing Market Volume K Unit Forecast, by End-user 2019 & 2032
- Table 11: Global Next-generation Computing Market Revenue Million Forecast, by Region 2019 & 2032
- Table 12: Global Next-generation Computing Market Volume K Unit Forecast, by Region 2019 & 2032
- Table 13: Global Next-generation Computing Market Revenue Million Forecast, by Country 2019 & 2032
- Table 14: Global Next-generation Computing Market Volume K Unit Forecast, by Country 2019 & 2032
- Table 15: United States Next-generation Computing Market Revenue (Million) Forecast, by Application 2019 & 2032
- Table 16: United States Next-generation Computing Market Volume (K Unit) Forecast, by Application 2019 & 2032
- Table 17: Canada Next-generation Computing Market Revenue (Million) Forecast, by Application 2019 & 2032
- Table 18: Canada Next-generation Computing Market Volume (K Unit) Forecast, by Application 2019 & 2032
- Table 19: Mexico Next-generation Computing Market Revenue (Million) Forecast, by Application 2019 & 2032
- Table 20: Mexico Next-generation Computing Market Volume (K Unit) Forecast, by Application 2019 & 2032
- Table 21: Global Next-generation Computing Market Revenue Million Forecast, by Country 2019 & 2032
- Table 22: Global Next-generation Computing Market Volume K Unit Forecast, by Country 2019 & 2032
- Table 23: Germany Next-generation Computing Market Revenue (Million) Forecast, by Application 2019 & 2032
- Table 24: Germany Next-generation Computing Market Volume (K Unit) Forecast, by Application 2019 & 2032
- Table 25: United Kingdom Next-generation Computing Market Revenue (Million) Forecast, by Application 2019 & 2032
- Table 26: United Kingdom Next-generation Computing Market Volume (K Unit) Forecast, by Application 2019 & 2032
- Table 27: France Next-generation Computing Market Revenue (Million) Forecast, by Application 2019 & 2032
- Table 28: France Next-generation Computing Market Volume (K Unit) Forecast, by Application 2019 & 2032
- Table 29: Spain Next-generation Computing Market Revenue (Million) Forecast, by Application 2019 & 2032
- Table 30: Spain Next-generation Computing Market Volume (K Unit) Forecast, by Application 2019 & 2032
- Table 31: Italy Next-generation Computing Market Revenue (Million) Forecast, by Application 2019 & 2032
- Table 32: Italy Next-generation Computing Market Volume (K Unit) Forecast, by Application 2019 & 2032
- Table 33: Spain Next-generation Computing Market Revenue (Million) Forecast, by Application 2019 & 2032
- Table 34: Spain Next-generation Computing Market Volume (K Unit) Forecast, by Application 2019 & 2032
- Table 35: Belgium Next-generation Computing Market Revenue (Million) Forecast, by Application 2019 & 2032
- Table 36: Belgium Next-generation Computing Market Volume (K Unit) Forecast, by Application 2019 & 2032
- Table 37: Netherland Next-generation Computing Market Revenue (Million) Forecast, by Application 2019 & 2032
- Table 38: Netherland Next-generation Computing Market Volume (K Unit) Forecast, by Application 2019 & 2032
- Table 39: Nordics Next-generation Computing Market Revenue (Million) Forecast, by Application 2019 & 2032
- Table 40: Nordics Next-generation Computing Market Volume (K Unit) Forecast, by Application 2019 & 2032
- Table 41: Rest of Europe Next-generation Computing Market Revenue (Million) Forecast, by Application 2019 & 2032
- Table 42: Rest of Europe Next-generation Computing Market Volume (K Unit) Forecast, by Application 2019 & 2032
- Table 43: Global Next-generation Computing Market Revenue Million Forecast, by Country 2019 & 2032
- Table 44: Global Next-generation Computing Market Volume K Unit Forecast, by Country 2019 & 2032
- Table 45: China Next-generation Computing Market Revenue (Million) Forecast, by Application 2019 & 2032
- Table 46: China Next-generation Computing Market Volume (K Unit) Forecast, by Application 2019 & 2032
- Table 47: Japan Next-generation Computing Market Revenue (Million) Forecast, by Application 2019 & 2032
- Table 48: Japan Next-generation Computing Market Volume (K Unit) Forecast, by Application 2019 & 2032
- Table 49: India Next-generation Computing Market Revenue (Million) Forecast, by Application 2019 & 2032
- Table 50: India Next-generation Computing Market Volume (K Unit) Forecast, by Application 2019 & 2032
- Table 51: South Korea Next-generation Computing Market Revenue (Million) Forecast, by Application 2019 & 2032
- Table 52: South Korea Next-generation Computing Market Volume (K Unit) Forecast, by Application 2019 & 2032
- Table 53: Southeast Asia Next-generation Computing Market Revenue (Million) Forecast, by Application 2019 & 2032
- Table 54: Southeast Asia Next-generation Computing Market Volume (K Unit) Forecast, by Application 2019 & 2032
- Table 55: Australia Next-generation Computing Market Revenue (Million) Forecast, by Application 2019 & 2032
- Table 56: Australia Next-generation Computing Market Volume (K Unit) Forecast, by Application 2019 & 2032
- Table 57: Indonesia Next-generation Computing Market Revenue (Million) Forecast, by Application 2019 & 2032
- Table 58: Indonesia Next-generation Computing Market Volume (K Unit) Forecast, by Application 2019 & 2032
- Table 59: Phillipes Next-generation Computing Market Revenue (Million) Forecast, by Application 2019 & 2032
- Table 60: Phillipes Next-generation Computing Market Volume (K Unit) Forecast, by Application 2019 & 2032
- Table 61: Singapore Next-generation Computing Market Revenue (Million) Forecast, by Application 2019 & 2032
- Table 62: Singapore Next-generation Computing Market Volume (K Unit) Forecast, by Application 2019 & 2032
- Table 63: Thailandc Next-generation Computing Market Revenue (Million) Forecast, by Application 2019 & 2032
- Table 64: Thailandc Next-generation Computing Market Volume (K Unit) Forecast, by Application 2019 & 2032
- Table 65: Rest of Asia Pacific Next-generation Computing Market Revenue (Million) Forecast, by Application 2019 & 2032
- Table 66: Rest of Asia Pacific Next-generation Computing Market Volume (K Unit) Forecast, by Application 2019 & 2032
- Table 67: Global Next-generation Computing Market Revenue Million Forecast, by Country 2019 & 2032
- Table 68: Global Next-generation Computing Market Volume K Unit Forecast, by Country 2019 & 2032
- Table 69: Brazil Next-generation Computing Market Revenue (Million) Forecast, by Application 2019 & 2032
- Table 70: Brazil Next-generation Computing Market Volume (K Unit) Forecast, by Application 2019 & 2032
- Table 71: Argentina Next-generation Computing Market Revenue (Million) Forecast, by Application 2019 & 2032
- Table 72: Argentina Next-generation Computing Market Volume (K Unit) Forecast, by Application 2019 & 2032
- Table 73: Peru Next-generation Computing Market Revenue (Million) Forecast, by Application 2019 & 2032
- Table 74: Peru Next-generation Computing Market Volume (K Unit) Forecast, by Application 2019 & 2032
- Table 75: Chile Next-generation Computing Market Revenue (Million) Forecast, by Application 2019 & 2032
- Table 76: Chile Next-generation Computing Market Volume (K Unit) Forecast, by Application 2019 & 2032
- Table 77: Colombia Next-generation Computing Market Revenue (Million) Forecast, by Application 2019 & 2032
- Table 78: Colombia Next-generation Computing Market Volume (K Unit) Forecast, by Application 2019 & 2032
- Table 79: Ecuador Next-generation Computing Market Revenue (Million) Forecast, by Application 2019 & 2032
- Table 80: Ecuador Next-generation Computing Market Volume (K Unit) Forecast, by Application 2019 & 2032
- Table 81: Venezuela Next-generation Computing Market Revenue (Million) Forecast, by Application 2019 & 2032
- Table 82: Venezuela Next-generation Computing Market Volume (K Unit) Forecast, by Application 2019 & 2032
- Table 83: Rest of South America Next-generation Computing Market Revenue (Million) Forecast, by Application 2019 & 2032
- Table 84: Rest of South America Next-generation Computing Market Volume (K Unit) Forecast, by Application 2019 & 2032
- Table 85: Global Next-generation Computing Market Revenue Million Forecast, by Country 2019 & 2032
- Table 86: Global Next-generation Computing Market Volume K Unit Forecast, by Country 2019 & 2032
- Table 87: United States Next-generation Computing Market Revenue (Million) Forecast, by Application 2019 & 2032
- Table 88: United States Next-generation Computing Market Volume (K Unit) Forecast, by Application 2019 & 2032
- Table 89: Canada Next-generation Computing Market Revenue (Million) Forecast, by Application 2019 & 2032
- Table 90: Canada Next-generation Computing Market Volume (K Unit) Forecast, by Application 2019 & 2032
- Table 91: Mexico Next-generation Computing Market Revenue (Million) Forecast, by Application 2019 & 2032
- Table 92: Mexico Next-generation Computing Market Volume (K Unit) Forecast, by Application 2019 & 2032
- Table 93: Global Next-generation Computing Market Revenue Million Forecast, by Country 2019 & 2032
- Table 94: Global Next-generation Computing Market Volume K Unit Forecast, by Country 2019 & 2032
- Table 95: United Arab Emirates Next-generation Computing Market Revenue (Million) Forecast, by Application 2019 & 2032
- Table 96: United Arab Emirates Next-generation Computing Market Volume (K Unit) Forecast, by Application 2019 & 2032
- Table 97: Saudi Arabia Next-generation Computing Market Revenue (Million) Forecast, by Application 2019 & 2032
- Table 98: Saudi Arabia Next-generation Computing Market Volume (K Unit) Forecast, by Application 2019 & 2032
- Table 99: South Africa Next-generation Computing Market Revenue (Million) Forecast, by Application 2019 & 2032
- Table 100: South Africa Next-generation Computing Market Volume (K Unit) Forecast, by Application 2019 & 2032
- Table 101: Rest of Middle East and Africa Next-generation Computing Market Revenue (Million) Forecast, by Application 2019 & 2032
- Table 102: Rest of Middle East and Africa Next-generation Computing Market Volume (K Unit) Forecast, by Application 2019 & 2032
- Table 103: Global Next-generation Computing Market Revenue Million Forecast, by Component 2019 & 2032
- Table 104: Global Next-generation Computing Market Volume K Unit Forecast, by Component 2019 & 2032
- Table 105: Global Next-generation Computing Market Revenue Million Forecast, by Computing Type 2019 & 2032
- Table 106: Global Next-generation Computing Market Volume K Unit Forecast, by Computing Type 2019 & 2032
- Table 107: Global Next-generation Computing Market Revenue Million Forecast, by Deployement 2019 & 2032
- Table 108: Global Next-generation Computing Market Volume K Unit Forecast, by Deployement 2019 & 2032
- Table 109: Global Next-generation Computing Market Revenue Million Forecast, by End-user 2019 & 2032
- Table 110: Global Next-generation Computing Market Volume K Unit Forecast, by End-user 2019 & 2032
- Table 111: Global Next-generation Computing Market Revenue Million Forecast, by Country 2019 & 2032
- Table 112: Global Next-generation Computing Market Volume K Unit Forecast, by Country 2019 & 2032
- Table 113: Global Next-generation Computing Market Revenue Million Forecast, by Component 2019 & 2032
- Table 114: Global Next-generation Computing Market Volume K Unit Forecast, by Component 2019 & 2032
- Table 115: Global Next-generation Computing Market Revenue Million Forecast, by Computing Type 2019 & 2032
- Table 116: Global Next-generation Computing Market Volume K Unit Forecast, by Computing Type 2019 & 2032
- Table 117: Global Next-generation Computing Market Revenue Million Forecast, by Deployement 2019 & 2032
- Table 118: Global Next-generation Computing Market Volume K Unit Forecast, by Deployement 2019 & 2032
- Table 119: Global Next-generation Computing Market Revenue Million Forecast, by End-user 2019 & 2032
- Table 120: Global Next-generation Computing Market Volume K Unit Forecast, by End-user 2019 & 2032
- Table 121: Global Next-generation Computing Market Revenue Million Forecast, by Country 2019 & 2032
- Table 122: Global Next-generation Computing Market Volume K Unit Forecast, by Country 2019 & 2032
- Table 123: Global Next-generation Computing Market Revenue Million Forecast, by Component 2019 & 2032
- Table 124: Global Next-generation Computing Market Volume K Unit Forecast, by Component 2019 & 2032
- Table 125: Global Next-generation Computing Market Revenue Million Forecast, by Computing Type 2019 & 2032
- Table 126: Global Next-generation Computing Market Volume K Unit Forecast, by Computing Type 2019 & 2032
- Table 127: Global Next-generation Computing Market Revenue Million Forecast, by Deployement 2019 & 2032
- Table 128: Global Next-generation Computing Market Volume K Unit Forecast, by Deployement 2019 & 2032
- Table 129: Global Next-generation Computing Market Revenue Million Forecast, by End-user 2019 & 2032
- Table 130: Global Next-generation Computing Market Volume K Unit Forecast, by End-user 2019 & 2032
- Table 131: Global Next-generation Computing Market Revenue Million Forecast, by Country 2019 & 2032
- Table 132: Global Next-generation Computing Market Volume K Unit Forecast, by Country 2019 & 2032
- Table 133: Global Next-generation Computing Market Revenue Million Forecast, by Component 2019 & 2032
- Table 134: Global Next-generation Computing Market Volume K Unit Forecast, by Component 2019 & 2032
- Table 135: Global Next-generation Computing Market Revenue Million Forecast, by Computing Type 2019 & 2032
- Table 136: Global Next-generation Computing Market Volume K Unit Forecast, by Computing Type 2019 & 2032
- Table 137: Global Next-generation Computing Market Revenue Million Forecast, by Deployement 2019 & 2032
- Table 138: Global Next-generation Computing Market Volume K Unit Forecast, by Deployement 2019 & 2032
- Table 139: Global Next-generation Computing Market Revenue Million Forecast, by End-user 2019 & 2032
- Table 140: Global Next-generation Computing Market Volume K Unit Forecast, by End-user 2019 & 2032
- Table 141: Global Next-generation Computing Market Revenue Million Forecast, by Country 2019 & 2032
- Table 142: Global Next-generation Computing Market Volume K Unit Forecast, by Country 2019 & 2032
- Table 143: Global Next-generation Computing Market Revenue Million Forecast, by Component 2019 & 2032
- Table 144: Global Next-generation Computing Market Volume K Unit Forecast, by Component 2019 & 2032
- Table 145: Global Next-generation Computing Market Revenue Million Forecast, by Computing Type 2019 & 2032
- Table 146: Global Next-generation Computing Market Volume K Unit Forecast, by Computing Type 2019 & 2032
- Table 147: Global Next-generation Computing Market Revenue Million Forecast, by Deployement 2019 & 2032
- Table 148: Global Next-generation Computing Market Volume K Unit Forecast, by Deployement 2019 & 2032
- Table 149: Global Next-generation Computing Market Revenue Million Forecast, by End-user 2019 & 2032
- Table 150: Global Next-generation Computing Market Volume K Unit Forecast, by End-user 2019 & 2032
- Table 151: Global Next-generation Computing Market Revenue Million Forecast, by Country 2019 & 2032
- Table 152: Global Next-generation Computing Market Volume K Unit Forecast, by Country 2019 & 2032
- Table 153: Global Next-generation Computing Market Revenue Million Forecast, by Component 2019 & 2032
- Table 154: Global Next-generation Computing Market Volume K Unit Forecast, by Component 2019 & 2032
- Table 155: Global Next-generation Computing Market Revenue Million Forecast, by Computing Type 2019 & 2032
- Table 156: Global Next-generation Computing Market Volume K Unit Forecast, by Computing Type 2019 & 2032
- Table 157: Global Next-generation Computing Market Revenue Million Forecast, by Deployement 2019 & 2032
- Table 158: Global Next-generation Computing Market Volume K Unit Forecast, by Deployement 2019 & 2032
- Table 159: Global Next-generation Computing Market Revenue Million Forecast, by End-user 2019 & 2032
- Table 160: Global Next-generation Computing Market Volume K Unit Forecast, by End-user 2019 & 2032
- Table 161: Global Next-generation Computing Market Revenue Million Forecast, by Country 2019 & 2032
- Table 162: Global Next-generation Computing Market Volume K Unit Forecast, by Country 2019 & 2032
Frequently Asked Questions
1. What is the projected Compound Annual Growth Rate (CAGR) of the Next-generation Computing Market?
The projected CAGR is approximately 19.38%.
2. Which companies are prominent players in the Next-generation Computing Market?
Key companies in the market include IBM Corporation, Alibaba Group Holding Limited, Google LLC, Microsoft Corporation, Amazon Web Services Inc, NVIDIA Corp, NEC Corporation, Oracle Corporation, Cisco Systems, Intel Corporation.
3. What are the main segments of the Next-generation Computing Market?
The market segments include Component, Computing Type, Deployement, End-user.
4. Can you provide details about the market size?
The market size is estimated to be USD 191.62 Million as of 2022.
5. What are some drivers contributing to market growth?
Growth in demand for high performance computing; Adoption of Advanced Analytics in SMEs.
6. What are the notable trends driving market growth?
The Cloud Deployment of The Solutions Significantly Contributes to The Market Growth.
7. Are there any restraints impacting market growth?
Risk of Data Breach in Storing and Processing Large Data in Next-gen Computing; High operational challenges in Implementing the Solution.
8. Can you provide examples of recent developments in the market?
July 2023: Moody's and Microsoft have partnered strategically to co-create next-generation data, analytics, research, collaboration, and risk solutions for financial services, which would be built by combining Microsoft's Azure OpenAI Service, Fabric, and Teams with Moody's proprietary data, analytics, and research and has been designed to enhance insights into corporate intelligence and risk assessment.
9. What pricing options are available for accessing the report?
Pricing options include single-user, multi-user, and enterprise licenses priced at USD 4750, USD 5250, and USD 8750 respectively.
10. Is the market size provided in terms of value or volume?
The market size is provided in terms of value, measured in Million and volume, measured in K Unit.
11. Are there any specific market keywords associated with the report?
Yes, the market keyword associated with the report is "Next-generation Computing Market," which aids in identifying and referencing the specific market segment covered.
12. How do I determine which pricing option suits my needs best?
The pricing options vary based on user requirements and access needs. Individual users may opt for single-user licenses, while businesses requiring broader access may choose multi-user or enterprise licenses for cost-effective access to the report.
13. Are there any additional resources or data provided in the Next-generation Computing Market report?
While the report offers comprehensive insights, it's advisable to review the specific contents or supplementary materials provided to ascertain if additional resources or data are available.
14. How can I stay updated on further developments or reports in the Next-generation Computing Market?
To stay informed about further developments, trends, and reports in the Next-generation Computing Market, consider subscribing to industry newsletters, following relevant companies and organizations, or regularly checking reputable industry news sources and publications.
Methodology
Step 1 - Identification of Relevant Samples Size from Population Database


Step 2 - Approaches for Defining Global Market Size (Value, Volume* & Price*)

Note*: In applicable scenarios
Step 3 - Data Sources
Primary Research
- Web Analytics
- Survey Reports
- Research Institute
- Latest Research Reports
- Opinion Leaders
Secondary Research
- Annual Reports
- White Paper
- Latest Press Release
- Industry Association
- Paid Database
- Investor Presentations

Step 4 - Data Triangulation
Involves using different sources of information in order to increase the validity of a study
These sources are likely to be stakeholders in a program - participants, other researchers, program staff, other community members, and so on.
Then we put all data in single framework & apply various statistical tools to find out the dynamic on the market.
During the analysis stage, feedback from the stakeholder groups would be compared to determine areas of agreement as well as areas of divergence


