
Key Insights
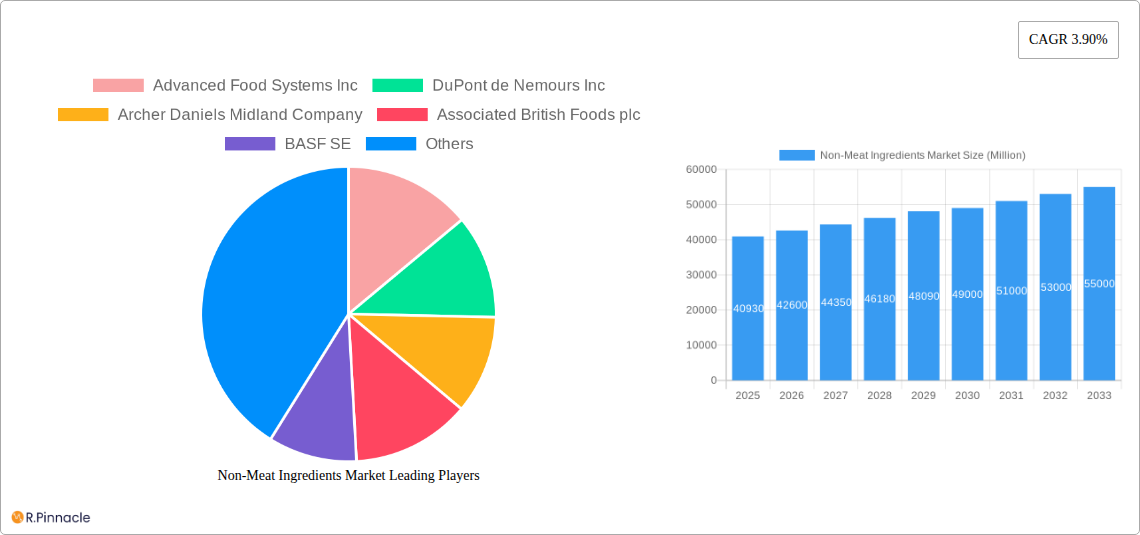
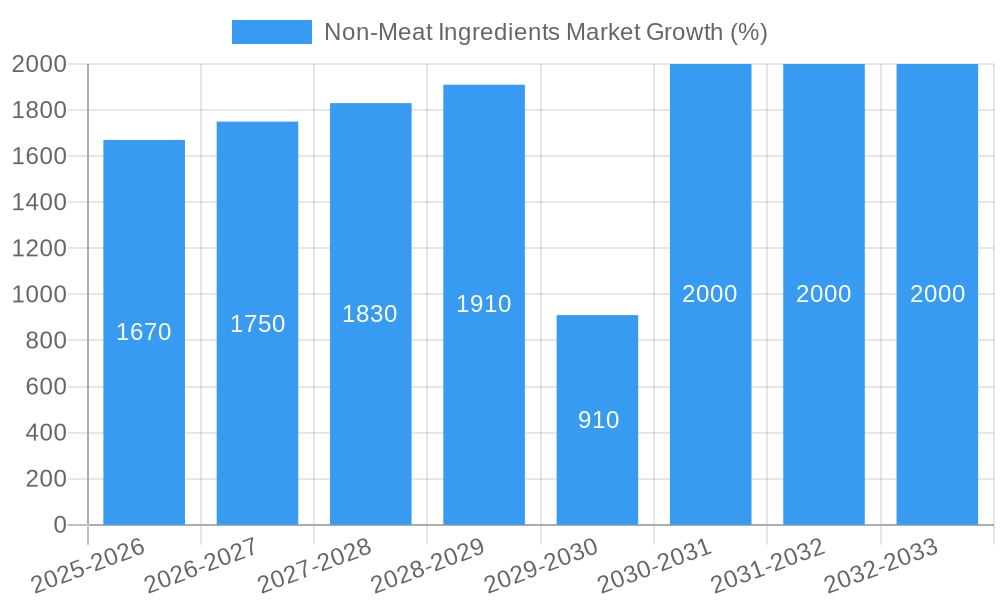
The global non-meat ingredients market, valued at $40.93 billion in 2025, is projected to experience robust growth, driven by several key factors. The rising popularity of plant-based diets and meat alternatives, fueled by increasing health consciousness and environmental concerns, is a primary driver. Consumers are seeking healthier, more sustainable food options, leading to a surge in demand for innovative ingredients that replicate the texture, flavor, and nutritional profile of meat. Technological advancements in food processing and formulation are also playing a crucial role, enabling the development of increasingly realistic and appealing meat alternatives. Specific ingredients like binders, texturizers, and flavoring agents are experiencing particularly high demand as manufacturers strive to perfect the sensory experience of plant-based products. The market is segmented by ingredient type (binders, extenders, fillers, etc.) and product type (fresh, processed, cooked, fermented sausages, etc.), allowing manufacturers to target specific niches and cater to diverse consumer preferences. Geographical distribution shows strong growth across North America and Europe, with emerging markets in Asia-Pacific presenting significant opportunities.
The competitive landscape is characterized by a mix of established food ingredient giants and specialized ingredient suppliers. Companies such as Archer Daniels Midland, DuPont, and Cargill are leveraging their extensive production capabilities and distribution networks to capitalize on market growth. However, smaller companies focused on innovative and specialized ingredients are also gaining traction, particularly in the area of developing novel texturizing agents and flavor profiles. The market is expected to witness increased mergers and acquisitions activity, as larger players seek to consolidate their market share and expand their product portfolios. While some challenges remain, including managing supply chain complexities and fluctuations in raw material prices, the long-term outlook for the non-meat ingredients market remains positive, with a projected CAGR of 3.9% from 2025 to 2033. This sustained growth trajectory will be shaped by continued consumer demand for meat alternatives and ongoing innovations in plant-based food technology.
This comprehensive report provides a detailed analysis of the Non-Meat Ingredients Market, offering invaluable insights for industry professionals, investors, and strategic decision-makers. Leveraging extensive research and data analysis covering the period 2019-2033 (Base Year: 2025, Forecast Period: 2025-2033), this report unveils the market's current state and future trajectory. The market is projected to reach xx Million by 2033, exhibiting a robust CAGR of xx% during the forecast period.
Non-Meat Ingredients Market Structure & Innovation Trends
The Non-Meat Ingredients market exhibits a moderately concentrated structure, with key players like DuPont de Nemours Inc, Archer Daniels Midland Company, and Cargill Incorporated holding significant market share. The combined market share of the top five players is estimated at xx%. Innovation is driven by the increasing demand for plant-based alternatives, necessitating the development of novel ingredients that mimic the texture, flavor, and nutritional profile of meat. Regulatory frameworks, particularly concerning food safety and labeling, significantly influence market dynamics. Product substitutes, such as traditional meat products, pose a competitive challenge. The market is witnessing a surge in M&A activities, with deal values exceeding xx Million in the past five years, indicating consolidation and expansion strategies among key players. The end-user demographics are shifting towards health-conscious consumers seeking sustainable and ethical food choices, fueling market growth.
- Market Concentration: Moderately concentrated, with top 5 players holding xx% market share.
- Innovation Drivers: Growing demand for plant-based alternatives, focus on improved texture and flavor.
- Regulatory Landscape: Stringent food safety and labeling regulations.
- M&A Activity: Significant deal flow exceeding xx Million in the last five years.
- End-User Demographics: Increasing health-conscious and environmentally aware consumers.
Non-Meat Ingredients Market Dynamics & Trends
The Non-Meat Ingredients market is experiencing rapid growth, fueled by several key factors. The rising adoption of vegetarian and vegan lifestyles, along with growing concerns about animal welfare and the environmental impact of meat production, are driving increased demand for plant-based alternatives. Technological advancements in food processing and ingredient formulation are enabling the creation of more realistic and appealing meat substitutes. Consumer preferences are shifting towards healthier, more sustainable, and ethically sourced food options, significantly influencing market trends. Competitive dynamics are intense, with established food companies and emerging startups vying for market share through innovation and strategic partnerships. The market penetration of non-meat ingredients in various food categories is steadily increasing, with significant growth anticipated in ready-to-eat meals, processed foods, and meat alternatives.
Dominant Regions & Segments in Non-Meat Ingredients Market
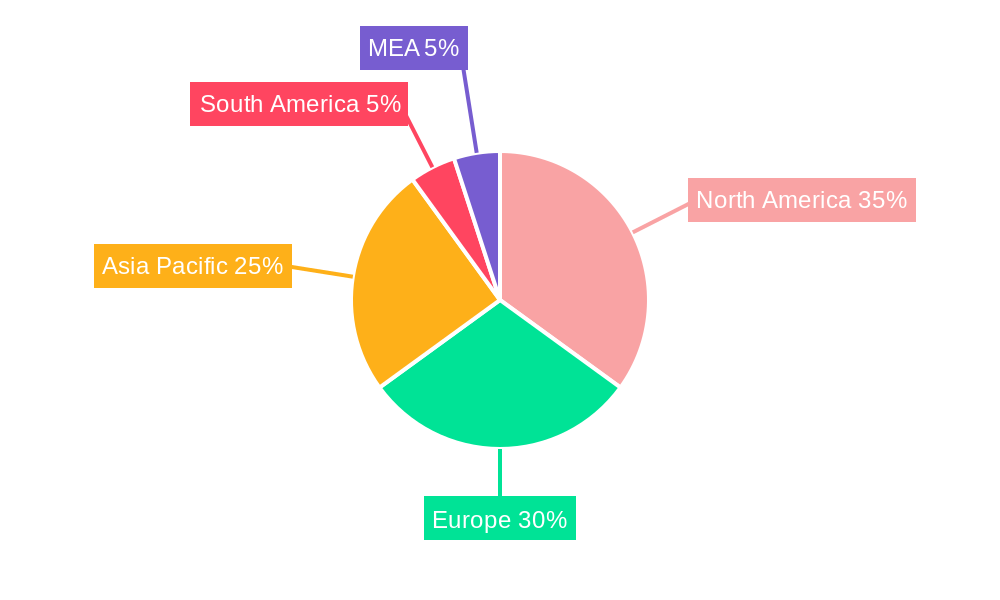
North America currently holds the largest market share in the Non-Meat Ingredients market, driven by factors such as high consumer awareness, strong regulatory support, and a well-established plant-based food industry. Within the segments, "Binders" and "Flavoring Agents" are the leading ingredient categories, with "Fresh Processed" and "Raw Cooked" dominating the product type segment.
Key Drivers for North America:
- High consumer awareness of health and sustainability.
- Strong regulatory support for plant-based foods.
- Well-established plant-based food industry infrastructure.
Dominance Analysis:
North America's dominance stems from the confluence of high consumer demand, supportive regulatory environment, and robust infrastructure. The high disposable income and increasing health consciousness among consumers fuel significant growth in plant-based foods.
Europe and Asia-Pacific are also significant markets, expected to experience substantial growth during the forecast period, driven by increasing consumer adoption and government initiatives.
Non-Meat Ingredients Market Product Innovations
Recent innovations focus on developing non-meat ingredients that enhance texture, flavor, and nutritional value. Technological advancements in extrusion, fermentation, and 3D printing are transforming the production of meat alternatives. Companies are emphasizing clean-label ingredients and sustainable sourcing practices, appealing to health-conscious consumers. The market is seeing increasing adoption of precision fermentation and novel protein sources to enhance the taste, texture, and nutritional value of plant-based meat analogs.
Report Scope & Segmentation Analysis
This report segments the Non-Meat Ingredients Market by Ingredient (Binders, Extenders, Fillers, Flavoring Agents, Coloring Agents, Preservatives, Salt, Texturing Agents) and by Product Type (Fresh Processed, Raw Cooked, Pre Cooked, Raw Fermented Sausages, Others). Each segment's growth projections, market size, and competitive landscape are thoroughly analyzed. For example, the Binders segment is experiencing rapid growth due to its crucial role in providing structure and texture in meat alternatives. Similarly, the Fresh Processed product type enjoys high demand owing to its convenience and shelf life.
Key Drivers of Non-Meat Ingredients Market Growth
Several factors are driving the growth of the Non-Meat Ingredients Market. The growing popularity of vegetarian and vegan diets is a major driver. Concerns about the environmental impact of meat production are also pushing consumers towards plant-based alternatives. Technological advancements in creating realistic meat substitutes are further boosting market growth. Favorable government regulations and initiatives supporting sustainable food options are creating a positive market environment.
Challenges in the Non-Meat Ingredients Market Sector
The Non-Meat Ingredients Market faces several challenges, including high raw material costs, stringent regulatory approvals, and intense competition. Maintaining consistent product quality and addressing consumer concerns about taste and texture remain significant hurdles. Supply chain disruptions and fluctuations in ingredient availability pose additional challenges. The high initial investment costs for production facilities and specialized equipment can also limit market entry for new players.
Emerging Opportunities in Non-Meat Ingredients Market
Emerging opportunities lie in developing innovative ingredients that cater to specific dietary needs, such as gluten-free, allergen-free, and organic options. Expanding into new geographical markets, especially in developing economies with increasing consumer demand, presents substantial growth potential. Focus on personalized nutrition and functional ingredients that offer health benefits are also significant opportunities for market expansion.
Leading Players in the Non-Meat Ingredients Market Market
- Advanced Food Systems Inc
- DuPont de Nemours Inc
- Archer Daniels Midland Company
- Associated British Foods plc
- BASF SE
- Kerry Group PLC
- Ingredion Incorporated
- Koninklijke Dsm N V
- Cargill Incorporated
- Roquette Frères
Key Developments in Non-Meat Ingredients Market Industry
- 2023: DuPont launches a new line of plant-based proteins.
- 2022: ADM and Kerry Group announce a strategic partnership to develop innovative plant-based ingredients.
- 2021: Cargill invests heavily in expanding its plant-based protein production capacity.
Future Outlook for Non-Meat Ingredients Market Market
The future of the Non-Meat Ingredients Market is bright, driven by sustained growth in the plant-based food sector. Continued innovation in ingredient technology, coupled with increasing consumer demand, is expected to fuel further market expansion. Strategic partnerships and collaborations between established food companies and innovative startups will shape market dynamics. The market is projected to experience a period of robust growth, creating significant opportunities for players who can effectively navigate the competitive landscape and adapt to evolving consumer preferences.
Non-Meat Ingredients Market Segmentation
-
1. Ingredient
- 1.1. Binders
- 1.2. Extenders
- 1.3. Fillers
- 1.4. Flavoring Agents
- 1.5. Coloring Agents
- 1.6. Preservatives
- 1.7. Salt
- 1.8. Texturing Agents
-
2. Product Type
- 2.1. Fresh Processed
- 2.2. Raw Cooked
- 2.3. Pre Cooked
- 2.4. Raw Fermented Sausages
- 2.5. Others
Non-Meat Ingredients Market Segmentation By Geography
-
1. North America
- 1.1. United States
- 1.2. Canada
- 1.3. Mexico
- 1.4. Rest of North America
-
2. Europe
- 2.1. Spain
- 2.2. United Kingdom
- 2.3. Germany
- 2.4. France
- 2.5. Italy
- 2.6. Rest of Europe
-
3. Asia Pacific
- 3.1. China
- 3.2. Japan
- 3.3. India
- 3.4. Australia
- 3.5. Rest of Asia Pacific
-
4. Rest of the World
- 4.1. Brazil
- 4.2. Argentina
- 4.3. Others
- 5. Middle East
-
6. South Africa
- 6.1. Saudi Arabia
- 6.2. Rest of Middle East
Non-Meat Ingredients Market REPORT HIGHLIGHTS
| Aspects | Details |
|---|---|
| Study Period | 2019-2033 |
| Base Year | 2024 |
| Estimated Year | 2025 |
| Forecast Period | 2025-2033 |
| Historical Period | 2019-2024 |
| Growth Rate | CAGR of 3.90% from 2019-2033 |
| Segmentation |
|
Table of Contents
- 1. Introduction
- 1.1. Research Scope
- 1.2. Market Segmentation
- 1.3. Research Methodology
- 1.4. Definitions and Assumptions
- 2. Executive Summary
- 2.1. Introduction
- 3. Market Dynamics
- 3.1. Introduction
- 3.2. Market Drivers
- 3.2.1. Growing Health and Fitness Consciousness Among Japanese; Increasing Demand for Meat Analogues
- 3.3. Market Restrains
- 3.3.1. Higher Production Costs and Limited Capacities
- 3.4. Market Trends
- 3.4.1. Increasing Consumption of Meat Snacks
- 4. Market Factor Analysis
- 4.1. Porters Five Forces
- 4.2. Supply/Value Chain
- 4.3. PESTEL analysis
- 4.4. Market Entropy
- 4.5. Patent/Trademark Analysis
- 5. Global Non-Meat Ingredients Market Analysis, Insights and Forecast, 2019-2031
- 5.1. Market Analysis, Insights and Forecast - by Ingredient
- 5.1.1. Binders
- 5.1.2. Extenders
- 5.1.3. Fillers
- 5.1.4. Flavoring Agents
- 5.1.5. Coloring Agents
- 5.1.6. Preservatives
- 5.1.7. Salt
- 5.1.8. Texturing Agents
- 5.2. Market Analysis, Insights and Forecast - by Product Type
- 5.2.1. Fresh Processed
- 5.2.2. Raw Cooked
- 5.2.3. Pre Cooked
- 5.2.4. Raw Fermented Sausages
- 5.2.5. Others
- 5.3. Market Analysis, Insights and Forecast - by Region
- 5.3.1. North America
- 5.3.2. Europe
- 5.3.3. Asia Pacific
- 5.3.4. Rest of the World
- 5.3.5. Middle East
- 5.3.6. South Africa
- 5.1. Market Analysis, Insights and Forecast - by Ingredient
- 6. North America Non-Meat Ingredients Market Analysis, Insights and Forecast, 2019-2031
- 6.1. Market Analysis, Insights and Forecast - by Ingredient
- 6.1.1. Binders
- 6.1.2. Extenders
- 6.1.3. Fillers
- 6.1.4. Flavoring Agents
- 6.1.5. Coloring Agents
- 6.1.6. Preservatives
- 6.1.7. Salt
- 6.1.8. Texturing Agents
- 6.2. Market Analysis, Insights and Forecast - by Product Type
- 6.2.1. Fresh Processed
- 6.2.2. Raw Cooked
- 6.2.3. Pre Cooked
- 6.2.4. Raw Fermented Sausages
- 6.2.5. Others
- 6.1. Market Analysis, Insights and Forecast - by Ingredient
- 7. Europe Non-Meat Ingredients Market Analysis, Insights and Forecast, 2019-2031
- 7.1. Market Analysis, Insights and Forecast - by Ingredient
- 7.1.1. Binders
- 7.1.2. Extenders
- 7.1.3. Fillers
- 7.1.4. Flavoring Agents
- 7.1.5. Coloring Agents
- 7.1.6. Preservatives
- 7.1.7. Salt
- 7.1.8. Texturing Agents
- 7.2. Market Analysis, Insights and Forecast - by Product Type
- 7.2.1. Fresh Processed
- 7.2.2. Raw Cooked
- 7.2.3. Pre Cooked
- 7.2.4. Raw Fermented Sausages
- 7.2.5. Others
- 7.1. Market Analysis, Insights and Forecast - by Ingredient
- 8. Asia Pacific Non-Meat Ingredients Market Analysis, Insights and Forecast, 2019-2031
- 8.1. Market Analysis, Insights and Forecast - by Ingredient
- 8.1.1. Binders
- 8.1.2. Extenders
- 8.1.3. Fillers
- 8.1.4. Flavoring Agents
- 8.1.5. Coloring Agents
- 8.1.6. Preservatives
- 8.1.7. Salt
- 8.1.8. Texturing Agents
- 8.2. Market Analysis, Insights and Forecast - by Product Type
- 8.2.1. Fresh Processed
- 8.2.2. Raw Cooked
- 8.2.3. Pre Cooked
- 8.2.4. Raw Fermented Sausages
- 8.2.5. Others
- 8.1. Market Analysis, Insights and Forecast - by Ingredient
- 9. Rest of the World Non-Meat Ingredients Market Analysis, Insights and Forecast, 2019-2031
- 9.1. Market Analysis, Insights and Forecast - by Ingredient
- 9.1.1. Binders
- 9.1.2. Extenders
- 9.1.3. Fillers
- 9.1.4. Flavoring Agents
- 9.1.5. Coloring Agents
- 9.1.6. Preservatives
- 9.1.7. Salt
- 9.1.8. Texturing Agents
- 9.2. Market Analysis, Insights and Forecast - by Product Type
- 9.2.1. Fresh Processed
- 9.2.2. Raw Cooked
- 9.2.3. Pre Cooked
- 9.2.4. Raw Fermented Sausages
- 9.2.5. Others
- 9.1. Market Analysis, Insights and Forecast - by Ingredient
- 10. Middle East Non-Meat Ingredients Market Analysis, Insights and Forecast, 2019-2031
- 10.1. Market Analysis, Insights and Forecast - by Ingredient
- 10.1.1. Binders
- 10.1.2. Extenders
- 10.1.3. Fillers
- 10.1.4. Flavoring Agents
- 10.1.5. Coloring Agents
- 10.1.6. Preservatives
- 10.1.7. Salt
- 10.1.8. Texturing Agents
- 10.2. Market Analysis, Insights and Forecast - by Product Type
- 10.2.1. Fresh Processed
- 10.2.2. Raw Cooked
- 10.2.3. Pre Cooked
- 10.2.4. Raw Fermented Sausages
- 10.2.5. Others
- 10.1. Market Analysis, Insights and Forecast - by Ingredient
- 11. South Africa Non-Meat Ingredients Market Analysis, Insights and Forecast, 2019-2031
- 11.1. Market Analysis, Insights and Forecast - by Ingredient
- 11.1.1. Binders
- 11.1.2. Extenders
- 11.1.3. Fillers
- 11.1.4. Flavoring Agents
- 11.1.5. Coloring Agents
- 11.1.6. Preservatives
- 11.1.7. Salt
- 11.1.8. Texturing Agents
- 11.2. Market Analysis, Insights and Forecast - by Product Type
- 11.2.1. Fresh Processed
- 11.2.2. Raw Cooked
- 11.2.3. Pre Cooked
- 11.2.4. Raw Fermented Sausages
- 11.2.5. Others
- 11.1. Market Analysis, Insights and Forecast - by Ingredient
- 12. North America Non-Meat Ingredients Market Analysis, Insights and Forecast, 2019-2031
- 12.1. Market Analysis, Insights and Forecast - By Country/Sub-region
- 12.1.1 United States
- 12.1.2 Canada
- 12.1.3 Mexico
- 13. Europe Non-Meat Ingredients Market Analysis, Insights and Forecast, 2019-2031
- 13.1. Market Analysis, Insights and Forecast - By Country/Sub-region
- 13.1.1 Germany
- 13.1.2 United Kingdom
- 13.1.3 France
- 13.1.4 Spain
- 13.1.5 Italy
- 13.1.6 Spain
- 13.1.7 Belgium
- 13.1.8 Netherland
- 13.1.9 Nordics
- 13.1.10 Rest of Europe
- 14. Asia Pacific Non-Meat Ingredients Market Analysis, Insights and Forecast, 2019-2031
- 14.1. Market Analysis, Insights and Forecast - By Country/Sub-region
- 14.1.1 China
- 14.1.2 Japan
- 14.1.3 India
- 14.1.4 South Korea
- 14.1.5 Southeast Asia
- 14.1.6 Australia
- 14.1.7 Indonesia
- 14.1.8 Phillipes
- 14.1.9 Singapore
- 14.1.10 Thailandc
- 14.1.11 Rest of Asia Pacific
- 15. South America Non-Meat Ingredients Market Analysis, Insights and Forecast, 2019-2031
- 15.1. Market Analysis, Insights and Forecast - By Country/Sub-region
- 15.1.1 Brazil
- 15.1.2 Argentina
- 15.1.3 Peru
- 15.1.4 Chile
- 15.1.5 Colombia
- 15.1.6 Ecuador
- 15.1.7 Venezuela
- 15.1.8 Rest of South America
- 16. North America Non-Meat Ingredients Market Analysis, Insights and Forecast, 2019-2031
- 16.1. Market Analysis, Insights and Forecast - By Country/Sub-region
- 16.1.1 United States
- 16.1.2 Canada
- 16.1.3 Mexico
- 17. MEA Non-Meat Ingredients Market Analysis, Insights and Forecast, 2019-2031
- 17.1. Market Analysis, Insights and Forecast - By Country/Sub-region
- 17.1.1 United Arab Emirates
- 17.1.2 Saudi Arabia
- 17.1.3 South Africa
- 17.1.4 Rest of Middle East and Africa
- 18. Competitive Analysis
- 18.1. Global Market Share Analysis 2024
- 18.2. Company Profiles
- 18.2.1 Advanced Food Systems Inc
- 18.2.1.1. Overview
- 18.2.1.2. Products
- 18.2.1.3. SWOT Analysis
- 18.2.1.4. Recent Developments
- 18.2.1.5. Financials (Based on Availability)
- 18.2.2 DuPont de Nemours Inc
- 18.2.2.1. Overview
- 18.2.2.2. Products
- 18.2.2.3. SWOT Analysis
- 18.2.2.4. Recent Developments
- 18.2.2.5. Financials (Based on Availability)
- 18.2.3 Archer Daniels Midland Company
- 18.2.3.1. Overview
- 18.2.3.2. Products
- 18.2.3.3. SWOT Analysis
- 18.2.3.4. Recent Developments
- 18.2.3.5. Financials (Based on Availability)
- 18.2.4 Associated British Foods plc
- 18.2.4.1. Overview
- 18.2.4.2. Products
- 18.2.4.3. SWOT Analysis
- 18.2.4.4. Recent Developments
- 18.2.4.5. Financials (Based on Availability)
- 18.2.5 BASF SE
- 18.2.5.1. Overview
- 18.2.5.2. Products
- 18.2.5.3. SWOT Analysis
- 18.2.5.4. Recent Developments
- 18.2.5.5. Financials (Based on Availability)
- 18.2.6 Kerry Group PLC
- 18.2.6.1. Overview
- 18.2.6.2. Products
- 18.2.6.3. SWOT Analysis
- 18.2.6.4. Recent Developments
- 18.2.6.5. Financials (Based on Availability)
- 18.2.7 Ingredion Incorporated
- 18.2.7.1. Overview
- 18.2.7.2. Products
- 18.2.7.3. SWOT Analysis
- 18.2.7.4. Recent Developments
- 18.2.7.5. Financials (Based on Availability)
- 18.2.8 Koninklijke Dsm N V
- 18.2.8.1. Overview
- 18.2.8.2. Products
- 18.2.8.3. SWOT Analysis
- 18.2.8.4. Recent Developments
- 18.2.8.5. Financials (Based on Availability)
- 18.2.9 Cargill Incorporated
- 18.2.9.1. Overview
- 18.2.9.2. Products
- 18.2.9.3. SWOT Analysis
- 18.2.9.4. Recent Developments
- 18.2.9.5. Financials (Based on Availability)
- 18.2.10 Roquette Frères
- 18.2.10.1. Overview
- 18.2.10.2. Products
- 18.2.10.3. SWOT Analysis
- 18.2.10.4. Recent Developments
- 18.2.10.5. Financials (Based on Availability)
- 18.2.1 Advanced Food Systems Inc
List of Figures
- Figure 1: Global Non-Meat Ingredients Market Revenue Breakdown (Million, %) by Region 2024 & 2032
- Figure 2: Global Non-Meat Ingredients Market Volume Breakdown (K Tons, %) by Region 2024 & 2032
- Figure 3: North America Non-Meat Ingredients Market Revenue (Million), by Country 2024 & 2032
- Figure 4: North America Non-Meat Ingredients Market Volume (K Tons), by Country 2024 & 2032
- Figure 5: North America Non-Meat Ingredients Market Revenue Share (%), by Country 2024 & 2032
- Figure 6: North America Non-Meat Ingredients Market Volume Share (%), by Country 2024 & 2032
- Figure 7: Europe Non-Meat Ingredients Market Revenue (Million), by Country 2024 & 2032
- Figure 8: Europe Non-Meat Ingredients Market Volume (K Tons), by Country 2024 & 2032
- Figure 9: Europe Non-Meat Ingredients Market Revenue Share (%), by Country 2024 & 2032
- Figure 10: Europe Non-Meat Ingredients Market Volume Share (%), by Country 2024 & 2032
- Figure 11: Asia Pacific Non-Meat Ingredients Market Revenue (Million), by Country 2024 & 2032
- Figure 12: Asia Pacific Non-Meat Ingredients Market Volume (K Tons), by Country 2024 & 2032
- Figure 13: Asia Pacific Non-Meat Ingredients Market Revenue Share (%), by Country 2024 & 2032
- Figure 14: Asia Pacific Non-Meat Ingredients Market Volume Share (%), by Country 2024 & 2032
- Figure 15: South America Non-Meat Ingredients Market Revenue (Million), by Country 2024 & 2032
- Figure 16: South America Non-Meat Ingredients Market Volume (K Tons), by Country 2024 & 2032
- Figure 17: South America Non-Meat Ingredients Market Revenue Share (%), by Country 2024 & 2032
- Figure 18: South America Non-Meat Ingredients Market Volume Share (%), by Country 2024 & 2032
- Figure 19: North America Non-Meat Ingredients Market Revenue (Million), by Country 2024 & 2032
- Figure 20: North America Non-Meat Ingredients Market Volume (K Tons), by Country 2024 & 2032
- Figure 21: North America Non-Meat Ingredients Market Revenue Share (%), by Country 2024 & 2032
- Figure 22: North America Non-Meat Ingredients Market Volume Share (%), by Country 2024 & 2032
- Figure 23: MEA Non-Meat Ingredients Market Revenue (Million), by Country 2024 & 2032
- Figure 24: MEA Non-Meat Ingredients Market Volume (K Tons), by Country 2024 & 2032
- Figure 25: MEA Non-Meat Ingredients Market Revenue Share (%), by Country 2024 & 2032
- Figure 26: MEA Non-Meat Ingredients Market Volume Share (%), by Country 2024 & 2032
- Figure 27: North America Non-Meat Ingredients Market Revenue (Million), by Ingredient 2024 & 2032
- Figure 28: North America Non-Meat Ingredients Market Volume (K Tons), by Ingredient 2024 & 2032
- Figure 29: North America Non-Meat Ingredients Market Revenue Share (%), by Ingredient 2024 & 2032
- Figure 30: North America Non-Meat Ingredients Market Volume Share (%), by Ingredient 2024 & 2032
- Figure 31: North America Non-Meat Ingredients Market Revenue (Million), by Product Type 2024 & 2032
- Figure 32: North America Non-Meat Ingredients Market Volume (K Tons), by Product Type 2024 & 2032
- Figure 33: North America Non-Meat Ingredients Market Revenue Share (%), by Product Type 2024 & 2032
- Figure 34: North America Non-Meat Ingredients Market Volume Share (%), by Product Type 2024 & 2032
- Figure 35: North America Non-Meat Ingredients Market Revenue (Million), by Country 2024 & 2032
- Figure 36: North America Non-Meat Ingredients Market Volume (K Tons), by Country 2024 & 2032
- Figure 37: North America Non-Meat Ingredients Market Revenue Share (%), by Country 2024 & 2032
- Figure 38: North America Non-Meat Ingredients Market Volume Share (%), by Country 2024 & 2032
- Figure 39: Europe Non-Meat Ingredients Market Revenue (Million), by Ingredient 2024 & 2032
- Figure 40: Europe Non-Meat Ingredients Market Volume (K Tons), by Ingredient 2024 & 2032
- Figure 41: Europe Non-Meat Ingredients Market Revenue Share (%), by Ingredient 2024 & 2032
- Figure 42: Europe Non-Meat Ingredients Market Volume Share (%), by Ingredient 2024 & 2032
- Figure 43: Europe Non-Meat Ingredients Market Revenue (Million), by Product Type 2024 & 2032
- Figure 44: Europe Non-Meat Ingredients Market Volume (K Tons), by Product Type 2024 & 2032
- Figure 45: Europe Non-Meat Ingredients Market Revenue Share (%), by Product Type 2024 & 2032
- Figure 46: Europe Non-Meat Ingredients Market Volume Share (%), by Product Type 2024 & 2032
- Figure 47: Europe Non-Meat Ingredients Market Revenue (Million), by Country 2024 & 2032
- Figure 48: Europe Non-Meat Ingredients Market Volume (K Tons), by Country 2024 & 2032
- Figure 49: Europe Non-Meat Ingredients Market Revenue Share (%), by Country 2024 & 2032
- Figure 50: Europe Non-Meat Ingredients Market Volume Share (%), by Country 2024 & 2032
- Figure 51: Asia Pacific Non-Meat Ingredients Market Revenue (Million), by Ingredient 2024 & 2032
- Figure 52: Asia Pacific Non-Meat Ingredients Market Volume (K Tons), by Ingredient 2024 & 2032
- Figure 53: Asia Pacific Non-Meat Ingredients Market Revenue Share (%), by Ingredient 2024 & 2032
- Figure 54: Asia Pacific Non-Meat Ingredients Market Volume Share (%), by Ingredient 2024 & 2032
- Figure 55: Asia Pacific Non-Meat Ingredients Market Revenue (Million), by Product Type 2024 & 2032
- Figure 56: Asia Pacific Non-Meat Ingredients Market Volume (K Tons), by Product Type 2024 & 2032
- Figure 57: Asia Pacific Non-Meat Ingredients Market Revenue Share (%), by Product Type 2024 & 2032
- Figure 58: Asia Pacific Non-Meat Ingredients Market Volume Share (%), by Product Type 2024 & 2032
- Figure 59: Asia Pacific Non-Meat Ingredients Market Revenue (Million), by Country 2024 & 2032
- Figure 60: Asia Pacific Non-Meat Ingredients Market Volume (K Tons), by Country 2024 & 2032
- Figure 61: Asia Pacific Non-Meat Ingredients Market Revenue Share (%), by Country 2024 & 2032
- Figure 62: Asia Pacific Non-Meat Ingredients Market Volume Share (%), by Country 2024 & 2032
- Figure 63: Rest of the World Non-Meat Ingredients Market Revenue (Million), by Ingredient 2024 & 2032
- Figure 64: Rest of the World Non-Meat Ingredients Market Volume (K Tons), by Ingredient 2024 & 2032
- Figure 65: Rest of the World Non-Meat Ingredients Market Revenue Share (%), by Ingredient 2024 & 2032
- Figure 66: Rest of the World Non-Meat Ingredients Market Volume Share (%), by Ingredient 2024 & 2032
- Figure 67: Rest of the World Non-Meat Ingredients Market Revenue (Million), by Product Type 2024 & 2032
- Figure 68: Rest of the World Non-Meat Ingredients Market Volume (K Tons), by Product Type 2024 & 2032
- Figure 69: Rest of the World Non-Meat Ingredients Market Revenue Share (%), by Product Type 2024 & 2032
- Figure 70: Rest of the World Non-Meat Ingredients Market Volume Share (%), by Product Type 2024 & 2032
- Figure 71: Rest of the World Non-Meat Ingredients Market Revenue (Million), by Country 2024 & 2032
- Figure 72: Rest of the World Non-Meat Ingredients Market Volume (K Tons), by Country 2024 & 2032
- Figure 73: Rest of the World Non-Meat Ingredients Market Revenue Share (%), by Country 2024 & 2032
- Figure 74: Rest of the World Non-Meat Ingredients Market Volume Share (%), by Country 2024 & 2032
- Figure 75: Middle East Non-Meat Ingredients Market Revenue (Million), by Ingredient 2024 & 2032
- Figure 76: Middle East Non-Meat Ingredients Market Volume (K Tons), by Ingredient 2024 & 2032
- Figure 77: Middle East Non-Meat Ingredients Market Revenue Share (%), by Ingredient 2024 & 2032
- Figure 78: Middle East Non-Meat Ingredients Market Volume Share (%), by Ingredient 2024 & 2032
- Figure 79: Middle East Non-Meat Ingredients Market Revenue (Million), by Product Type 2024 & 2032
- Figure 80: Middle East Non-Meat Ingredients Market Volume (K Tons), by Product Type 2024 & 2032
- Figure 81: Middle East Non-Meat Ingredients Market Revenue Share (%), by Product Type 2024 & 2032
- Figure 82: Middle East Non-Meat Ingredients Market Volume Share (%), by Product Type 2024 & 2032
- Figure 83: Middle East Non-Meat Ingredients Market Revenue (Million), by Country 2024 & 2032
- Figure 84: Middle East Non-Meat Ingredients Market Volume (K Tons), by Country 2024 & 2032
- Figure 85: Middle East Non-Meat Ingredients Market Revenue Share (%), by Country 2024 & 2032
- Figure 86: Middle East Non-Meat Ingredients Market Volume Share (%), by Country 2024 & 2032
- Figure 87: South Africa Non-Meat Ingredients Market Revenue (Million), by Ingredient 2024 & 2032
- Figure 88: South Africa Non-Meat Ingredients Market Volume (K Tons), by Ingredient 2024 & 2032
- Figure 89: South Africa Non-Meat Ingredients Market Revenue Share (%), by Ingredient 2024 & 2032
- Figure 90: South Africa Non-Meat Ingredients Market Volume Share (%), by Ingredient 2024 & 2032
- Figure 91: South Africa Non-Meat Ingredients Market Revenue (Million), by Product Type 2024 & 2032
- Figure 92: South Africa Non-Meat Ingredients Market Volume (K Tons), by Product Type 2024 & 2032
- Figure 93: South Africa Non-Meat Ingredients Market Revenue Share (%), by Product Type 2024 & 2032
- Figure 94: South Africa Non-Meat Ingredients Market Volume Share (%), by Product Type 2024 & 2032
- Figure 95: South Africa Non-Meat Ingredients Market Revenue (Million), by Country 2024 & 2032
- Figure 96: South Africa Non-Meat Ingredients Market Volume (K Tons), by Country 2024 & 2032
- Figure 97: South Africa Non-Meat Ingredients Market Revenue Share (%), by Country 2024 & 2032
- Figure 98: South Africa Non-Meat Ingredients Market Volume Share (%), by Country 2024 & 2032
List of Tables
- Table 1: Global Non-Meat Ingredients Market Revenue Million Forecast, by Region 2019 & 2032
- Table 2: Global Non-Meat Ingredients Market Volume K Tons Forecast, by Region 2019 & 2032
- Table 3: Global Non-Meat Ingredients Market Revenue Million Forecast, by Ingredient 2019 & 2032
- Table 4: Global Non-Meat Ingredients Market Volume K Tons Forecast, by Ingredient 2019 & 2032
- Table 5: Global Non-Meat Ingredients Market Revenue Million Forecast, by Product Type 2019 & 2032
- Table 6: Global Non-Meat Ingredients Market Volume K Tons Forecast, by Product Type 2019 & 2032
- Table 7: Global Non-Meat Ingredients Market Revenue Million Forecast, by Region 2019 & 2032
- Table 8: Global Non-Meat Ingredients Market Volume K Tons Forecast, by Region 2019 & 2032
- Table 9: Global Non-Meat Ingredients Market Revenue Million Forecast, by Country 2019 & 2032
- Table 10: Global Non-Meat Ingredients Market Volume K Tons Forecast, by Country 2019 & 2032
- Table 11: United States Non-Meat Ingredients Market Revenue (Million) Forecast, by Application 2019 & 2032
- Table 12: United States Non-Meat Ingredients Market Volume (K Tons) Forecast, by Application 2019 & 2032
- Table 13: Canada Non-Meat Ingredients Market Revenue (Million) Forecast, by Application 2019 & 2032
- Table 14: Canada Non-Meat Ingredients Market Volume (K Tons) Forecast, by Application 2019 & 2032
- Table 15: Mexico Non-Meat Ingredients Market Revenue (Million) Forecast, by Application 2019 & 2032
- Table 16: Mexico Non-Meat Ingredients Market Volume (K Tons) Forecast, by Application 2019 & 2032
- Table 17: Global Non-Meat Ingredients Market Revenue Million Forecast, by Country 2019 & 2032
- Table 18: Global Non-Meat Ingredients Market Volume K Tons Forecast, by Country 2019 & 2032
- Table 19: Germany Non-Meat Ingredients Market Revenue (Million) Forecast, by Application 2019 & 2032
- Table 20: Germany Non-Meat Ingredients Market Volume (K Tons) Forecast, by Application 2019 & 2032
- Table 21: United Kingdom Non-Meat Ingredients Market Revenue (Million) Forecast, by Application 2019 & 2032
- Table 22: United Kingdom Non-Meat Ingredients Market Volume (K Tons) Forecast, by Application 2019 & 2032
- Table 23: France Non-Meat Ingredients Market Revenue (Million) Forecast, by Application 2019 & 2032
- Table 24: France Non-Meat Ingredients Market Volume (K Tons) Forecast, by Application 2019 & 2032
- Table 25: Spain Non-Meat Ingredients Market Revenue (Million) Forecast, by Application 2019 & 2032
- Table 26: Spain Non-Meat Ingredients Market Volume (K Tons) Forecast, by Application 2019 & 2032
- Table 27: Italy Non-Meat Ingredients Market Revenue (Million) Forecast, by Application 2019 & 2032
- Table 28: Italy Non-Meat Ingredients Market Volume (K Tons) Forecast, by Application 2019 & 2032
- Table 29: Spain Non-Meat Ingredients Market Revenue (Million) Forecast, by Application 2019 & 2032
- Table 30: Spain Non-Meat Ingredients Market Volume (K Tons) Forecast, by Application 2019 & 2032
- Table 31: Belgium Non-Meat Ingredients Market Revenue (Million) Forecast, by Application 2019 & 2032
- Table 32: Belgium Non-Meat Ingredients Market Volume (K Tons) Forecast, by Application 2019 & 2032
- Table 33: Netherland Non-Meat Ingredients Market Revenue (Million) Forecast, by Application 2019 & 2032
- Table 34: Netherland Non-Meat Ingredients Market Volume (K Tons) Forecast, by Application 2019 & 2032
- Table 35: Nordics Non-Meat Ingredients Market Revenue (Million) Forecast, by Application 2019 & 2032
- Table 36: Nordics Non-Meat Ingredients Market Volume (K Tons) Forecast, by Application 2019 & 2032
- Table 37: Rest of Europe Non-Meat Ingredients Market Revenue (Million) Forecast, by Application 2019 & 2032
- Table 38: Rest of Europe Non-Meat Ingredients Market Volume (K Tons) Forecast, by Application 2019 & 2032
- Table 39: Global Non-Meat Ingredients Market Revenue Million Forecast, by Country 2019 & 2032
- Table 40: Global Non-Meat Ingredients Market Volume K Tons Forecast, by Country 2019 & 2032
- Table 41: China Non-Meat Ingredients Market Revenue (Million) Forecast, by Application 2019 & 2032
- Table 42: China Non-Meat Ingredients Market Volume (K Tons) Forecast, by Application 2019 & 2032
- Table 43: Japan Non-Meat Ingredients Market Revenue (Million) Forecast, by Application 2019 & 2032
- Table 44: Japan Non-Meat Ingredients Market Volume (K Tons) Forecast, by Application 2019 & 2032
- Table 45: India Non-Meat Ingredients Market Revenue (Million) Forecast, by Application 2019 & 2032
- Table 46: India Non-Meat Ingredients Market Volume (K Tons) Forecast, by Application 2019 & 2032
- Table 47: South Korea Non-Meat Ingredients Market Revenue (Million) Forecast, by Application 2019 & 2032
- Table 48: South Korea Non-Meat Ingredients Market Volume (K Tons) Forecast, by Application 2019 & 2032
- Table 49: Southeast Asia Non-Meat Ingredients Market Revenue (Million) Forecast, by Application 2019 & 2032
- Table 50: Southeast Asia Non-Meat Ingredients Market Volume (K Tons) Forecast, by Application 2019 & 2032
- Table 51: Australia Non-Meat Ingredients Market Revenue (Million) Forecast, by Application 2019 & 2032
- Table 52: Australia Non-Meat Ingredients Market Volume (K Tons) Forecast, by Application 2019 & 2032
- Table 53: Indonesia Non-Meat Ingredients Market Revenue (Million) Forecast, by Application 2019 & 2032
- Table 54: Indonesia Non-Meat Ingredients Market Volume (K Tons) Forecast, by Application 2019 & 2032
- Table 55: Phillipes Non-Meat Ingredients Market Revenue (Million) Forecast, by Application 2019 & 2032
- Table 56: Phillipes Non-Meat Ingredients Market Volume (K Tons) Forecast, by Application 2019 & 2032
- Table 57: Singapore Non-Meat Ingredients Market Revenue (Million) Forecast, by Application 2019 & 2032
- Table 58: Singapore Non-Meat Ingredients Market Volume (K Tons) Forecast, by Application 2019 & 2032
- Table 59: Thailandc Non-Meat Ingredients Market Revenue (Million) Forecast, by Application 2019 & 2032
- Table 60: Thailandc Non-Meat Ingredients Market Volume (K Tons) Forecast, by Application 2019 & 2032
- Table 61: Rest of Asia Pacific Non-Meat Ingredients Market Revenue (Million) Forecast, by Application 2019 & 2032
- Table 62: Rest of Asia Pacific Non-Meat Ingredients Market Volume (K Tons) Forecast, by Application 2019 & 2032
- Table 63: Global Non-Meat Ingredients Market Revenue Million Forecast, by Country 2019 & 2032
- Table 64: Global Non-Meat Ingredients Market Volume K Tons Forecast, by Country 2019 & 2032
- Table 65: Brazil Non-Meat Ingredients Market Revenue (Million) Forecast, by Application 2019 & 2032
- Table 66: Brazil Non-Meat Ingredients Market Volume (K Tons) Forecast, by Application 2019 & 2032
- Table 67: Argentina Non-Meat Ingredients Market Revenue (Million) Forecast, by Application 2019 & 2032
- Table 68: Argentina Non-Meat Ingredients Market Volume (K Tons) Forecast, by Application 2019 & 2032
- Table 69: Peru Non-Meat Ingredients Market Revenue (Million) Forecast, by Application 2019 & 2032
- Table 70: Peru Non-Meat Ingredients Market Volume (K Tons) Forecast, by Application 2019 & 2032
- Table 71: Chile Non-Meat Ingredients Market Revenue (Million) Forecast, by Application 2019 & 2032
- Table 72: Chile Non-Meat Ingredients Market Volume (K Tons) Forecast, by Application 2019 & 2032
- Table 73: Colombia Non-Meat Ingredients Market Revenue (Million) Forecast, by Application 2019 & 2032
- Table 74: Colombia Non-Meat Ingredients Market Volume (K Tons) Forecast, by Application 2019 & 2032
- Table 75: Ecuador Non-Meat Ingredients Market Revenue (Million) Forecast, by Application 2019 & 2032
- Table 76: Ecuador Non-Meat Ingredients Market Volume (K Tons) Forecast, by Application 2019 & 2032
- Table 77: Venezuela Non-Meat Ingredients Market Revenue (Million) Forecast, by Application 2019 & 2032
- Table 78: Venezuela Non-Meat Ingredients Market Volume (K Tons) Forecast, by Application 2019 & 2032
- Table 79: Rest of South America Non-Meat Ingredients Market Revenue (Million) Forecast, by Application 2019 & 2032
- Table 80: Rest of South America Non-Meat Ingredients Market Volume (K Tons) Forecast, by Application 2019 & 2032
- Table 81: Global Non-Meat Ingredients Market Revenue Million Forecast, by Country 2019 & 2032
- Table 82: Global Non-Meat Ingredients Market Volume K Tons Forecast, by Country 2019 & 2032
- Table 83: United States Non-Meat Ingredients Market Revenue (Million) Forecast, by Application 2019 & 2032
- Table 84: United States Non-Meat Ingredients Market Volume (K Tons) Forecast, by Application 2019 & 2032
- Table 85: Canada Non-Meat Ingredients Market Revenue (Million) Forecast, by Application 2019 & 2032
- Table 86: Canada Non-Meat Ingredients Market Volume (K Tons) Forecast, by Application 2019 & 2032
- Table 87: Mexico Non-Meat Ingredients Market Revenue (Million) Forecast, by Application 2019 & 2032
- Table 88: Mexico Non-Meat Ingredients Market Volume (K Tons) Forecast, by Application 2019 & 2032
- Table 89: Global Non-Meat Ingredients Market Revenue Million Forecast, by Country 2019 & 2032
- Table 90: Global Non-Meat Ingredients Market Volume K Tons Forecast, by Country 2019 & 2032
- Table 91: United Arab Emirates Non-Meat Ingredients Market Revenue (Million) Forecast, by Application 2019 & 2032
- Table 92: United Arab Emirates Non-Meat Ingredients Market Volume (K Tons) Forecast, by Application 2019 & 2032
- Table 93: Saudi Arabia Non-Meat Ingredients Market Revenue (Million) Forecast, by Application 2019 & 2032
- Table 94: Saudi Arabia Non-Meat Ingredients Market Volume (K Tons) Forecast, by Application 2019 & 2032
- Table 95: South Africa Non-Meat Ingredients Market Revenue (Million) Forecast, by Application 2019 & 2032
- Table 96: South Africa Non-Meat Ingredients Market Volume (K Tons) Forecast, by Application 2019 & 2032
- Table 97: Rest of Middle East and Africa Non-Meat Ingredients Market Revenue (Million) Forecast, by Application 2019 & 2032
- Table 98: Rest of Middle East and Africa Non-Meat Ingredients Market Volume (K Tons) Forecast, by Application 2019 & 2032
- Table 99: Global Non-Meat Ingredients Market Revenue Million Forecast, by Ingredient 2019 & 2032
- Table 100: Global Non-Meat Ingredients Market Volume K Tons Forecast, by Ingredient 2019 & 2032
- Table 101: Global Non-Meat Ingredients Market Revenue Million Forecast, by Product Type 2019 & 2032
- Table 102: Global Non-Meat Ingredients Market Volume K Tons Forecast, by Product Type 2019 & 2032
- Table 103: Global Non-Meat Ingredients Market Revenue Million Forecast, by Country 2019 & 2032
- Table 104: Global Non-Meat Ingredients Market Volume K Tons Forecast, by Country 2019 & 2032
- Table 105: United States Non-Meat Ingredients Market Revenue (Million) Forecast, by Application 2019 & 2032
- Table 106: United States Non-Meat Ingredients Market Volume (K Tons) Forecast, by Application 2019 & 2032
- Table 107: Canada Non-Meat Ingredients Market Revenue (Million) Forecast, by Application 2019 & 2032
- Table 108: Canada Non-Meat Ingredients Market Volume (K Tons) Forecast, by Application 2019 & 2032
- Table 109: Mexico Non-Meat Ingredients Market Revenue (Million) Forecast, by Application 2019 & 2032
- Table 110: Mexico Non-Meat Ingredients Market Volume (K Tons) Forecast, by Application 2019 & 2032
- Table 111: Rest of North America Non-Meat Ingredients Market Revenue (Million) Forecast, by Application 2019 & 2032
- Table 112: Rest of North America Non-Meat Ingredients Market Volume (K Tons) Forecast, by Application 2019 & 2032
- Table 113: Global Non-Meat Ingredients Market Revenue Million Forecast, by Ingredient 2019 & 2032
- Table 114: Global Non-Meat Ingredients Market Volume K Tons Forecast, by Ingredient 2019 & 2032
- Table 115: Global Non-Meat Ingredients Market Revenue Million Forecast, by Product Type 2019 & 2032
- Table 116: Global Non-Meat Ingredients Market Volume K Tons Forecast, by Product Type 2019 & 2032
- Table 117: Global Non-Meat Ingredients Market Revenue Million Forecast, by Country 2019 & 2032
- Table 118: Global Non-Meat Ingredients Market Volume K Tons Forecast, by Country 2019 & 2032
- Table 119: Spain Non-Meat Ingredients Market Revenue (Million) Forecast, by Application 2019 & 2032
- Table 120: Spain Non-Meat Ingredients Market Volume (K Tons) Forecast, by Application 2019 & 2032
- Table 121: United Kingdom Non-Meat Ingredients Market Revenue (Million) Forecast, by Application 2019 & 2032
- Table 122: United Kingdom Non-Meat Ingredients Market Volume (K Tons) Forecast, by Application 2019 & 2032
- Table 123: Germany Non-Meat Ingredients Market Revenue (Million) Forecast, by Application 2019 & 2032
- Table 124: Germany Non-Meat Ingredients Market Volume (K Tons) Forecast, by Application 2019 & 2032
- Table 125: France Non-Meat Ingredients Market Revenue (Million) Forecast, by Application 2019 & 2032
- Table 126: France Non-Meat Ingredients Market Volume (K Tons) Forecast, by Application 2019 & 2032
- Table 127: Italy Non-Meat Ingredients Market Revenue (Million) Forecast, by Application 2019 & 2032
- Table 128: Italy Non-Meat Ingredients Market Volume (K Tons) Forecast, by Application 2019 & 2032
- Table 129: Rest of Europe Non-Meat Ingredients Market Revenue (Million) Forecast, by Application 2019 & 2032
- Table 130: Rest of Europe Non-Meat Ingredients Market Volume (K Tons) Forecast, by Application 2019 & 2032
- Table 131: Global Non-Meat Ingredients Market Revenue Million Forecast, by Ingredient 2019 & 2032
- Table 132: Global Non-Meat Ingredients Market Volume K Tons Forecast, by Ingredient 2019 & 2032
- Table 133: Global Non-Meat Ingredients Market Revenue Million Forecast, by Product Type 2019 & 2032
- Table 134: Global Non-Meat Ingredients Market Volume K Tons Forecast, by Product Type 2019 & 2032
- Table 135: Global Non-Meat Ingredients Market Revenue Million Forecast, by Country 2019 & 2032
- Table 136: Global Non-Meat Ingredients Market Volume K Tons Forecast, by Country 2019 & 2032
- Table 137: China Non-Meat Ingredients Market Revenue (Million) Forecast, by Application 2019 & 2032
- Table 138: China Non-Meat Ingredients Market Volume (K Tons) Forecast, by Application 2019 & 2032
- Table 139: Japan Non-Meat Ingredients Market Revenue (Million) Forecast, by Application 2019 & 2032
- Table 140: Japan Non-Meat Ingredients Market Volume (K Tons) Forecast, by Application 2019 & 2032
- Table 141: India Non-Meat Ingredients Market Revenue (Million) Forecast, by Application 2019 & 2032
- Table 142: India Non-Meat Ingredients Market Volume (K Tons) Forecast, by Application 2019 & 2032
- Table 143: Australia Non-Meat Ingredients Market Revenue (Million) Forecast, by Application 2019 & 2032
- Table 144: Australia Non-Meat Ingredients Market Volume (K Tons) Forecast, by Application 2019 & 2032
- Table 145: Rest of Asia Pacific Non-Meat Ingredients Market Revenue (Million) Forecast, by Application 2019 & 2032
- Table 146: Rest of Asia Pacific Non-Meat Ingredients Market Volume (K Tons) Forecast, by Application 2019 & 2032
- Table 147: Global Non-Meat Ingredients Market Revenue Million Forecast, by Ingredient 2019 & 2032
- Table 148: Global Non-Meat Ingredients Market Volume K Tons Forecast, by Ingredient 2019 & 2032
- Table 149: Global Non-Meat Ingredients Market Revenue Million Forecast, by Product Type 2019 & 2032
- Table 150: Global Non-Meat Ingredients Market Volume K Tons Forecast, by Product Type 2019 & 2032
- Table 151: Global Non-Meat Ingredients Market Revenue Million Forecast, by Country 2019 & 2032
- Table 152: Global Non-Meat Ingredients Market Volume K Tons Forecast, by Country 2019 & 2032
- Table 153: Brazil Non-Meat Ingredients Market Revenue (Million) Forecast, by Application 2019 & 2032
- Table 154: Brazil Non-Meat Ingredients Market Volume (K Tons) Forecast, by Application 2019 & 2032
- Table 155: Argentina Non-Meat Ingredients Market Revenue (Million) Forecast, by Application 2019 & 2032
- Table 156: Argentina Non-Meat Ingredients Market Volume (K Tons) Forecast, by Application 2019 & 2032
- Table 157: Others Non-Meat Ingredients Market Revenue (Million) Forecast, by Application 2019 & 2032
- Table 158: Others Non-Meat Ingredients Market Volume (K Tons) Forecast, by Application 2019 & 2032
- Table 159: Global Non-Meat Ingredients Market Revenue Million Forecast, by Ingredient 2019 & 2032
- Table 160: Global Non-Meat Ingredients Market Volume K Tons Forecast, by Ingredient 2019 & 2032
- Table 161: Global Non-Meat Ingredients Market Revenue Million Forecast, by Product Type 2019 & 2032
- Table 162: Global Non-Meat Ingredients Market Volume K Tons Forecast, by Product Type 2019 & 2032
- Table 163: Global Non-Meat Ingredients Market Revenue Million Forecast, by Country 2019 & 2032
- Table 164: Global Non-Meat Ingredients Market Volume K Tons Forecast, by Country 2019 & 2032
- Table 165: Global Non-Meat Ingredients Market Revenue Million Forecast, by Ingredient 2019 & 2032
- Table 166: Global Non-Meat Ingredients Market Volume K Tons Forecast, by Ingredient 2019 & 2032
- Table 167: Global Non-Meat Ingredients Market Revenue Million Forecast, by Product Type 2019 & 2032
- Table 168: Global Non-Meat Ingredients Market Volume K Tons Forecast, by Product Type 2019 & 2032
- Table 169: Global Non-Meat Ingredients Market Revenue Million Forecast, by Country 2019 & 2032
- Table 170: Global Non-Meat Ingredients Market Volume K Tons Forecast, by Country 2019 & 2032
- Table 171: Saudi Arabia Non-Meat Ingredients Market Revenue (Million) Forecast, by Application 2019 & 2032
- Table 172: Saudi Arabia Non-Meat Ingredients Market Volume (K Tons) Forecast, by Application 2019 & 2032
- Table 173: Rest of Middle East Non-Meat Ingredients Market Revenue (Million) Forecast, by Application 2019 & 2032
- Table 174: Rest of Middle East Non-Meat Ingredients Market Volume (K Tons) Forecast, by Application 2019 & 2032
Frequently Asked Questions
1. What is the projected Compound Annual Growth Rate (CAGR) of the Non-Meat Ingredients Market?
The projected CAGR is approximately 3.90%.
2. Which companies are prominent players in the Non-Meat Ingredients Market?
Key companies in the market include Advanced Food Systems Inc, DuPont de Nemours Inc, Archer Daniels Midland Company, Associated British Foods plc, BASF SE, Kerry Group PLC, Ingredion Incorporated, Koninklijke Dsm N V, Cargill Incorporated , Roquette Frères.
3. What are the main segments of the Non-Meat Ingredients Market?
The market segments include Ingredient, Product Type.
4. Can you provide details about the market size?
The market size is estimated to be USD 40930 Million as of 2022.
5. What are some drivers contributing to market growth?
Growing Health and Fitness Consciousness Among Japanese; Increasing Demand for Meat Analogues.
6. What are the notable trends driving market growth?
Increasing Consumption of Meat Snacks.
7. Are there any restraints impacting market growth?
Higher Production Costs and Limited Capacities.
8. Can you provide examples of recent developments in the market?
N/A
9. What pricing options are available for accessing the report?
Pricing options include single-user, multi-user, and enterprise licenses priced at USD 4750, USD 5250, and USD 8750 respectively.
10. Is the market size provided in terms of value or volume?
The market size is provided in terms of value, measured in Million and volume, measured in K Tons.
11. Are there any specific market keywords associated with the report?
Yes, the market keyword associated with the report is "Non-Meat Ingredients Market," which aids in identifying and referencing the specific market segment covered.
12. How do I determine which pricing option suits my needs best?
The pricing options vary based on user requirements and access needs. Individual users may opt for single-user licenses, while businesses requiring broader access may choose multi-user or enterprise licenses for cost-effective access to the report.
13. Are there any additional resources or data provided in the Non-Meat Ingredients Market report?
While the report offers comprehensive insights, it's advisable to review the specific contents or supplementary materials provided to ascertain if additional resources or data are available.
14. How can I stay updated on further developments or reports in the Non-Meat Ingredients Market?
To stay informed about further developments, trends, and reports in the Non-Meat Ingredients Market, consider subscribing to industry newsletters, following relevant companies and organizations, or regularly checking reputable industry news sources and publications.
Methodology
Step 1 - Identification of Relevant Samples Size from Population Database


Step 2 - Approaches for Defining Global Market Size (Value, Volume* & Price*)

Note*: In applicable scenarios
Step 3 - Data Sources
Primary Research
- Web Analytics
- Survey Reports
- Research Institute
- Latest Research Reports
- Opinion Leaders
Secondary Research
- Annual Reports
- White Paper
- Latest Press Release
- Industry Association
- Paid Database
- Investor Presentations

Step 4 - Data Triangulation
Involves using different sources of information in order to increase the validity of a study
These sources are likely to be stakeholders in a program - participants, other researchers, program staff, other community members, and so on.
Then we put all data in single framework & apply various statistical tools to find out the dynamic on the market.
During the analysis stage, feedback from the stakeholder groups would be compared to determine areas of agreement as well as areas of divergence


