
Key Insights
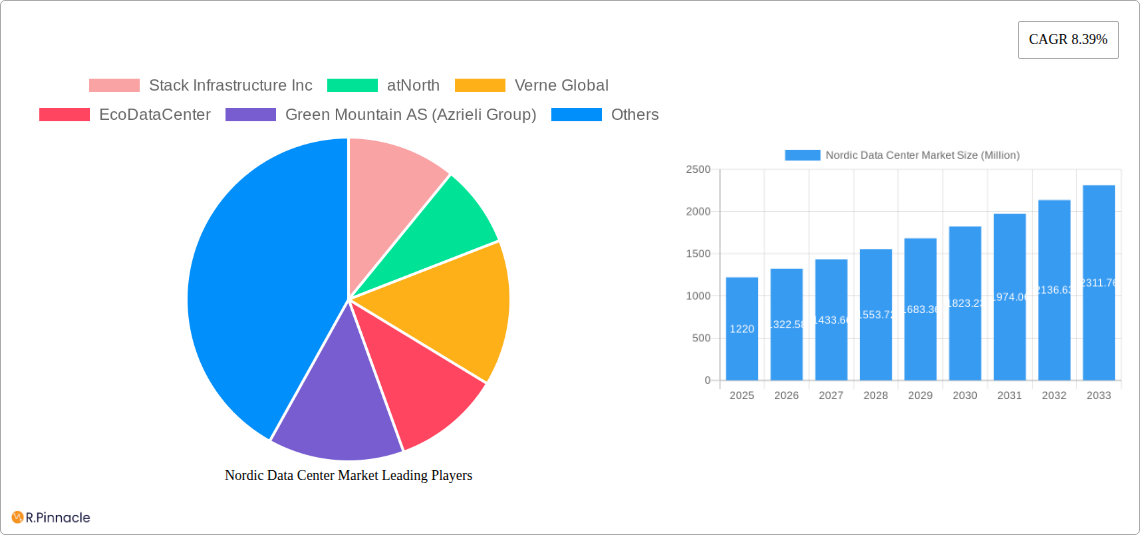
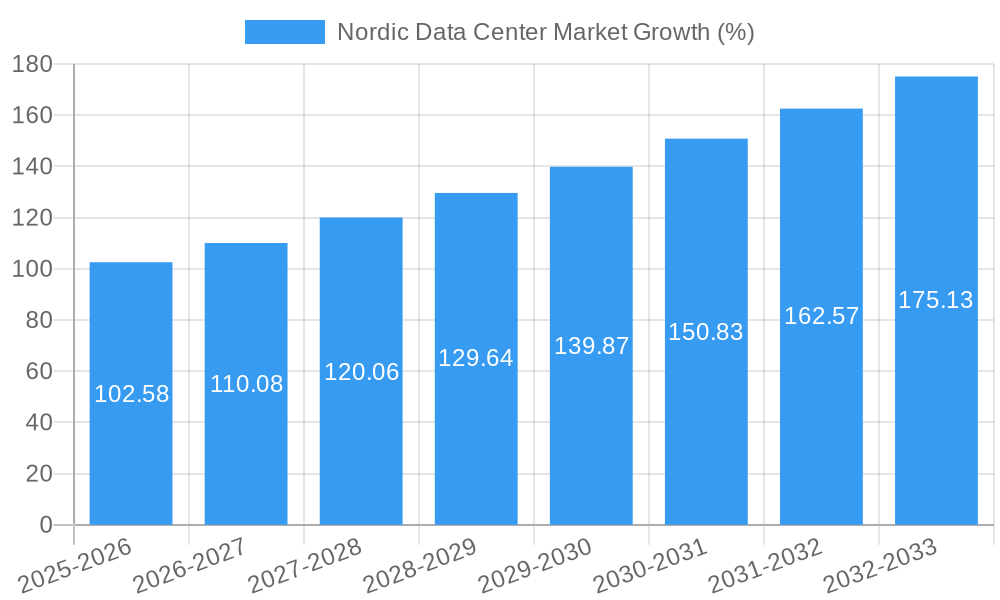
The Nordic data center market, valued at $1.22 billion in 2025, is experiencing robust growth, projected to expand at a compound annual growth rate (CAGR) of 8.39% from 2025 to 2033. This expansion is fueled by several key drivers. Firstly, the region's strong digital infrastructure, including high-speed internet connectivity and renewable energy resources, attracts significant investment from hyperscale cloud providers and colocation operators. Secondly, the increasing demand for data storage and processing power across various sectors, including finance, technology, and gaming, further boosts market growth. Stringent data privacy regulations within the Nordic countries also encourage businesses to locate their data centers within the region, contributing to the market's expansion. Finally, government initiatives supporting digitalization and the development of sustainable infrastructure provide a conducive environment for data center growth. Competitive pricing and a skilled workforce also contribute to the appeal of the Nordic region for data center investments.
However, the market faces certain challenges. Land scarcity and high construction costs in some areas could limit expansion, especially in densely populated urban centers. Furthermore, while renewable energy is a major advantage, ensuring a stable and reliable power supply capable of meeting the escalating energy demands of data centers remains crucial. Maintaining a competitive edge against other data center hubs globally will also require continuous investment in infrastructure and talent development. The market segmentation is likely diverse, encompassing hyperscale facilities, colocation centers, and edge data centers, each catering to specific customer needs and technological requirements. This diversity will likely shape the competitive landscape, fostering both cooperation and competition among the listed companies. Companies like Equinix, Interxion, and others will continue to play a pivotal role, expanding their presence and leveraging their expertise to capitalize on the ongoing market growth.
Nordic Data Center Market: A Comprehensive Report (2019-2033)
This in-depth report provides a comprehensive analysis of the Nordic data center market, covering market structure, dynamics, key players, and future projections from 2019 to 2033. Ideal for industry professionals, investors, and strategic planners, this report offers actionable insights and forecasts to navigate this rapidly evolving sector. The base year for this report is 2025, with estimations for 2025 and a forecast period spanning 2025-2033. The historical period analyzed is 2019-2024.
Nordic Data Center Market Structure & Innovation Trends
This section analyzes the competitive landscape, innovation drivers, and regulatory environment within the Nordic data center market. We examine market concentration, highlighting the market share of key players and assessing the impact of mergers and acquisitions (M&A) activities. The report also explores the influence of regulatory frameworks, the presence of substitute products, and the evolving demographics of end-users.
- Market Concentration: The Nordic data center market exhibits a [xx]% concentration ratio, with the top 5 players holding a combined market share of [xx]%. This indicates a [competitive/oligopolistic] market structure.
- Innovation Drivers: Key drivers include advancements in cooling technologies, increasing adoption of sustainable energy sources, and the rising demand for edge computing solutions.
- M&A Activity: Significant M&A deals in the region totaled approximately [xx] Million in the period 2019-2024, with notable transactions including [mention specific examples if available]. The average deal value was approximately [xx] Million.
- Regulatory Frameworks: The regulatory landscape in the Nordic countries is [describe the regulatory environment, including any key legislation or policies impacting data center development]. This impacts the market by [explain the impact of regulations].
- Product Substitutes: [Discuss potential substitute solutions for traditional data centers, e.g., cloud computing].
- End-User Demographics: The primary end-users are [identify key user segments, e.g., hyperscalers, enterprises, and government agencies] with their specific requirements and growth expectations.
Nordic Data Center Market Dynamics & Trends
This section examines the growth drivers, technological disruptions, and competitive dynamics shaping the Nordic data center market. We delve into consumer preferences, market penetration rates, and compound annual growth rates (CAGR). The market is projected to experience significant growth driven by the factors analyzed below. The CAGR for the forecast period (2025-2033) is estimated to be [xx]%. Market penetration in [specific segment or region] is expected to reach [xx]% by 2033.
[Insert a 600-word paragraph detailing market growth drivers, technological disruptions, consumer preferences, and competitive dynamics. Include specific metrics like CAGR and market penetration.]
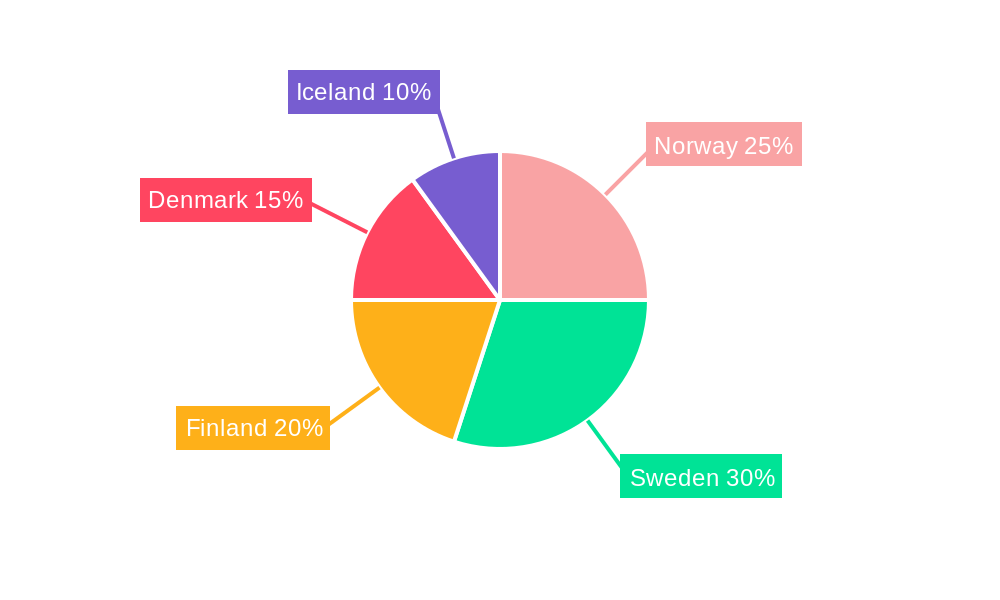
Dominant Regions & Segments in Nordic Data Center Market
This section identifies the leading regions and segments within the Nordic data center market, analyzing their respective growth drivers and market dominance.
- Dominant Region: [Identify the leading region, e.g., Sweden, Norway, Finland, etc.].
- Key Drivers:
- Robust digital infrastructure.
- Favorable government policies supporting data center development.
- Abundant renewable energy resources.
- Strong telecom infrastructure.
- [Add other relevant points]
- Key Drivers:
- Dominant Segment: [Identify the leading segment, e.g., hyperscale data centers, colocation facilities].
- Key Drivers:
- High demand from cloud providers.
- Increasing data storage needs.
- [Add other relevant points]
- Key Drivers:
[Insert a detailed dominance analysis for the leading region and segment, explaining their market leadership in approximately 600 words.]
Nordic Data Center Market Product Innovations
The Nordic data center market is witnessing significant advancements in areas such as energy efficiency, cooling solutions, and modular design. This leads to greater scalability, reduced operational costs, and improved sustainability. New products and services are continuously being developed to meet the evolving demands of various industries. These innovations are driving adoption across various segments and enhancing the overall competitive landscape.
Report Scope & Segmentation Analysis
This report segments the Nordic data center market based on [list segmentation criteria, e.g., data center type, customer size, location]. Each segment's growth prospects, market size, and competitive landscape are comprehensively evaluated. [Provide a paragraph for each segment including the growth projections, market size, and competitive dynamics.]
Key Drivers of Nordic Data Center Market Growth
Several factors contribute to the sustained growth of the Nordic data center market. These include the increasing demand for digital services, the rise of cloud computing, the adoption of 5G networks, and the region's commitment to renewable energy sources, which makes the Nordic region increasingly attractive for data center operations. Furthermore, supportive government policies and the availability of skilled labor further bolster this market's expansion.
Challenges in the Nordic Data Center Market Sector
Despite the promising outlook, the Nordic data center market faces challenges such as limited land availability in certain regions, high energy costs, and competition from other data center hubs. Regulatory complexities and potential supply chain disruptions also pose risks to market expansion. The impact of these challenges can be seen in [mention quantified impacts, e.g., project delays, increased operational costs].
Emerging Opportunities in Nordic Data Center Market
The Nordic region presents several opportunities for future growth in the data center market. These include the expansion of edge computing deployments, the growing adoption of artificial intelligence and machine learning, and the emergence of new digital services. The focus on sustainability and renewable energy provides a significant competitive advantage and further attracts investment in this sector.
Leading Players in the Nordic Data Center Market Market
- Stack Infrastructure Inc
- atNorth
- Verne Global
- EcoDataCenter
- Green Mountain AS (Azrieli Group)
- Interxion (Digital Realty Trust Inc)
- Equinix Inc
- Bahnhof
- Lefdal Mine Data center
- Global Connect
- Bulk Infrastructure Group AS
- New Mining6
Key Developments in Nordic Data Center Market Industry
- November 2023: EcodataCenter's EUR 200 Million investment to expand its Swedish facility, doubling its capacity to 45 megawatts by Q2 2025, signifies a major commitment to the region's growth.
- November 2023: Green Mountain AS announced a new 10-megawatt data center outside Oslo, launching in September 2024, strengthening Norway's position in the market.
- February 2023: atNorth's plans for a new 15 MW data center in Helsinki, operational by Q3 2024, demonstrate continued investment in Finland's data center infrastructure.
Future Outlook for Nordic Data Center Market Market
The Nordic data center market is poised for continued growth, driven by the increasing demand for digital services, the region's commitment to sustainability, and favorable government policies. Strategic investments in renewable energy, infrastructure improvements, and the adoption of innovative technologies will further solidify the Nordic region's position as a leading data center hub. The market is projected to witness significant expansion throughout the forecast period, presenting lucrative opportunities for industry participants.
Nordic Data Center Market Segmentation
-
1. Data Center Size
- 1.1. Large
- 1.2. Massive
- 1.3. Medium
- 1.4. Mega
- 1.5. Small
-
2. Tier Type
- 2.1. Tier 1 and 2
- 2.2. Tier 3
- 2.3. Tier 4
-
3. Absorption
- 3.1. Non-Utilized
-
3.2. By Colocation Type
- 3.2.1. Hyperscale
- 3.2.2. Retail
- 3.2.3. Wholesale
-
3.3. By End User
- 3.3.1. BFSI
- 3.3.2. Cloud
- 3.3.3. E-Commerce
- 3.3.4. Government
- 3.3.5. Manufacturing
- 3.3.6. Media & Entertainment
- 3.3.7. Telecom
- 3.3.8. Other End-Users
Nordic Data Center Market Segmentation By Geography
-
1. North America
- 1.1. United States
- 1.2. Canada
- 1.3. Mexico
-
2. South America
- 2.1. Brazil
- 2.2. Argentina
- 2.3. Rest of South America
-
3. Europe
- 3.1. United Kingdom
- 3.2. Germany
- 3.3. France
- 3.4. Italy
- 3.5. Spain
- 3.6. Russia
- 3.7. Benelux
- 3.8. Nordics
- 3.9. Rest of Europe
-
4. Middle East & Africa
- 4.1. Turkey
- 4.2. Israel
- 4.3. GCC
- 4.4. North Africa
- 4.5. South Africa
- 4.6. Rest of Middle East & Africa
-
5. Asia Pacific
- 5.1. China
- 5.2. India
- 5.3. Japan
- 5.4. South Korea
- 5.5. ASEAN
- 5.6. Oceania
- 5.7. Rest of Asia Pacific
Nordic Data Center Market REPORT HIGHLIGHTS
| Aspects | Details |
|---|---|
| Study Period | 2019-2033 |
| Base Year | 2024 |
| Estimated Year | 2025 |
| Forecast Period | 2025-2033 |
| Historical Period | 2019-2024 |
| Growth Rate | CAGR of 8.39% from 2019-2033 |
| Segmentation |
|
Table of Contents
- 1. Introduction
- 1.1. Research Scope
- 1.2. Market Segmentation
- 1.3. Research Methodology
- 1.4. Definitions and Assumptions
- 2. Executive Summary
- 2.1. Introduction
- 3. Market Dynamics
- 3.1. Introduction
- 3.2. Market Drivers
- 3.3. Market Restrains
- 3.4. Market Trends
- 3.4.1 Tier 3 Data Center Dominates the Market
- 3.4.2 while Tier 4 Growing the Fastest
- 4. Market Factor Analysis
- 4.1. Porters Five Forces
- 4.2. Supply/Value Chain
- 4.3. PESTEL analysis
- 4.4. Market Entropy
- 4.5. Patent/Trademark Analysis
- 5. Global Nordic Data Center Market Analysis, Insights and Forecast, 2019-2031
- 5.1. Market Analysis, Insights and Forecast - by Data Center Size
- 5.1.1. Large
- 5.1.2. Massive
- 5.1.3. Medium
- 5.1.4. Mega
- 5.1.5. Small
- 5.2. Market Analysis, Insights and Forecast - by Tier Type
- 5.2.1. Tier 1 and 2
- 5.2.2. Tier 3
- 5.2.3. Tier 4
- 5.3. Market Analysis, Insights and Forecast - by Absorption
- 5.3.1. Non-Utilized
- 5.3.2. By Colocation Type
- 5.3.2.1. Hyperscale
- 5.3.2.2. Retail
- 5.3.2.3. Wholesale
- 5.3.3. By End User
- 5.3.3.1. BFSI
- 5.3.3.2. Cloud
- 5.3.3.3. E-Commerce
- 5.3.3.4. Government
- 5.3.3.5. Manufacturing
- 5.3.3.6. Media & Entertainment
- 5.3.3.7. Telecom
- 5.3.3.8. Other End-Users
- 5.4. Market Analysis, Insights and Forecast - by Region
- 5.4.1. North America
- 5.4.2. South America
- 5.4.3. Europe
- 5.4.4. Middle East & Africa
- 5.4.5. Asia Pacific
- 5.1. Market Analysis, Insights and Forecast - by Data Center Size
- 6. North America Nordic Data Center Market Analysis, Insights and Forecast, 2019-2031
- 6.1. Market Analysis, Insights and Forecast - by Data Center Size
- 6.1.1. Large
- 6.1.2. Massive
- 6.1.3. Medium
- 6.1.4. Mega
- 6.1.5. Small
- 6.2. Market Analysis, Insights and Forecast - by Tier Type
- 6.2.1. Tier 1 and 2
- 6.2.2. Tier 3
- 6.2.3. Tier 4
- 6.3. Market Analysis, Insights and Forecast - by Absorption
- 6.3.1. Non-Utilized
- 6.3.2. By Colocation Type
- 6.3.2.1. Hyperscale
- 6.3.2.2. Retail
- 6.3.2.3. Wholesale
- 6.3.3. By End User
- 6.3.3.1. BFSI
- 6.3.3.2. Cloud
- 6.3.3.3. E-Commerce
- 6.3.3.4. Government
- 6.3.3.5. Manufacturing
- 6.3.3.6. Media & Entertainment
- 6.3.3.7. Telecom
- 6.3.3.8. Other End-Users
- 6.1. Market Analysis, Insights and Forecast - by Data Center Size
- 7. South America Nordic Data Center Market Analysis, Insights and Forecast, 2019-2031
- 7.1. Market Analysis, Insights and Forecast - by Data Center Size
- 7.1.1. Large
- 7.1.2. Massive
- 7.1.3. Medium
- 7.1.4. Mega
- 7.1.5. Small
- 7.2. Market Analysis, Insights and Forecast - by Tier Type
- 7.2.1. Tier 1 and 2
- 7.2.2. Tier 3
- 7.2.3. Tier 4
- 7.3. Market Analysis, Insights and Forecast - by Absorption
- 7.3.1. Non-Utilized
- 7.3.2. By Colocation Type
- 7.3.2.1. Hyperscale
- 7.3.2.2. Retail
- 7.3.2.3. Wholesale
- 7.3.3. By End User
- 7.3.3.1. BFSI
- 7.3.3.2. Cloud
- 7.3.3.3. E-Commerce
- 7.3.3.4. Government
- 7.3.3.5. Manufacturing
- 7.3.3.6. Media & Entertainment
- 7.3.3.7. Telecom
- 7.3.3.8. Other End-Users
- 7.1. Market Analysis, Insights and Forecast - by Data Center Size
- 8. Europe Nordic Data Center Market Analysis, Insights and Forecast, 2019-2031
- 8.1. Market Analysis, Insights and Forecast - by Data Center Size
- 8.1.1. Large
- 8.1.2. Massive
- 8.1.3. Medium
- 8.1.4. Mega
- 8.1.5. Small
- 8.2. Market Analysis, Insights and Forecast - by Tier Type
- 8.2.1. Tier 1 and 2
- 8.2.2. Tier 3
- 8.2.3. Tier 4
- 8.3. Market Analysis, Insights and Forecast - by Absorption
- 8.3.1. Non-Utilized
- 8.3.2. By Colocation Type
- 8.3.2.1. Hyperscale
- 8.3.2.2. Retail
- 8.3.2.3. Wholesale
- 8.3.3. By End User
- 8.3.3.1. BFSI
- 8.3.3.2. Cloud
- 8.3.3.3. E-Commerce
- 8.3.3.4. Government
- 8.3.3.5. Manufacturing
- 8.3.3.6. Media & Entertainment
- 8.3.3.7. Telecom
- 8.3.3.8. Other End-Users
- 8.1. Market Analysis, Insights and Forecast - by Data Center Size
- 9. Middle East & Africa Nordic Data Center Market Analysis, Insights and Forecast, 2019-2031
- 9.1. Market Analysis, Insights and Forecast - by Data Center Size
- 9.1.1. Large
- 9.1.2. Massive
- 9.1.3. Medium
- 9.1.4. Mega
- 9.1.5. Small
- 9.2. Market Analysis, Insights and Forecast - by Tier Type
- 9.2.1. Tier 1 and 2
- 9.2.2. Tier 3
- 9.2.3. Tier 4
- 9.3. Market Analysis, Insights and Forecast - by Absorption
- 9.3.1. Non-Utilized
- 9.3.2. By Colocation Type
- 9.3.2.1. Hyperscale
- 9.3.2.2. Retail
- 9.3.2.3. Wholesale
- 9.3.3. By End User
- 9.3.3.1. BFSI
- 9.3.3.2. Cloud
- 9.3.3.3. E-Commerce
- 9.3.3.4. Government
- 9.3.3.5. Manufacturing
- 9.3.3.6. Media & Entertainment
- 9.3.3.7. Telecom
- 9.3.3.8. Other End-Users
- 9.1. Market Analysis, Insights and Forecast - by Data Center Size
- 10. Asia Pacific Nordic Data Center Market Analysis, Insights and Forecast, 2019-2031
- 10.1. Market Analysis, Insights and Forecast - by Data Center Size
- 10.1.1. Large
- 10.1.2. Massive
- 10.1.3. Medium
- 10.1.4. Mega
- 10.1.5. Small
- 10.2. Market Analysis, Insights and Forecast - by Tier Type
- 10.2.1. Tier 1 and 2
- 10.2.2. Tier 3
- 10.2.3. Tier 4
- 10.3. Market Analysis, Insights and Forecast - by Absorption
- 10.3.1. Non-Utilized
- 10.3.2. By Colocation Type
- 10.3.2.1. Hyperscale
- 10.3.2.2. Retail
- 10.3.2.3. Wholesale
- 10.3.3. By End User
- 10.3.3.1. BFSI
- 10.3.3.2. Cloud
- 10.3.3.3. E-Commerce
- 10.3.3.4. Government
- 10.3.3.5. Manufacturing
- 10.3.3.6. Media & Entertainment
- 10.3.3.7. Telecom
- 10.3.3.8. Other End-Users
- 10.1. Market Analysis, Insights and Forecast - by Data Center Size
- 11. Competitive Analysis
- 11.1. Global Market Share Analysis 2024
- 11.2. Company Profiles
- 11.2.1 Stack Infrastructure Inc
- 11.2.1.1. Overview
- 11.2.1.2. Products
- 11.2.1.3. SWOT Analysis
- 11.2.1.4. Recent Developments
- 11.2.1.5. Financials (Based on Availability)
- 11.2.2 atNorth
- 11.2.2.1. Overview
- 11.2.2.2. Products
- 11.2.2.3. SWOT Analysis
- 11.2.2.4. Recent Developments
- 11.2.2.5. Financials (Based on Availability)
- 11.2.3 Verne Global
- 11.2.3.1. Overview
- 11.2.3.2. Products
- 11.2.3.3. SWOT Analysis
- 11.2.3.4. Recent Developments
- 11.2.3.5. Financials (Based on Availability)
- 11.2.4 EcoDataCenter
- 11.2.4.1. Overview
- 11.2.4.2. Products
- 11.2.4.3. SWOT Analysis
- 11.2.4.4. Recent Developments
- 11.2.4.5. Financials (Based on Availability)
- 11.2.5 Green Mountain AS (Azrieli Group)
- 11.2.5.1. Overview
- 11.2.5.2. Products
- 11.2.5.3. SWOT Analysis
- 11.2.5.4. Recent Developments
- 11.2.5.5. Financials (Based on Availability)
- 11.2.6 Interxion (Digital Realty Trust Inc )
- 11.2.6.1. Overview
- 11.2.6.2. Products
- 11.2.6.3. SWOT Analysis
- 11.2.6.4. Recent Developments
- 11.2.6.5. Financials (Based on Availability)
- 11.2.7 Equinix Inc
- 11.2.7.1. Overview
- 11.2.7.2. Products
- 11.2.7.3. SWOT Analysis
- 11.2.7.4. Recent Developments
- 11.2.7.5. Financials (Based on Availability)
- 11.2.8 Bahnhof
- 11.2.8.1. Overview
- 11.2.8.2. Products
- 11.2.8.3. SWOT Analysis
- 11.2.8.4. Recent Developments
- 11.2.8.5. Financials (Based on Availability)
- 11.2.9 Lefdal Mine Data center
- 11.2.9.1. Overview
- 11.2.9.2. Products
- 11.2.9.3. SWOT Analysis
- 11.2.9.4. Recent Developments
- 11.2.9.5. Financials (Based on Availability)
- 11.2.10 Global Connect
- 11.2.10.1. Overview
- 11.2.10.2. Products
- 11.2.10.3. SWOT Analysis
- 11.2.10.4. Recent Developments
- 11.2.10.5. Financials (Based on Availability)
- 11.2.11 Bulk Infrastructure Group AS
- 11.2.11.1. Overview
- 11.2.11.2. Products
- 11.2.11.3. SWOT Analysis
- 11.2.11.4. Recent Developments
- 11.2.11.5. Financials (Based on Availability)
- 11.2.12 New Mining6 4 List of Company Studie
- 11.2.12.1. Overview
- 11.2.12.2. Products
- 11.2.12.3. SWOT Analysis
- 11.2.12.4. Recent Developments
- 11.2.12.5. Financials (Based on Availability)
- 11.2.1 Stack Infrastructure Inc
List of Figures
- Figure 1: Global Nordic Data Center Market Revenue Breakdown (Million, %) by Region 2024 & 2032
- Figure 2: Global Nordic Data Center Market Volume Breakdown (Billion, %) by Region 2024 & 2032
- Figure 3: North America Nordic Data Center Market Revenue (Million), by Data Center Size 2024 & 2032
- Figure 4: North America Nordic Data Center Market Volume (Billion), by Data Center Size 2024 & 2032
- Figure 5: North America Nordic Data Center Market Revenue Share (%), by Data Center Size 2024 & 2032
- Figure 6: North America Nordic Data Center Market Volume Share (%), by Data Center Size 2024 & 2032
- Figure 7: North America Nordic Data Center Market Revenue (Million), by Tier Type 2024 & 2032
- Figure 8: North America Nordic Data Center Market Volume (Billion), by Tier Type 2024 & 2032
- Figure 9: North America Nordic Data Center Market Revenue Share (%), by Tier Type 2024 & 2032
- Figure 10: North America Nordic Data Center Market Volume Share (%), by Tier Type 2024 & 2032
- Figure 11: North America Nordic Data Center Market Revenue (Million), by Absorption 2024 & 2032
- Figure 12: North America Nordic Data Center Market Volume (Billion), by Absorption 2024 & 2032
- Figure 13: North America Nordic Data Center Market Revenue Share (%), by Absorption 2024 & 2032
- Figure 14: North America Nordic Data Center Market Volume Share (%), by Absorption 2024 & 2032
- Figure 15: North America Nordic Data Center Market Revenue (Million), by Country 2024 & 2032
- Figure 16: North America Nordic Data Center Market Volume (Billion), by Country 2024 & 2032
- Figure 17: North America Nordic Data Center Market Revenue Share (%), by Country 2024 & 2032
- Figure 18: North America Nordic Data Center Market Volume Share (%), by Country 2024 & 2032
- Figure 19: South America Nordic Data Center Market Revenue (Million), by Data Center Size 2024 & 2032
- Figure 20: South America Nordic Data Center Market Volume (Billion), by Data Center Size 2024 & 2032
- Figure 21: South America Nordic Data Center Market Revenue Share (%), by Data Center Size 2024 & 2032
- Figure 22: South America Nordic Data Center Market Volume Share (%), by Data Center Size 2024 & 2032
- Figure 23: South America Nordic Data Center Market Revenue (Million), by Tier Type 2024 & 2032
- Figure 24: South America Nordic Data Center Market Volume (Billion), by Tier Type 2024 & 2032
- Figure 25: South America Nordic Data Center Market Revenue Share (%), by Tier Type 2024 & 2032
- Figure 26: South America Nordic Data Center Market Volume Share (%), by Tier Type 2024 & 2032
- Figure 27: South America Nordic Data Center Market Revenue (Million), by Absorption 2024 & 2032
- Figure 28: South America Nordic Data Center Market Volume (Billion), by Absorption 2024 & 2032
- Figure 29: South America Nordic Data Center Market Revenue Share (%), by Absorption 2024 & 2032
- Figure 30: South America Nordic Data Center Market Volume Share (%), by Absorption 2024 & 2032
- Figure 31: South America Nordic Data Center Market Revenue (Million), by Country 2024 & 2032
- Figure 32: South America Nordic Data Center Market Volume (Billion), by Country 2024 & 2032
- Figure 33: South America Nordic Data Center Market Revenue Share (%), by Country 2024 & 2032
- Figure 34: South America Nordic Data Center Market Volume Share (%), by Country 2024 & 2032
- Figure 35: Europe Nordic Data Center Market Revenue (Million), by Data Center Size 2024 & 2032
- Figure 36: Europe Nordic Data Center Market Volume (Billion), by Data Center Size 2024 & 2032
- Figure 37: Europe Nordic Data Center Market Revenue Share (%), by Data Center Size 2024 & 2032
- Figure 38: Europe Nordic Data Center Market Volume Share (%), by Data Center Size 2024 & 2032
- Figure 39: Europe Nordic Data Center Market Revenue (Million), by Tier Type 2024 & 2032
- Figure 40: Europe Nordic Data Center Market Volume (Billion), by Tier Type 2024 & 2032
- Figure 41: Europe Nordic Data Center Market Revenue Share (%), by Tier Type 2024 & 2032
- Figure 42: Europe Nordic Data Center Market Volume Share (%), by Tier Type 2024 & 2032
- Figure 43: Europe Nordic Data Center Market Revenue (Million), by Absorption 2024 & 2032
- Figure 44: Europe Nordic Data Center Market Volume (Billion), by Absorption 2024 & 2032
- Figure 45: Europe Nordic Data Center Market Revenue Share (%), by Absorption 2024 & 2032
- Figure 46: Europe Nordic Data Center Market Volume Share (%), by Absorption 2024 & 2032
- Figure 47: Europe Nordic Data Center Market Revenue (Million), by Country 2024 & 2032
- Figure 48: Europe Nordic Data Center Market Volume (Billion), by Country 2024 & 2032
- Figure 49: Europe Nordic Data Center Market Revenue Share (%), by Country 2024 & 2032
- Figure 50: Europe Nordic Data Center Market Volume Share (%), by Country 2024 & 2032
- Figure 51: Middle East & Africa Nordic Data Center Market Revenue (Million), by Data Center Size 2024 & 2032
- Figure 52: Middle East & Africa Nordic Data Center Market Volume (Billion), by Data Center Size 2024 & 2032
- Figure 53: Middle East & Africa Nordic Data Center Market Revenue Share (%), by Data Center Size 2024 & 2032
- Figure 54: Middle East & Africa Nordic Data Center Market Volume Share (%), by Data Center Size 2024 & 2032
- Figure 55: Middle East & Africa Nordic Data Center Market Revenue (Million), by Tier Type 2024 & 2032
- Figure 56: Middle East & Africa Nordic Data Center Market Volume (Billion), by Tier Type 2024 & 2032
- Figure 57: Middle East & Africa Nordic Data Center Market Revenue Share (%), by Tier Type 2024 & 2032
- Figure 58: Middle East & Africa Nordic Data Center Market Volume Share (%), by Tier Type 2024 & 2032
- Figure 59: Middle East & Africa Nordic Data Center Market Revenue (Million), by Absorption 2024 & 2032
- Figure 60: Middle East & Africa Nordic Data Center Market Volume (Billion), by Absorption 2024 & 2032
- Figure 61: Middle East & Africa Nordic Data Center Market Revenue Share (%), by Absorption 2024 & 2032
- Figure 62: Middle East & Africa Nordic Data Center Market Volume Share (%), by Absorption 2024 & 2032
- Figure 63: Middle East & Africa Nordic Data Center Market Revenue (Million), by Country 2024 & 2032
- Figure 64: Middle East & Africa Nordic Data Center Market Volume (Billion), by Country 2024 & 2032
- Figure 65: Middle East & Africa Nordic Data Center Market Revenue Share (%), by Country 2024 & 2032
- Figure 66: Middle East & Africa Nordic Data Center Market Volume Share (%), by Country 2024 & 2032
- Figure 67: Asia Pacific Nordic Data Center Market Revenue (Million), by Data Center Size 2024 & 2032
- Figure 68: Asia Pacific Nordic Data Center Market Volume (Billion), by Data Center Size 2024 & 2032
- Figure 69: Asia Pacific Nordic Data Center Market Revenue Share (%), by Data Center Size 2024 & 2032
- Figure 70: Asia Pacific Nordic Data Center Market Volume Share (%), by Data Center Size 2024 & 2032
- Figure 71: Asia Pacific Nordic Data Center Market Revenue (Million), by Tier Type 2024 & 2032
- Figure 72: Asia Pacific Nordic Data Center Market Volume (Billion), by Tier Type 2024 & 2032
- Figure 73: Asia Pacific Nordic Data Center Market Revenue Share (%), by Tier Type 2024 & 2032
- Figure 74: Asia Pacific Nordic Data Center Market Volume Share (%), by Tier Type 2024 & 2032
- Figure 75: Asia Pacific Nordic Data Center Market Revenue (Million), by Absorption 2024 & 2032
- Figure 76: Asia Pacific Nordic Data Center Market Volume (Billion), by Absorption 2024 & 2032
- Figure 77: Asia Pacific Nordic Data Center Market Revenue Share (%), by Absorption 2024 & 2032
- Figure 78: Asia Pacific Nordic Data Center Market Volume Share (%), by Absorption 2024 & 2032
- Figure 79: Asia Pacific Nordic Data Center Market Revenue (Million), by Country 2024 & 2032
- Figure 80: Asia Pacific Nordic Data Center Market Volume (Billion), by Country 2024 & 2032
- Figure 81: Asia Pacific Nordic Data Center Market Revenue Share (%), by Country 2024 & 2032
- Figure 82: Asia Pacific Nordic Data Center Market Volume Share (%), by Country 2024 & 2032
List of Tables
- Table 1: Global Nordic Data Center Market Revenue Million Forecast, by Region 2019 & 2032
- Table 2: Global Nordic Data Center Market Volume Billion Forecast, by Region 2019 & 2032
- Table 3: Global Nordic Data Center Market Revenue Million Forecast, by Data Center Size 2019 & 2032
- Table 4: Global Nordic Data Center Market Volume Billion Forecast, by Data Center Size 2019 & 2032
- Table 5: Global Nordic Data Center Market Revenue Million Forecast, by Tier Type 2019 & 2032
- Table 6: Global Nordic Data Center Market Volume Billion Forecast, by Tier Type 2019 & 2032
- Table 7: Global Nordic Data Center Market Revenue Million Forecast, by Absorption 2019 & 2032
- Table 8: Global Nordic Data Center Market Volume Billion Forecast, by Absorption 2019 & 2032
- Table 9: Global Nordic Data Center Market Revenue Million Forecast, by Region 2019 & 2032
- Table 10: Global Nordic Data Center Market Volume Billion Forecast, by Region 2019 & 2032
- Table 11: Global Nordic Data Center Market Revenue Million Forecast, by Data Center Size 2019 & 2032
- Table 12: Global Nordic Data Center Market Volume Billion Forecast, by Data Center Size 2019 & 2032
- Table 13: Global Nordic Data Center Market Revenue Million Forecast, by Tier Type 2019 & 2032
- Table 14: Global Nordic Data Center Market Volume Billion Forecast, by Tier Type 2019 & 2032
- Table 15: Global Nordic Data Center Market Revenue Million Forecast, by Absorption 2019 & 2032
- Table 16: Global Nordic Data Center Market Volume Billion Forecast, by Absorption 2019 & 2032
- Table 17: Global Nordic Data Center Market Revenue Million Forecast, by Country 2019 & 2032
- Table 18: Global Nordic Data Center Market Volume Billion Forecast, by Country 2019 & 2032
- Table 19: United States Nordic Data Center Market Revenue (Million) Forecast, by Application 2019 & 2032
- Table 20: United States Nordic Data Center Market Volume (Billion) Forecast, by Application 2019 & 2032
- Table 21: Canada Nordic Data Center Market Revenue (Million) Forecast, by Application 2019 & 2032
- Table 22: Canada Nordic Data Center Market Volume (Billion) Forecast, by Application 2019 & 2032
- Table 23: Mexico Nordic Data Center Market Revenue (Million) Forecast, by Application 2019 & 2032
- Table 24: Mexico Nordic Data Center Market Volume (Billion) Forecast, by Application 2019 & 2032
- Table 25: Global Nordic Data Center Market Revenue Million Forecast, by Data Center Size 2019 & 2032
- Table 26: Global Nordic Data Center Market Volume Billion Forecast, by Data Center Size 2019 & 2032
- Table 27: Global Nordic Data Center Market Revenue Million Forecast, by Tier Type 2019 & 2032
- Table 28: Global Nordic Data Center Market Volume Billion Forecast, by Tier Type 2019 & 2032
- Table 29: Global Nordic Data Center Market Revenue Million Forecast, by Absorption 2019 & 2032
- Table 30: Global Nordic Data Center Market Volume Billion Forecast, by Absorption 2019 & 2032
- Table 31: Global Nordic Data Center Market Revenue Million Forecast, by Country 2019 & 2032
- Table 32: Global Nordic Data Center Market Volume Billion Forecast, by Country 2019 & 2032
- Table 33: Brazil Nordic Data Center Market Revenue (Million) Forecast, by Application 2019 & 2032
- Table 34: Brazil Nordic Data Center Market Volume (Billion) Forecast, by Application 2019 & 2032
- Table 35: Argentina Nordic Data Center Market Revenue (Million) Forecast, by Application 2019 & 2032
- Table 36: Argentina Nordic Data Center Market Volume (Billion) Forecast, by Application 2019 & 2032
- Table 37: Rest of South America Nordic Data Center Market Revenue (Million) Forecast, by Application 2019 & 2032
- Table 38: Rest of South America Nordic Data Center Market Volume (Billion) Forecast, by Application 2019 & 2032
- Table 39: Global Nordic Data Center Market Revenue Million Forecast, by Data Center Size 2019 & 2032
- Table 40: Global Nordic Data Center Market Volume Billion Forecast, by Data Center Size 2019 & 2032
- Table 41: Global Nordic Data Center Market Revenue Million Forecast, by Tier Type 2019 & 2032
- Table 42: Global Nordic Data Center Market Volume Billion Forecast, by Tier Type 2019 & 2032
- Table 43: Global Nordic Data Center Market Revenue Million Forecast, by Absorption 2019 & 2032
- Table 44: Global Nordic Data Center Market Volume Billion Forecast, by Absorption 2019 & 2032
- Table 45: Global Nordic Data Center Market Revenue Million Forecast, by Country 2019 & 2032
- Table 46: Global Nordic Data Center Market Volume Billion Forecast, by Country 2019 & 2032
- Table 47: United Kingdom Nordic Data Center Market Revenue (Million) Forecast, by Application 2019 & 2032
- Table 48: United Kingdom Nordic Data Center Market Volume (Billion) Forecast, by Application 2019 & 2032
- Table 49: Germany Nordic Data Center Market Revenue (Million) Forecast, by Application 2019 & 2032
- Table 50: Germany Nordic Data Center Market Volume (Billion) Forecast, by Application 2019 & 2032
- Table 51: France Nordic Data Center Market Revenue (Million) Forecast, by Application 2019 & 2032
- Table 52: France Nordic Data Center Market Volume (Billion) Forecast, by Application 2019 & 2032
- Table 53: Italy Nordic Data Center Market Revenue (Million) Forecast, by Application 2019 & 2032
- Table 54: Italy Nordic Data Center Market Volume (Billion) Forecast, by Application 2019 & 2032
- Table 55: Spain Nordic Data Center Market Revenue (Million) Forecast, by Application 2019 & 2032
- Table 56: Spain Nordic Data Center Market Volume (Billion) Forecast, by Application 2019 & 2032
- Table 57: Russia Nordic Data Center Market Revenue (Million) Forecast, by Application 2019 & 2032
- Table 58: Russia Nordic Data Center Market Volume (Billion) Forecast, by Application 2019 & 2032
- Table 59: Benelux Nordic Data Center Market Revenue (Million) Forecast, by Application 2019 & 2032
- Table 60: Benelux Nordic Data Center Market Volume (Billion) Forecast, by Application 2019 & 2032
- Table 61: Nordics Nordic Data Center Market Revenue (Million) Forecast, by Application 2019 & 2032
- Table 62: Nordics Nordic Data Center Market Volume (Billion) Forecast, by Application 2019 & 2032
- Table 63: Rest of Europe Nordic Data Center Market Revenue (Million) Forecast, by Application 2019 & 2032
- Table 64: Rest of Europe Nordic Data Center Market Volume (Billion) Forecast, by Application 2019 & 2032
- Table 65: Global Nordic Data Center Market Revenue Million Forecast, by Data Center Size 2019 & 2032
- Table 66: Global Nordic Data Center Market Volume Billion Forecast, by Data Center Size 2019 & 2032
- Table 67: Global Nordic Data Center Market Revenue Million Forecast, by Tier Type 2019 & 2032
- Table 68: Global Nordic Data Center Market Volume Billion Forecast, by Tier Type 2019 & 2032
- Table 69: Global Nordic Data Center Market Revenue Million Forecast, by Absorption 2019 & 2032
- Table 70: Global Nordic Data Center Market Volume Billion Forecast, by Absorption 2019 & 2032
- Table 71: Global Nordic Data Center Market Revenue Million Forecast, by Country 2019 & 2032
- Table 72: Global Nordic Data Center Market Volume Billion Forecast, by Country 2019 & 2032
- Table 73: Turkey Nordic Data Center Market Revenue (Million) Forecast, by Application 2019 & 2032
- Table 74: Turkey Nordic Data Center Market Volume (Billion) Forecast, by Application 2019 & 2032
- Table 75: Israel Nordic Data Center Market Revenue (Million) Forecast, by Application 2019 & 2032
- Table 76: Israel Nordic Data Center Market Volume (Billion) Forecast, by Application 2019 & 2032
- Table 77: GCC Nordic Data Center Market Revenue (Million) Forecast, by Application 2019 & 2032
- Table 78: GCC Nordic Data Center Market Volume (Billion) Forecast, by Application 2019 & 2032
- Table 79: North Africa Nordic Data Center Market Revenue (Million) Forecast, by Application 2019 & 2032
- Table 80: North Africa Nordic Data Center Market Volume (Billion) Forecast, by Application 2019 & 2032
- Table 81: South Africa Nordic Data Center Market Revenue (Million) Forecast, by Application 2019 & 2032
- Table 82: South Africa Nordic Data Center Market Volume (Billion) Forecast, by Application 2019 & 2032
- Table 83: Rest of Middle East & Africa Nordic Data Center Market Revenue (Million) Forecast, by Application 2019 & 2032
- Table 84: Rest of Middle East & Africa Nordic Data Center Market Volume (Billion) Forecast, by Application 2019 & 2032
- Table 85: Global Nordic Data Center Market Revenue Million Forecast, by Data Center Size 2019 & 2032
- Table 86: Global Nordic Data Center Market Volume Billion Forecast, by Data Center Size 2019 & 2032
- Table 87: Global Nordic Data Center Market Revenue Million Forecast, by Tier Type 2019 & 2032
- Table 88: Global Nordic Data Center Market Volume Billion Forecast, by Tier Type 2019 & 2032
- Table 89: Global Nordic Data Center Market Revenue Million Forecast, by Absorption 2019 & 2032
- Table 90: Global Nordic Data Center Market Volume Billion Forecast, by Absorption 2019 & 2032
- Table 91: Global Nordic Data Center Market Revenue Million Forecast, by Country 2019 & 2032
- Table 92: Global Nordic Data Center Market Volume Billion Forecast, by Country 2019 & 2032
- Table 93: China Nordic Data Center Market Revenue (Million) Forecast, by Application 2019 & 2032
- Table 94: China Nordic Data Center Market Volume (Billion) Forecast, by Application 2019 & 2032
- Table 95: India Nordic Data Center Market Revenue (Million) Forecast, by Application 2019 & 2032
- Table 96: India Nordic Data Center Market Volume (Billion) Forecast, by Application 2019 & 2032
- Table 97: Japan Nordic Data Center Market Revenue (Million) Forecast, by Application 2019 & 2032
- Table 98: Japan Nordic Data Center Market Volume (Billion) Forecast, by Application 2019 & 2032
- Table 99: South Korea Nordic Data Center Market Revenue (Million) Forecast, by Application 2019 & 2032
- Table 100: South Korea Nordic Data Center Market Volume (Billion) Forecast, by Application 2019 & 2032
- Table 101: ASEAN Nordic Data Center Market Revenue (Million) Forecast, by Application 2019 & 2032
- Table 102: ASEAN Nordic Data Center Market Volume (Billion) Forecast, by Application 2019 & 2032
- Table 103: Oceania Nordic Data Center Market Revenue (Million) Forecast, by Application 2019 & 2032
- Table 104: Oceania Nordic Data Center Market Volume (Billion) Forecast, by Application 2019 & 2032
- Table 105: Rest of Asia Pacific Nordic Data Center Market Revenue (Million) Forecast, by Application 2019 & 2032
- Table 106: Rest of Asia Pacific Nordic Data Center Market Volume (Billion) Forecast, by Application 2019 & 2032
Frequently Asked Questions
1. What is the projected Compound Annual Growth Rate (CAGR) of the Nordic Data Center Market?
The projected CAGR is approximately 8.39%.
2. Which companies are prominent players in the Nordic Data Center Market?
Key companies in the market include Stack Infrastructure Inc, atNorth, Verne Global, EcoDataCenter, Green Mountain AS (Azrieli Group), Interxion (Digital Realty Trust Inc ), Equinix Inc, Bahnhof, Lefdal Mine Data center, Global Connect, Bulk Infrastructure Group AS, New Mining6 4 List of Company Studie.
3. What are the main segments of the Nordic Data Center Market?
The market segments include Data Center Size, Tier Type, Absorption.
4. Can you provide details about the market size?
The market size is estimated to be USD 1.22 Million as of 2022.
5. What are some drivers contributing to market growth?
N/A
6. What are the notable trends driving market growth?
Tier 3 Data Center Dominates the Market. while Tier 4 Growing the Fastest.
7. Are there any restraints impacting market growth?
N/A
8. Can you provide examples of recent developments in the market?
February 2023: atNorth unveiled plans to construct a new data center in the Helsinki region of Finland, with an initial total IT capacity of 15 MW and a projected operational date of Q3 2024.
9. What pricing options are available for accessing the report?
Pricing options include single-user, multi-user, and enterprise licenses priced at USD 3800, USD 4500, and USD 5800 respectively.
10. Is the market size provided in terms of value or volume?
The market size is provided in terms of value, measured in Million and volume, measured in Billion.
11. Are there any specific market keywords associated with the report?
Yes, the market keyword associated with the report is "Nordic Data Center Market," which aids in identifying and referencing the specific market segment covered.
12. How do I determine which pricing option suits my needs best?
The pricing options vary based on user requirements and access needs. Individual users may opt for single-user licenses, while businesses requiring broader access may choose multi-user or enterprise licenses for cost-effective access to the report.
13. Are there any additional resources or data provided in the Nordic Data Center Market report?
While the report offers comprehensive insights, it's advisable to review the specific contents or supplementary materials provided to ascertain if additional resources or data are available.
14. How can I stay updated on further developments or reports in the Nordic Data Center Market?
To stay informed about further developments, trends, and reports in the Nordic Data Center Market, consider subscribing to industry newsletters, following relevant companies and organizations, or regularly checking reputable industry news sources and publications.
Methodology
Step 1 - Identification of Relevant Samples Size from Population Database


Step 2 - Approaches for Defining Global Market Size (Value, Volume* & Price*)

Note*: In applicable scenarios
Step 3 - Data Sources
Primary Research
- Web Analytics
- Survey Reports
- Research Institute
- Latest Research Reports
- Opinion Leaders
Secondary Research
- Annual Reports
- White Paper
- Latest Press Release
- Industry Association
- Paid Database
- Investor Presentations

Step 4 - Data Triangulation
Involves using different sources of information in order to increase the validity of a study
These sources are likely to be stakeholders in a program - participants, other researchers, program staff, other community members, and so on.
Then we put all data in single framework & apply various statistical tools to find out the dynamic on the market.
During the analysis stage, feedback from the stakeholder groups would be compared to determine areas of agreement as well as areas of divergence


