
Key Insights
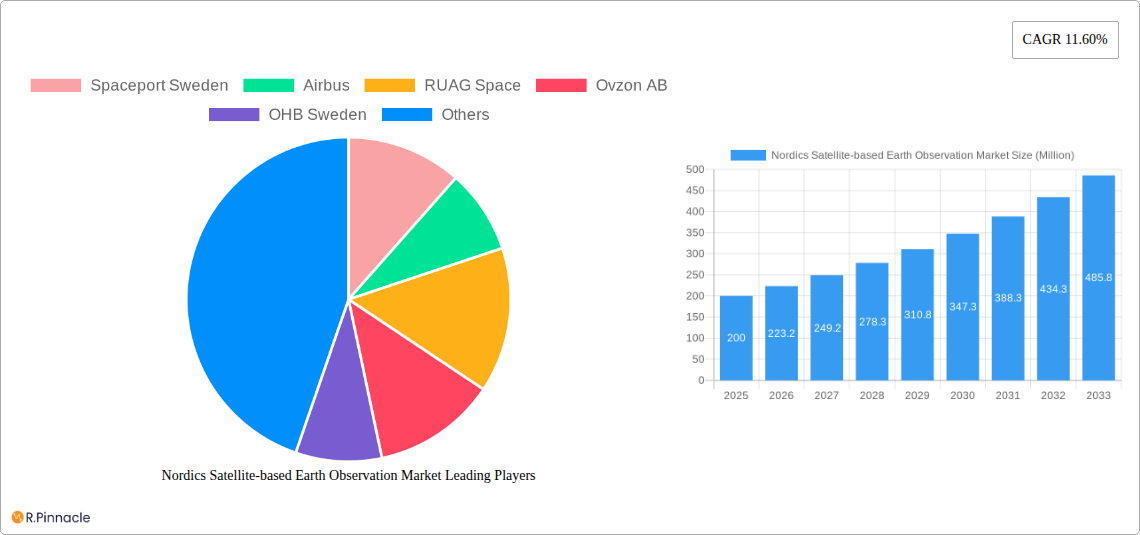
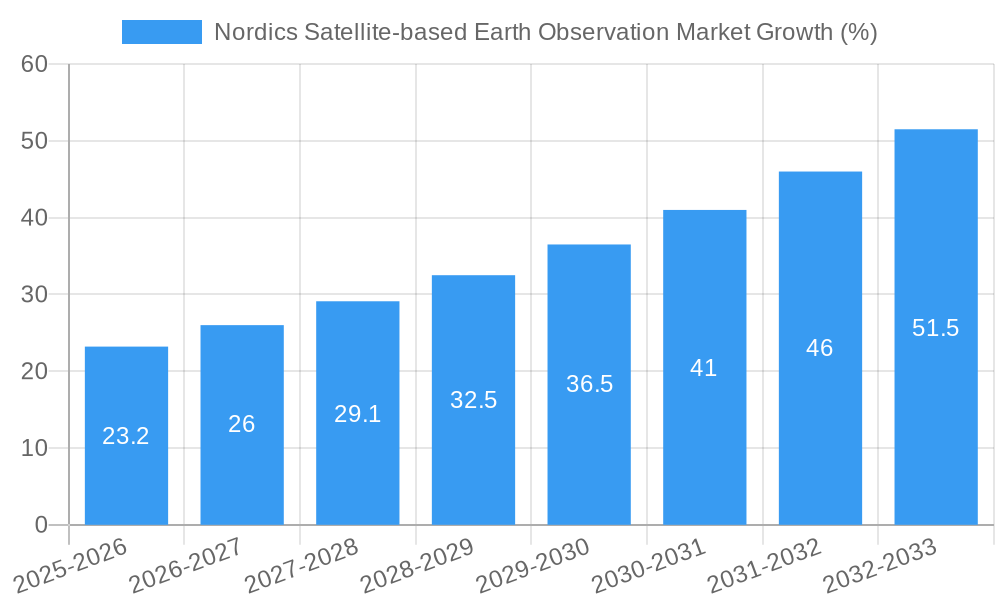
The Nordics satellite-based Earth observation market is experiencing robust growth, driven by increasing government investments in infrastructure development, a surge in demand for precise agricultural data, and the rising adoption of satellite imagery for environmental monitoring and climate change mitigation. The region's strong technological capabilities and the presence of key players like Spaceport Sweden, Airbus, and OHB Sweden contribute significantly to this market expansion. The market is segmented by type (Earth Observation Data and Value-Added Services), satellite orbit (Low Earth Orbit, Medium Earth Orbit, and Geostationary Orbit), and end-use sectors (Urban Development and Cultural Heritage, Agriculture, Climate Services, Energy and Raw Materials, and Infrastructure). While precise market sizing data for the Nordics is unavailable, considering the global CAGR of 11.60% and the region's advanced technological landscape, a conservative estimate places the 2025 market size at approximately €200 million. This figure is projected to experience substantial growth, exceeding €500 million by 2033, fueled by the escalating adoption of satellite data across various sectors. The strong focus on sustainability and the proactive approach towards technological innovation within the Nordics further bolsters the market's optimistic outlook.
A key trend shaping the market is the increasing demand for high-resolution imagery and advanced analytical services. This necessitates significant investment in advanced satellite technologies and data processing capabilities. Potential restraints include the high initial investment costs associated with satellite technology and data acquisition, alongside the need for skilled professionals to interpret and utilize the complex data sets generated. Nonetheless, the benefits offered by satellite-based Earth observation—improved decision-making across various sectors, enhanced operational efficiency, and contributions towards sustainable development—are expected to outweigh these challenges, driving continued market expansion throughout the forecast period. The competition is relatively concentrated, with major players focused on expanding their service offerings and strengthening partnerships to gain a larger market share.
Nordics Satellite-based Earth Observation Market Report: 2019-2033
This comprehensive report provides a detailed analysis of the Nordics satellite-based Earth observation market, offering invaluable insights for industry professionals, investors, and strategists. The study period covers 2019-2033, with a base year of 2025 and a forecast period of 2025-2033. The market is segmented by type (Earth Observation Data, Value-Added Services), satellite orbit (Low Earth Orbit, Medium Earth Orbit, Geostationary Orbit), and end-use (Urban Development & Cultural Heritage, Agriculture, Climate Services, Energy & Raw Materials, Infrastructure, Other). Key players such as Spaceport Sweden, Airbus, RUAG Space, Ovzon AB, OHB Sweden, Thales, Satlentis, Spacemetric, TerraNIS, and AndoyaSpace are analyzed, revealing market dynamics and future opportunities.
Nordics Satellite-based Earth Observation Market Structure & Innovation Trends
The Nordics satellite-based Earth observation market exhibits a moderately concentrated structure, with a few major players holding significant market share. Airbus and OHB Sweden, for example, are likely to hold substantial shares due to their established presence and extensive portfolios. However, smaller specialized companies such as Satlentis and Spacemetric are also contributing significantly through niche applications and innovative solutions. This blend fosters both competition and collaboration. Innovation is driven by advancements in sensor technology, increased demand for high-resolution imagery, and the development of value-added services like data analytics and predictive modeling. The regulatory framework within the Nordics generally supports the industry's growth. While the market experiences some substitution from alternative data sources like aerial photography, the unique capabilities and coverage of satellite-based solutions maintain a strong market position. Consolidation through M&A activities, with deal values estimated at xx Million in recent years, is expected to continue, shaping the market landscape.
- Market Concentration: Moderately concentrated, with larger players dominating but significant presence of smaller, specialized companies.
- Innovation Drivers: Sensor technology advancements, demand for high-resolution imagery, data analytics.
- M&A Activity: xx Million in recent years; further consolidation expected.
- Regulatory Framework: Supportive of market growth.
Nordics Satellite-based Earth Observation Market Dynamics & Trends
The Nordics satellite-based Earth observation market is experiencing robust growth, with a projected Compound Annual Growth Rate (CAGR) of xx% from 2025 to 2033. This growth is primarily fueled by increasing government investments in space technology, a rising need for precise environmental monitoring (particularly climate change related), and the expanding adoption of Earth observation data in various sectors. Technological advancements, such as miniaturization of satellites and improved data processing capabilities, are driving market expansion. Consumer preferences are shifting towards higher resolution imagery, real-time data access, and user-friendly data analytics tools. Competitive dynamics are characterized by both cooperation and rivalry, with companies focusing on differentiation through specialized solutions and value-added services. Market penetration in key sectors like agriculture and infrastructure is steadily increasing, with significant opportunities still available.
Dominant Regions & Segments in Nordics Satellite-based Earth Observation Market
While the entire Nordics region shows considerable promise, specific countries demonstrate stronger market performance based on their investments in space technology and the specific needs of their various sectors. For example, Norway’s establishment of a spaceport is expected to boost the sector.
By Type: The Earth Observation Data segment currently holds a larger market share due to high demand, while the Value-Added Services segment demonstrates faster growth driven by advanced analytics and tailored solutions.
By Satellite Orbit: The Low Earth Orbit (LEO) segment dominates due to its high-resolution capabilities, while Medium Earth Orbit (MEO) and Geostationary Orbit (GEO) segments are growing due to specific application requirements.
By End-Use: Agriculture, Climate Services, and Infrastructure are leading end-use segments due to significant government funding, growing environmental concerns, and demands for improved resource management. Urban Development and Cultural Heritage is another promising sector.
The dominance of specific segments is largely driven by factors such as government policies favoring environmental monitoring, robust infrastructure supporting data processing, and the availability of skilled professionals in certain areas.
Nordics Satellite-based Earth Observation Market Product Innovations
Recent product innovations in the Nordics focus on smaller, more affordable satellites equipped with advanced sensors offering higher resolution and spectral range. These developments enable real-time data acquisition and advanced data analytics, including AI-driven solutions. These innovations are tailored to meet the specific needs of various end-users, such as precise agricultural monitoring, efficient infrastructure management, and accurate climate change modeling. This targeted approach enhances market fit and provides competitive advantages for companies embracing these trends.
Report Scope & Segmentation Analysis
This report comprehensively analyzes the Nordics satellite-based Earth observation market across various segments. The By Type segment includes Earth Observation Data and Value-Added Services, each exhibiting distinct growth trajectories and competitive dynamics. The By Satellite Orbit segment encompasses Low Earth Orbit (LEO), Medium Earth Orbit (MEO), and Geostationary Orbit (GEO), with varying market sizes and future growth potential. The By End-Use segment covers Urban Development and Cultural Heritage, Agriculture, Climate Services, Energy and Raw Materials, Infrastructure, and Other, each reflecting unique market drivers and growth projections. Each segment's analysis includes growth projections, market size estimations, and a competitive landscape overview.
Key Drivers of Nordics Satellite-based Earth Observation Market Growth
Several factors fuel the growth of the Nordics satellite-based Earth observation market. Government initiatives supporting space exploration and technological advancements play a significant role. Increased awareness of environmental concerns and the growing need for precise data for effective resource management further boost market demand. Furthermore, the development of new applications, such as precision agriculture and urban planning, expands the market's scope and creates new revenue streams.
Challenges in the Nordics Satellite-based Earth Observation Market Sector
Challenges facing the market include high initial investment costs for satellite development and launch, dependence on reliable data transmission infrastructure, and the need for skilled professionals in data processing and analysis. Competitive pressures from international players and regulatory complexities related to data ownership and privacy also need careful consideration. The market faces potential supply chain disruptions affecting component availability. These challenges can impact market growth if not addressed proactively.
Emerging Opportunities in Nordics Satellite-based Earth Observation Market
New opportunities emerge from the growing demand for advanced analytics capabilities, integration of AI and machine learning in data processing, and the development of new applications within specific sectors. The rising popularity of micro-satellites and CubeSats presents opportunities for cost-effective solutions. Furthermore, partnerships between public and private sectors to leverage data for environmental monitoring and efficient resource management offer significant market potential. Exploring new markets for applications is expected to drive expansion.
Leading Players in the Nordics Satellite-based Earth Observation Market Market
- Spaceport Sweden
- Airbus
- RUAG Space
- Ovzon AB
- OHB Sweden
- Thales
- Satlentis
- Spacemetric
- TerraNIS
- AndoyaSpace
Key Developments in Nordics Satellite-based Earth Observation Market Industry
- April 2023: AndoyaSpace established a satellite launch station in Andøya, Norway, strengthening Norway's space capabilities.
- May 2023: OHB SE highlighted its involvement in key Copernicus missions (CO2M, CHIME, CIMR), Meteosat Third Generation (MTG), and EnMAP at the GLOC 2023 conference, showcasing technological advancements in climate change monitoring.
Future Outlook for Nordics Satellite-based Earth Observation Market Market
The Nordics satellite-based Earth observation market exhibits strong future potential, driven by continued technological advancements, increasing government investments, and the growing need for comprehensive data across various sectors. The market is poised for significant growth, creating opportunities for both established players and new entrants. Strategic partnerships and collaborations are likely to be pivotal in harnessing the market's full potential. Focus on innovative solutions and specialized services will be key to achieving success.
Nordics Satellite-based Earth Observation Market Segmentation
-
1. Type
- 1.1. Earth Observation Data
- 1.2. Value Added Services
-
2. Satellite Orbit
- 2.1. Low Earth Orbit
- 2.2. Medium Earth Orbit
- 2.3. Geostationary Orbit
-
3. End-Use
- 3.1. Urban Development and Cultural Heritage
- 3.2. Agriculture
- 3.3. Climate Services
- 3.4. Energy and Raw Materials
- 3.5. Infrastructure
- 3.6. Other End-Use
Nordics Satellite-based Earth Observation Market Segmentation By Geography
-
1. North America
- 1.1. United States
- 1.2. Canada
- 1.3. Mexico
-
2. South America
- 2.1. Brazil
- 2.2. Argentina
- 2.3. Rest of South America
-
3. Europe
- 3.1. United Kingdom
- 3.2. Germany
- 3.3. France
- 3.4. Italy
- 3.5. Spain
- 3.6. Russia
- 3.7. Benelux
- 3.8. Nordics
- 3.9. Rest of Europe
-
4. Middle East & Africa
- 4.1. Turkey
- 4.2. Israel
- 4.3. GCC
- 4.4. North Africa
- 4.5. South Africa
- 4.6. Rest of Middle East & Africa
-
5. Asia Pacific
- 5.1. China
- 5.2. India
- 5.3. Japan
- 5.4. South Korea
- 5.5. ASEAN
- 5.6. Oceania
- 5.7. Rest of Asia Pacific
Nordics Satellite-based Earth Observation Market REPORT HIGHLIGHTS
| Aspects | Details |
|---|---|
| Study Period | 2019-2033 |
| Base Year | 2024 |
| Estimated Year | 2025 |
| Forecast Period | 2025-2033 |
| Historical Period | 2019-2024 |
| Growth Rate | CAGR of 11.60% from 2019-2033 |
| Segmentation |
|
Table of Contents
- 1. Introduction
- 1.1. Research Scope
- 1.2. Market Segmentation
- 1.3. Research Methodology
- 1.4. Definitions and Assumptions
- 2. Executive Summary
- 2.1. Introduction
- 3. Market Dynamics
- 3.1. Introduction
- 3.2. Market Drivers
- 3.2.1. Growing Requirement of Satellite Based Earth Observation in Agriculture; Increasing Demand of High-resolution Imaging Services
- 3.3. Market Restrains
- 3.3.1. Utilisation of Alternative Earth Observation Technologies is Growing
- 3.4. Market Trends
- 3.4.1. Growing Requirement of Satellite Based Earth Observation in Agriculture
- 4. Market Factor Analysis
- 4.1. Porters Five Forces
- 4.2. Supply/Value Chain
- 4.3. PESTEL analysis
- 4.4. Market Entropy
- 4.5. Patent/Trademark Analysis
- 5. Global Nordics Satellite-based Earth Observation Market Analysis, Insights and Forecast, 2019-2031
- 5.1. Market Analysis, Insights and Forecast - by Type
- 5.1.1. Earth Observation Data
- 5.1.2. Value Added Services
- 5.2. Market Analysis, Insights and Forecast - by Satellite Orbit
- 5.2.1. Low Earth Orbit
- 5.2.2. Medium Earth Orbit
- 5.2.3. Geostationary Orbit
- 5.3. Market Analysis, Insights and Forecast - by End-Use
- 5.3.1. Urban Development and Cultural Heritage
- 5.3.2. Agriculture
- 5.3.3. Climate Services
- 5.3.4. Energy and Raw Materials
- 5.3.5. Infrastructure
- 5.3.6. Other End-Use
- 5.4. Market Analysis, Insights and Forecast - by Region
- 5.4.1. North America
- 5.4.2. South America
- 5.4.3. Europe
- 5.4.4. Middle East & Africa
- 5.4.5. Asia Pacific
- 5.1. Market Analysis, Insights and Forecast - by Type
- 6. North America Nordics Satellite-based Earth Observation Market Analysis, Insights and Forecast, 2019-2031
- 6.1. Market Analysis, Insights and Forecast - by Type
- 6.1.1. Earth Observation Data
- 6.1.2. Value Added Services
- 6.2. Market Analysis, Insights and Forecast - by Satellite Orbit
- 6.2.1. Low Earth Orbit
- 6.2.2. Medium Earth Orbit
- 6.2.3. Geostationary Orbit
- 6.3. Market Analysis, Insights and Forecast - by End-Use
- 6.3.1. Urban Development and Cultural Heritage
- 6.3.2. Agriculture
- 6.3.3. Climate Services
- 6.3.4. Energy and Raw Materials
- 6.3.5. Infrastructure
- 6.3.6. Other End-Use
- 6.1. Market Analysis, Insights and Forecast - by Type
- 7. South America Nordics Satellite-based Earth Observation Market Analysis, Insights and Forecast, 2019-2031
- 7.1. Market Analysis, Insights and Forecast - by Type
- 7.1.1. Earth Observation Data
- 7.1.2. Value Added Services
- 7.2. Market Analysis, Insights and Forecast - by Satellite Orbit
- 7.2.1. Low Earth Orbit
- 7.2.2. Medium Earth Orbit
- 7.2.3. Geostationary Orbit
- 7.3. Market Analysis, Insights and Forecast - by End-Use
- 7.3.1. Urban Development and Cultural Heritage
- 7.3.2. Agriculture
- 7.3.3. Climate Services
- 7.3.4. Energy and Raw Materials
- 7.3.5. Infrastructure
- 7.3.6. Other End-Use
- 7.1. Market Analysis, Insights and Forecast - by Type
- 8. Europe Nordics Satellite-based Earth Observation Market Analysis, Insights and Forecast, 2019-2031
- 8.1. Market Analysis, Insights and Forecast - by Type
- 8.1.1. Earth Observation Data
- 8.1.2. Value Added Services
- 8.2. Market Analysis, Insights and Forecast - by Satellite Orbit
- 8.2.1. Low Earth Orbit
- 8.2.2. Medium Earth Orbit
- 8.2.3. Geostationary Orbit
- 8.3. Market Analysis, Insights and Forecast - by End-Use
- 8.3.1. Urban Development and Cultural Heritage
- 8.3.2. Agriculture
- 8.3.3. Climate Services
- 8.3.4. Energy and Raw Materials
- 8.3.5. Infrastructure
- 8.3.6. Other End-Use
- 8.1. Market Analysis, Insights and Forecast - by Type
- 9. Middle East & Africa Nordics Satellite-based Earth Observation Market Analysis, Insights and Forecast, 2019-2031
- 9.1. Market Analysis, Insights and Forecast - by Type
- 9.1.1. Earth Observation Data
- 9.1.2. Value Added Services
- 9.2. Market Analysis, Insights and Forecast - by Satellite Orbit
- 9.2.1. Low Earth Orbit
- 9.2.2. Medium Earth Orbit
- 9.2.3. Geostationary Orbit
- 9.3. Market Analysis, Insights and Forecast - by End-Use
- 9.3.1. Urban Development and Cultural Heritage
- 9.3.2. Agriculture
- 9.3.3. Climate Services
- 9.3.4. Energy and Raw Materials
- 9.3.5. Infrastructure
- 9.3.6. Other End-Use
- 9.1. Market Analysis, Insights and Forecast - by Type
- 10. Asia Pacific Nordics Satellite-based Earth Observation Market Analysis, Insights and Forecast, 2019-2031
- 10.1. Market Analysis, Insights and Forecast - by Type
- 10.1.1. Earth Observation Data
- 10.1.2. Value Added Services
- 10.2. Market Analysis, Insights and Forecast - by Satellite Orbit
- 10.2.1. Low Earth Orbit
- 10.2.2. Medium Earth Orbit
- 10.2.3. Geostationary Orbit
- 10.3. Market Analysis, Insights and Forecast - by End-Use
- 10.3.1. Urban Development and Cultural Heritage
- 10.3.2. Agriculture
- 10.3.3. Climate Services
- 10.3.4. Energy and Raw Materials
- 10.3.5. Infrastructure
- 10.3.6. Other End-Use
- 10.1. Market Analysis, Insights and Forecast - by Type
- 11. North America Nordics Satellite-based Earth Observation Market Analysis, Insights and Forecast, 2019-2031
- 11.1. Market Analysis, Insights and Forecast - By Country/Sub-region
- 11.1.1.
- 12. Europe Nordics Satellite-based Earth Observation Market Analysis, Insights and Forecast, 2019-2031
- 12.1. Market Analysis, Insights and Forecast - By Country/Sub-region
- 12.1.1.
- 13. Asia Pacific Nordics Satellite-based Earth Observation Market Analysis, Insights and Forecast, 2019-2031
- 13.1. Market Analysis, Insights and Forecast - By Country/Sub-region
- 13.1.1.
- 14. Latin America Nordics Satellite-based Earth Observation Market Analysis, Insights and Forecast, 2019-2031
- 14.1. Market Analysis, Insights and Forecast - By Country/Sub-region
- 14.1.1.
- 15. Middle East and Africa Nordics Satellite-based Earth Observation Market Analysis, Insights and Forecast, 2019-2031
- 15.1. Market Analysis, Insights and Forecast - By Country/Sub-region
- 15.1.1.
- 16. Competitive Analysis
- 16.1. Global Market Share Analysis 2024
- 16.2. Company Profiles
- 16.2.1 Spaceport Sweden
- 16.2.1.1. Overview
- 16.2.1.2. Products
- 16.2.1.3. SWOT Analysis
- 16.2.1.4. Recent Developments
- 16.2.1.5. Financials (Based on Availability)
- 16.2.2 Airbus
- 16.2.2.1. Overview
- 16.2.2.2. Products
- 16.2.2.3. SWOT Analysis
- 16.2.2.4. Recent Developments
- 16.2.2.5. Financials (Based on Availability)
- 16.2.3 RUAG Space
- 16.2.3.1. Overview
- 16.2.3.2. Products
- 16.2.3.3. SWOT Analysis
- 16.2.3.4. Recent Developments
- 16.2.3.5. Financials (Based on Availability)
- 16.2.4 Ovzon AB
- 16.2.4.1. Overview
- 16.2.4.2. Products
- 16.2.4.3. SWOT Analysis
- 16.2.4.4. Recent Developments
- 16.2.4.5. Financials (Based on Availability)
- 16.2.5 OHB Sweden
- 16.2.5.1. Overview
- 16.2.5.2. Products
- 16.2.5.3. SWOT Analysis
- 16.2.5.4. Recent Developments
- 16.2.5.5. Financials (Based on Availability)
- 16.2.6 Thales
- 16.2.6.1. Overview
- 16.2.6.2. Products
- 16.2.6.3. SWOT Analysis
- 16.2.6.4. Recent Developments
- 16.2.6.5. Financials (Based on Availability)
- 16.2.7 Satlentis
- 16.2.7.1. Overview
- 16.2.7.2. Products
- 16.2.7.3. SWOT Analysis
- 16.2.7.4. Recent Developments
- 16.2.7.5. Financials (Based on Availability)
- 16.2.8 Spacemetric
- 16.2.8.1. Overview
- 16.2.8.2. Products
- 16.2.8.3. SWOT Analysis
- 16.2.8.4. Recent Developments
- 16.2.8.5. Financials (Based on Availability)
- 16.2.9 TerraNIS
- 16.2.9.1. Overview
- 16.2.9.2. Products
- 16.2.9.3. SWOT Analysis
- 16.2.9.4. Recent Developments
- 16.2.9.5. Financials (Based on Availability)
- 16.2.10 AndoyaSpace*List Not Exhaustive 7 2 *List Not Exhaustiv
- 16.2.10.1. Overview
- 16.2.10.2. Products
- 16.2.10.3. SWOT Analysis
- 16.2.10.4. Recent Developments
- 16.2.10.5. Financials (Based on Availability)
- 16.2.1 Spaceport Sweden
List of Figures
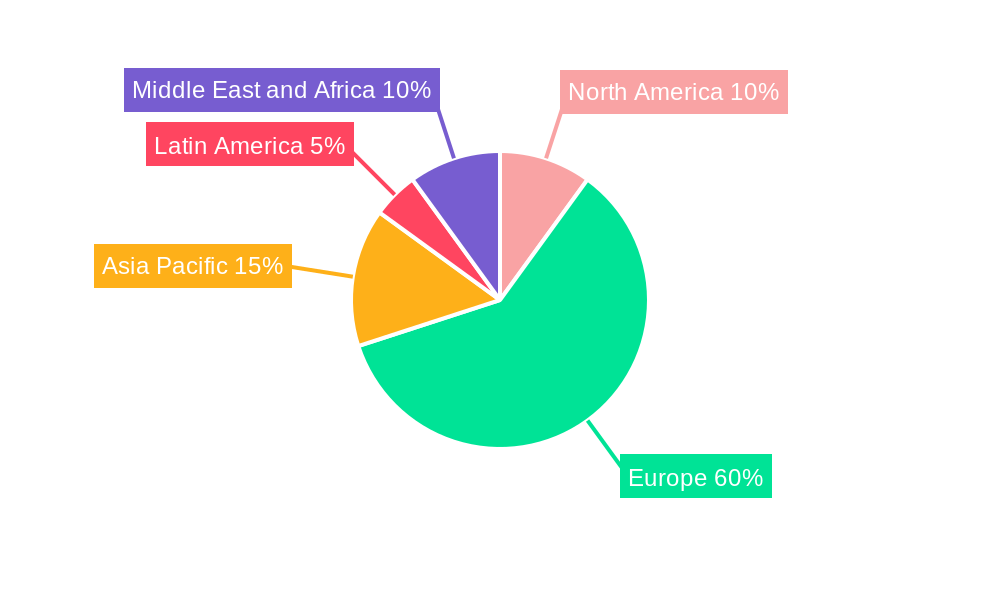
- Figure 1: Global Nordics Satellite-based Earth Observation Market Revenue Breakdown (Million, %) by Region 2024 & 2032
- Figure 2: North America Nordics Satellite-based Earth Observation Market Revenue (Million), by Country 2024 & 2032
- Figure 3: North America Nordics Satellite-based Earth Observation Market Revenue Share (%), by Country 2024 & 2032
- Figure 4: Europe Nordics Satellite-based Earth Observation Market Revenue (Million), by Country 2024 & 2032
- Figure 5: Europe Nordics Satellite-based Earth Observation Market Revenue Share (%), by Country 2024 & 2032
- Figure 6: Asia Pacific Nordics Satellite-based Earth Observation Market Revenue (Million), by Country 2024 & 2032
- Figure 7: Asia Pacific Nordics Satellite-based Earth Observation Market Revenue Share (%), by Country 2024 & 2032
- Figure 8: Latin America Nordics Satellite-based Earth Observation Market Revenue (Million), by Country 2024 & 2032
- Figure 9: Latin America Nordics Satellite-based Earth Observation Market Revenue Share (%), by Country 2024 & 2032
- Figure 10: Middle East and Africa Nordics Satellite-based Earth Observation Market Revenue (Million), by Country 2024 & 2032
- Figure 11: Middle East and Africa Nordics Satellite-based Earth Observation Market Revenue Share (%), by Country 2024 & 2032
- Figure 12: North America Nordics Satellite-based Earth Observation Market Revenue (Million), by Type 2024 & 2032
- Figure 13: North America Nordics Satellite-based Earth Observation Market Revenue Share (%), by Type 2024 & 2032
- Figure 14: North America Nordics Satellite-based Earth Observation Market Revenue (Million), by Satellite Orbit 2024 & 2032
- Figure 15: North America Nordics Satellite-based Earth Observation Market Revenue Share (%), by Satellite Orbit 2024 & 2032
- Figure 16: North America Nordics Satellite-based Earth Observation Market Revenue (Million), by End-Use 2024 & 2032
- Figure 17: North America Nordics Satellite-based Earth Observation Market Revenue Share (%), by End-Use 2024 & 2032
- Figure 18: North America Nordics Satellite-based Earth Observation Market Revenue (Million), by Country 2024 & 2032
- Figure 19: North America Nordics Satellite-based Earth Observation Market Revenue Share (%), by Country 2024 & 2032
- Figure 20: South America Nordics Satellite-based Earth Observation Market Revenue (Million), by Type 2024 & 2032
- Figure 21: South America Nordics Satellite-based Earth Observation Market Revenue Share (%), by Type 2024 & 2032
- Figure 22: South America Nordics Satellite-based Earth Observation Market Revenue (Million), by Satellite Orbit 2024 & 2032
- Figure 23: South America Nordics Satellite-based Earth Observation Market Revenue Share (%), by Satellite Orbit 2024 & 2032
- Figure 24: South America Nordics Satellite-based Earth Observation Market Revenue (Million), by End-Use 2024 & 2032
- Figure 25: South America Nordics Satellite-based Earth Observation Market Revenue Share (%), by End-Use 2024 & 2032
- Figure 26: South America Nordics Satellite-based Earth Observation Market Revenue (Million), by Country 2024 & 2032
- Figure 27: South America Nordics Satellite-based Earth Observation Market Revenue Share (%), by Country 2024 & 2032
- Figure 28: Europe Nordics Satellite-based Earth Observation Market Revenue (Million), by Type 2024 & 2032
- Figure 29: Europe Nordics Satellite-based Earth Observation Market Revenue Share (%), by Type 2024 & 2032
- Figure 30: Europe Nordics Satellite-based Earth Observation Market Revenue (Million), by Satellite Orbit 2024 & 2032
- Figure 31: Europe Nordics Satellite-based Earth Observation Market Revenue Share (%), by Satellite Orbit 2024 & 2032
- Figure 32: Europe Nordics Satellite-based Earth Observation Market Revenue (Million), by End-Use 2024 & 2032
- Figure 33: Europe Nordics Satellite-based Earth Observation Market Revenue Share (%), by End-Use 2024 & 2032
- Figure 34: Europe Nordics Satellite-based Earth Observation Market Revenue (Million), by Country 2024 & 2032
- Figure 35: Europe Nordics Satellite-based Earth Observation Market Revenue Share (%), by Country 2024 & 2032
- Figure 36: Middle East & Africa Nordics Satellite-based Earth Observation Market Revenue (Million), by Type 2024 & 2032
- Figure 37: Middle East & Africa Nordics Satellite-based Earth Observation Market Revenue Share (%), by Type 2024 & 2032
- Figure 38: Middle East & Africa Nordics Satellite-based Earth Observation Market Revenue (Million), by Satellite Orbit 2024 & 2032
- Figure 39: Middle East & Africa Nordics Satellite-based Earth Observation Market Revenue Share (%), by Satellite Orbit 2024 & 2032
- Figure 40: Middle East & Africa Nordics Satellite-based Earth Observation Market Revenue (Million), by End-Use 2024 & 2032
- Figure 41: Middle East & Africa Nordics Satellite-based Earth Observation Market Revenue Share (%), by End-Use 2024 & 2032
- Figure 42: Middle East & Africa Nordics Satellite-based Earth Observation Market Revenue (Million), by Country 2024 & 2032
- Figure 43: Middle East & Africa Nordics Satellite-based Earth Observation Market Revenue Share (%), by Country 2024 & 2032
- Figure 44: Asia Pacific Nordics Satellite-based Earth Observation Market Revenue (Million), by Type 2024 & 2032
- Figure 45: Asia Pacific Nordics Satellite-based Earth Observation Market Revenue Share (%), by Type 2024 & 2032
- Figure 46: Asia Pacific Nordics Satellite-based Earth Observation Market Revenue (Million), by Satellite Orbit 2024 & 2032
- Figure 47: Asia Pacific Nordics Satellite-based Earth Observation Market Revenue Share (%), by Satellite Orbit 2024 & 2032
- Figure 48: Asia Pacific Nordics Satellite-based Earth Observation Market Revenue (Million), by End-Use 2024 & 2032
- Figure 49: Asia Pacific Nordics Satellite-based Earth Observation Market Revenue Share (%), by End-Use 2024 & 2032
- Figure 50: Asia Pacific Nordics Satellite-based Earth Observation Market Revenue (Million), by Country 2024 & 2032
- Figure 51: Asia Pacific Nordics Satellite-based Earth Observation Market Revenue Share (%), by Country 2024 & 2032
List of Tables
- Table 1: Global Nordics Satellite-based Earth Observation Market Revenue Million Forecast, by Region 2019 & 2032
- Table 2: Global Nordics Satellite-based Earth Observation Market Revenue Million Forecast, by Type 2019 & 2032
- Table 3: Global Nordics Satellite-based Earth Observation Market Revenue Million Forecast, by Satellite Orbit 2019 & 2032
- Table 4: Global Nordics Satellite-based Earth Observation Market Revenue Million Forecast, by End-Use 2019 & 2032
- Table 5: Global Nordics Satellite-based Earth Observation Market Revenue Million Forecast, by Region 2019 & 2032
- Table 6: Global Nordics Satellite-based Earth Observation Market Revenue Million Forecast, by Country 2019 & 2032
- Table 7: Nordics Satellite-based Earth Observation Market Revenue (Million) Forecast, by Application 2019 & 2032
- Table 8: Global Nordics Satellite-based Earth Observation Market Revenue Million Forecast, by Country 2019 & 2032
- Table 9: Nordics Satellite-based Earth Observation Market Revenue (Million) Forecast, by Application 2019 & 2032
- Table 10: Global Nordics Satellite-based Earth Observation Market Revenue Million Forecast, by Country 2019 & 2032
- Table 11: Nordics Satellite-based Earth Observation Market Revenue (Million) Forecast, by Application 2019 & 2032
- Table 12: Global Nordics Satellite-based Earth Observation Market Revenue Million Forecast, by Country 2019 & 2032
- Table 13: Nordics Satellite-based Earth Observation Market Revenue (Million) Forecast, by Application 2019 & 2032
- Table 14: Global Nordics Satellite-based Earth Observation Market Revenue Million Forecast, by Country 2019 & 2032
- Table 15: Nordics Satellite-based Earth Observation Market Revenue (Million) Forecast, by Application 2019 & 2032
- Table 16: Global Nordics Satellite-based Earth Observation Market Revenue Million Forecast, by Type 2019 & 2032
- Table 17: Global Nordics Satellite-based Earth Observation Market Revenue Million Forecast, by Satellite Orbit 2019 & 2032
- Table 18: Global Nordics Satellite-based Earth Observation Market Revenue Million Forecast, by End-Use 2019 & 2032
- Table 19: Global Nordics Satellite-based Earth Observation Market Revenue Million Forecast, by Country 2019 & 2032
- Table 20: United States Nordics Satellite-based Earth Observation Market Revenue (Million) Forecast, by Application 2019 & 2032
- Table 21: Canada Nordics Satellite-based Earth Observation Market Revenue (Million) Forecast, by Application 2019 & 2032
- Table 22: Mexico Nordics Satellite-based Earth Observation Market Revenue (Million) Forecast, by Application 2019 & 2032
- Table 23: Global Nordics Satellite-based Earth Observation Market Revenue Million Forecast, by Type 2019 & 2032
- Table 24: Global Nordics Satellite-based Earth Observation Market Revenue Million Forecast, by Satellite Orbit 2019 & 2032
- Table 25: Global Nordics Satellite-based Earth Observation Market Revenue Million Forecast, by End-Use 2019 & 2032
- Table 26: Global Nordics Satellite-based Earth Observation Market Revenue Million Forecast, by Country 2019 & 2032
- Table 27: Brazil Nordics Satellite-based Earth Observation Market Revenue (Million) Forecast, by Application 2019 & 2032
- Table 28: Argentina Nordics Satellite-based Earth Observation Market Revenue (Million) Forecast, by Application 2019 & 2032
- Table 29: Rest of South America Nordics Satellite-based Earth Observation Market Revenue (Million) Forecast, by Application 2019 & 2032
- Table 30: Global Nordics Satellite-based Earth Observation Market Revenue Million Forecast, by Type 2019 & 2032
- Table 31: Global Nordics Satellite-based Earth Observation Market Revenue Million Forecast, by Satellite Orbit 2019 & 2032
- Table 32: Global Nordics Satellite-based Earth Observation Market Revenue Million Forecast, by End-Use 2019 & 2032
- Table 33: Global Nordics Satellite-based Earth Observation Market Revenue Million Forecast, by Country 2019 & 2032
- Table 34: United Kingdom Nordics Satellite-based Earth Observation Market Revenue (Million) Forecast, by Application 2019 & 2032
- Table 35: Germany Nordics Satellite-based Earth Observation Market Revenue (Million) Forecast, by Application 2019 & 2032
- Table 36: France Nordics Satellite-based Earth Observation Market Revenue (Million) Forecast, by Application 2019 & 2032
- Table 37: Italy Nordics Satellite-based Earth Observation Market Revenue (Million) Forecast, by Application 2019 & 2032
- Table 38: Spain Nordics Satellite-based Earth Observation Market Revenue (Million) Forecast, by Application 2019 & 2032
- Table 39: Russia Nordics Satellite-based Earth Observation Market Revenue (Million) Forecast, by Application 2019 & 2032
- Table 40: Benelux Nordics Satellite-based Earth Observation Market Revenue (Million) Forecast, by Application 2019 & 2032
- Table 41: Nordics Nordics Satellite-based Earth Observation Market Revenue (Million) Forecast, by Application 2019 & 2032
- Table 42: Rest of Europe Nordics Satellite-based Earth Observation Market Revenue (Million) Forecast, by Application 2019 & 2032
- Table 43: Global Nordics Satellite-based Earth Observation Market Revenue Million Forecast, by Type 2019 & 2032
- Table 44: Global Nordics Satellite-based Earth Observation Market Revenue Million Forecast, by Satellite Orbit 2019 & 2032
- Table 45: Global Nordics Satellite-based Earth Observation Market Revenue Million Forecast, by End-Use 2019 & 2032
- Table 46: Global Nordics Satellite-based Earth Observation Market Revenue Million Forecast, by Country 2019 & 2032
- Table 47: Turkey Nordics Satellite-based Earth Observation Market Revenue (Million) Forecast, by Application 2019 & 2032
- Table 48: Israel Nordics Satellite-based Earth Observation Market Revenue (Million) Forecast, by Application 2019 & 2032
- Table 49: GCC Nordics Satellite-based Earth Observation Market Revenue (Million) Forecast, by Application 2019 & 2032
- Table 50: North Africa Nordics Satellite-based Earth Observation Market Revenue (Million) Forecast, by Application 2019 & 2032
- Table 51: South Africa Nordics Satellite-based Earth Observation Market Revenue (Million) Forecast, by Application 2019 & 2032
- Table 52: Rest of Middle East & Africa Nordics Satellite-based Earth Observation Market Revenue (Million) Forecast, by Application 2019 & 2032
- Table 53: Global Nordics Satellite-based Earth Observation Market Revenue Million Forecast, by Type 2019 & 2032
- Table 54: Global Nordics Satellite-based Earth Observation Market Revenue Million Forecast, by Satellite Orbit 2019 & 2032
- Table 55: Global Nordics Satellite-based Earth Observation Market Revenue Million Forecast, by End-Use 2019 & 2032
- Table 56: Global Nordics Satellite-based Earth Observation Market Revenue Million Forecast, by Country 2019 & 2032
- Table 57: China Nordics Satellite-based Earth Observation Market Revenue (Million) Forecast, by Application 2019 & 2032
- Table 58: India Nordics Satellite-based Earth Observation Market Revenue (Million) Forecast, by Application 2019 & 2032
- Table 59: Japan Nordics Satellite-based Earth Observation Market Revenue (Million) Forecast, by Application 2019 & 2032
- Table 60: South Korea Nordics Satellite-based Earth Observation Market Revenue (Million) Forecast, by Application 2019 & 2032
- Table 61: ASEAN Nordics Satellite-based Earth Observation Market Revenue (Million) Forecast, by Application 2019 & 2032
- Table 62: Oceania Nordics Satellite-based Earth Observation Market Revenue (Million) Forecast, by Application 2019 & 2032
- Table 63: Rest of Asia Pacific Nordics Satellite-based Earth Observation Market Revenue (Million) Forecast, by Application 2019 & 2032
Frequently Asked Questions
1. What is the projected Compound Annual Growth Rate (CAGR) of the Nordics Satellite-based Earth Observation Market?
The projected CAGR is approximately 11.60%.
2. Which companies are prominent players in the Nordics Satellite-based Earth Observation Market?
Key companies in the market include Spaceport Sweden, Airbus, RUAG Space, Ovzon AB, OHB Sweden, Thales, Satlentis, Spacemetric, TerraNIS, AndoyaSpace*List Not Exhaustive 7 2 *List Not Exhaustiv.
3. What are the main segments of the Nordics Satellite-based Earth Observation Market?
The market segments include Type, Satellite Orbit, End-Use.
4. Can you provide details about the market size?
The market size is estimated to be USD XX Million as of 2022.
5. What are some drivers contributing to market growth?
Growing Requirement of Satellite Based Earth Observation in Agriculture; Increasing Demand of High-resolution Imaging Services.
6. What are the notable trends driving market growth?
Growing Requirement of Satellite Based Earth Observation in Agriculture.
7. Are there any restraints impacting market growth?
Utilisation of Alternative Earth Observation Technologies is Growing.
8. Can you provide examples of recent developments in the market?
May 2023: The inaugural "Global Space Conference on Climate Change" (GLOC 2023) was held in Norway. OHB SE highlighted its contributions to the Copernicus missions Copernicus Anthropogenic Carbon Dioxide Monitoring (CO2M), Copernicus Hyperspectral Imaging Mission for the Environment (CHIME), and Copernicus Imaging Microwave Radiometer (CIMR), as well as the Meteosat Third Generation (MTG) weather satellites and the German environmental satellite EnMAP, during this conference.
9. What pricing options are available for accessing the report?
Pricing options include single-user, multi-user, and enterprise licenses priced at USD 3800, USD 4500, and USD 5800 respectively.
10. Is the market size provided in terms of value or volume?
The market size is provided in terms of value, measured in Million.
11. Are there any specific market keywords associated with the report?
Yes, the market keyword associated with the report is "Nordics Satellite-based Earth Observation Market," which aids in identifying and referencing the specific market segment covered.
12. How do I determine which pricing option suits my needs best?
The pricing options vary based on user requirements and access needs. Individual users may opt for single-user licenses, while businesses requiring broader access may choose multi-user or enterprise licenses for cost-effective access to the report.
13. Are there any additional resources or data provided in the Nordics Satellite-based Earth Observation Market report?
While the report offers comprehensive insights, it's advisable to review the specific contents or supplementary materials provided to ascertain if additional resources or data are available.
14. How can I stay updated on further developments or reports in the Nordics Satellite-based Earth Observation Market?
To stay informed about further developments, trends, and reports in the Nordics Satellite-based Earth Observation Market, consider subscribing to industry newsletters, following relevant companies and organizations, or regularly checking reputable industry news sources and publications.
Methodology
Step 1 - Identification of Relevant Samples Size from Population Database


Step 2 - Approaches for Defining Global Market Size (Value, Volume* & Price*)

Note*: In applicable scenarios
Step 3 - Data Sources
Primary Research
- Web Analytics
- Survey Reports
- Research Institute
- Latest Research Reports
- Opinion Leaders
Secondary Research
- Annual Reports
- White Paper
- Latest Press Release
- Industry Association
- Paid Database
- Investor Presentations

Step 4 - Data Triangulation
Involves using different sources of information in order to increase the validity of a study
These sources are likely to be stakeholders in a program - participants, other researchers, program staff, other community members, and so on.
Then we put all data in single framework & apply various statistical tools to find out the dynamic on the market.
During the analysis stage, feedback from the stakeholder groups would be compared to determine areas of agreement as well as areas of divergence


