

Key Insights
The North American Testing, Inspection, and Certification (TIC) market is poised for robust expansion, projected to achieve a Compound Annual Growth Rate (CAGR) of 4.88% from 2025 to 2033. This growth is propelled by heightened regulatory demands across industries such as environmental protection and product safety, necessitating comprehensive testing and certification. The increasing sophistication of products and manufacturing processes further drives demand for specialized TIC expertise. E-commerce expansion and intricate global supply chains also underscore the need for independent verification of product quality and compliance, contributing to market dynamism.
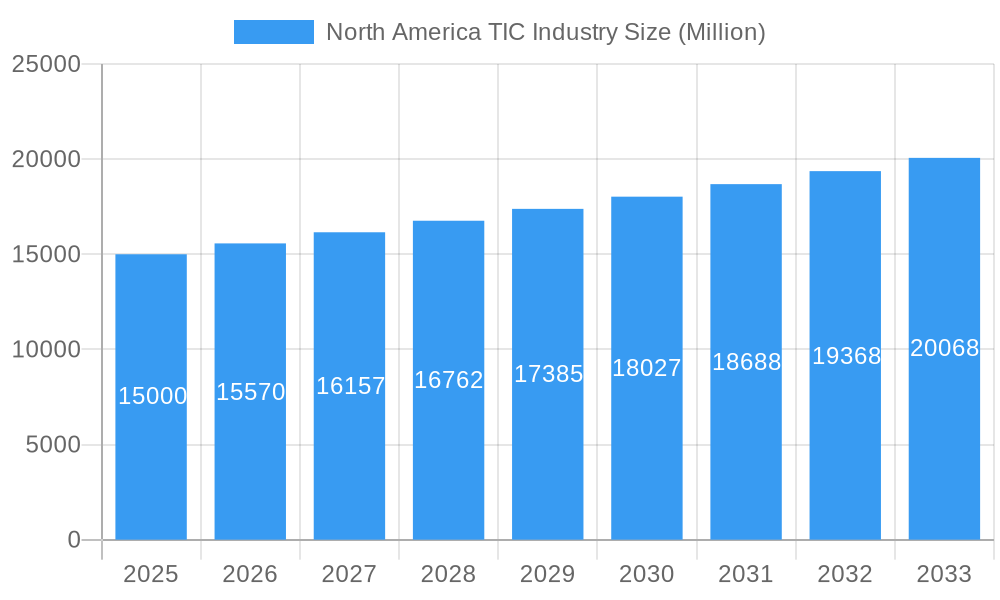
North America TIC Industry Market Size (In Billion)
The United States leads the North American TIC market, supported by its substantial manufacturing sector and stringent regulatory environment. Key growth drivers include environmental testing (air, water, soil, and effluent quality) and the consumer goods and retail sectors, reflecting heightened consumer and environmental consciousness.
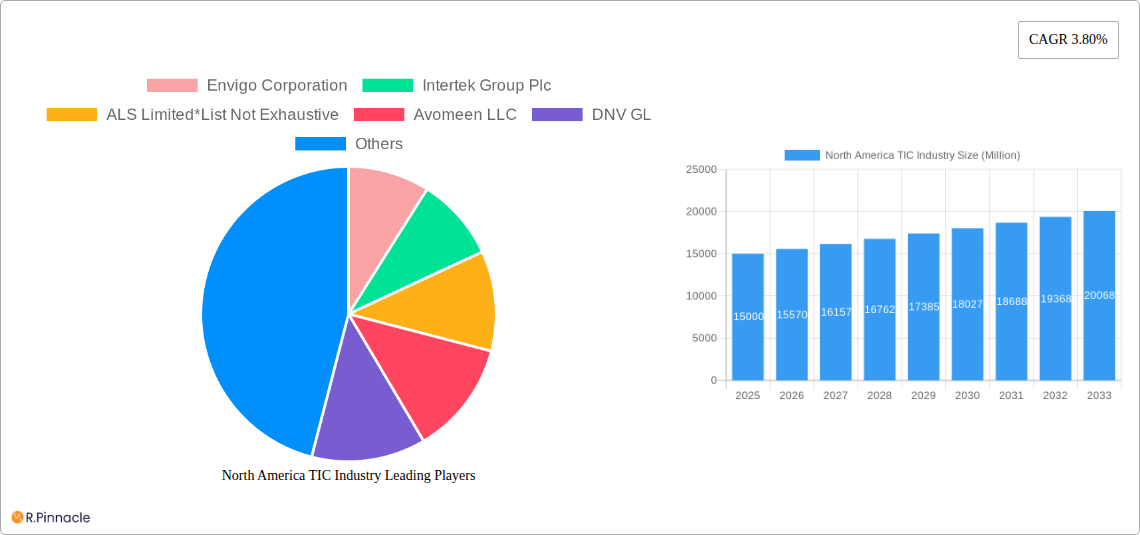
North America TIC Industry Company Market Share
Significant opportunities are emerging in specialized testing domains, with advanced analytical methods and technological innovation enhancing efficiency and cost-effectiveness. While in-house testing remains prevalent for some large enterprises, the outsourced TIC market is expected to grow substantially due to cost advantages and access to specialized skills. The competitive environment features both global leaders and specialized niche providers, with mergers and acquisitions anticipated to reshape market dynamics. Potential challenges include economic slowdowns and commodity price volatility.
The North American TIC market size was valued at 1125.21 million in the base year 2025.
North America TIC Industry Market Report: 2019-2033
This comprehensive report provides a detailed analysis of the North America Testing, Inspection, and Certification (TIC) industry, covering the period from 2019 to 2033. With a focus on market size, segmentation, key players, and future trends, this report is an essential resource for industry professionals, investors, and anyone seeking to understand this dynamic sector. The report utilizes a base year of 2025 and an estimated year of 2025, with a forecast period spanning 2025-2033 and a historical period encompassing 2019-2024. All market values are expressed in Millions.
North America TIC Industry Market Structure & Innovation Trends
The North American TIC market is characterized by a moderately consolidated landscape, featuring a blend of established multinational corporations and agile, specialized smaller firms. Prominent players like Intertek Group Plc, ALS Limited, SGS SA, and Bureau Veritas, alongside many others, collectively drive the market. Smaller entities often carve out significant value by focusing on highly specific niche segments. This market's dynamism is profoundly influenced by a confluence of factors, including increasingly rigorous regulatory requirements, a heightened societal and consumer demand for superior quality and unwavering safety standards, and continuous advancements in sophisticated testing and analytical technologies.
- Market Concentration: The top 5 players are estimated to hold approximately 65-75% of the market share (2025 estimate). This indicates a degree of market concentration, though the presence of specialized players keeps the market competitive.
- Innovation Drivers: Key catalysts for innovation include the escalating stringency of environmental regulations, a growing consumer and industry-wide awareness of product safety, and the imperative for highly efficient and transparent supply chain management. The adoption of digital technologies also plays a crucial role.
- Regulatory Frameworks: The industry's trajectory is significantly shaped by a robust web of regulatory frameworks and compliance standards. Agencies such as the U.S. Food and Drug Administration (FDA), the Environmental Protection Agency (EPA), and the Occupational Safety and Health Administration (OSHA) in the U.S., along with their Canadian counterparts, set benchmarks that necessitate comprehensive testing and certification services, thereby influencing industry dynamics and service offerings.
- Product Substitutes: While direct substitutes for comprehensive TIC services are limited, alternative approaches to quality assurance and risk management, such as enhanced internal auditing or self-certification, may present indirect competition and influence market growth strategies.
- M&A Activities: The North American TIC sector has witnessed a surge in Mergers and Acquisitions (M&A) in recent years. This trend, with annual deal values reaching an estimated $500 Million to $1 billion in recent years, signifies a strategic consolidation and an impetus for market expansion into new service domains and geographies. A notable example includes SGS SA's acquisition of Penumbra Security Inc. in September 2022, demonstrating a proactive approach to expanding capabilities and market reach.
- End-User Demographics: The TIC industry serves a diverse and extensive array of end-user verticals. These span critical sectors including, but not limited to, consumer goods and retail, advanced manufacturing, the automotive industry, aerospace, healthcare, electronics, and the expansive energy sector.
North America TIC Industry Market Dynamics & Trends
The North American TIC market is expected to witness robust growth throughout the forecast period (2025-2033), driven by factors such as increasing industrialization, rising consumer demand for quality products, tightening regulatory standards, and technological advancements in testing methodologies. Technological disruptions, such as automation and AI-powered testing solutions, are enhancing efficiency and accuracy. Consumer preferences for sustainable and ethically sourced products are also driving demand for specific types of TIC services. Competitive dynamics are characterized by both intense competition among established players and the emergence of specialized niche players. The market is expected to exhibit a CAGR of xx% during the forecast period, with market penetration increasing across various end-user verticals.
Dominant Regions & Segments in North America TIC Industry
The United States stands as the preeminent force in the North American TIC market. This dominance is underpinned by its vast and diversified industrial base, a pervasive and stringent regulatory environment that mandates rigorous adherence to safety and quality, and a high concentration of both leading TIC providers and their key clientele. Canada, while smaller in market size, is demonstrating robust growth potential, particularly within its burgeoning environmental and energy sectors, driven by a commitment to sustainable practices and resource development.
By End-User Vertical:
- Manufacturing and Industrial Goods: This sector remains the market's largest segment. It is characterized by exceptionally stringent quality control mandates, complex product lifecycles, and the need for meticulous testing and inspection across diverse industrial applications, from automotive components to heavy machinery.
- Oil and Gas: The energy sector, particularly oil and gas, is a critical consumer of TIC services. The inherent risks associated with exploration, extraction, and transportation necessitate extensive testing and inspection to ensure operational safety, environmental protection, and compliance with evolving regulations.
- Consumer Goods and Retail: Fueled by increasing consumer awareness regarding product safety, ethical sourcing, and sustainability, this segment is experiencing significant expansion. Retailers and manufacturers alike rely on TIC services to verify product compliance and build consumer trust.
By Country:
- United States: The market leader, the U.S. benefits from its immense industrial output, a comprehensive and dynamic regulatory framework, and a dense ecosystem of both TIC service providers and end-users across numerous industries.
- Canada: Canada presents a compelling growth narrative, with a strong emphasis on environmental stewardship and resource management driving demand for specialized TIC services, particularly in sectors like mining, forestry, and renewable energy.
By Type:
- Outsourced: The outsourced TIC services segment holds a dominant position. Businesses across all sectors increasingly opt to delegate non-core testing, inspection, and certification activities to specialized TIC providers, allowing them to focus on core competencies, leverage expertise, and manage costs effectively.
- In-house: While some large multinational corporations may maintain in-house testing and validation capabilities for highly specialized or proprietary applications, the overarching trend favors outsourcing due to the cost-effectiveness, specialized expertise, and wider scope of services offered by third-party TIC providers.
Additional key growth drivers include supportive economic policies that foster industrial development, a well-established and advanced infrastructure, and the availability of a highly skilled workforce adept at operating and developing sophisticated testing technologies.
North America TIC Industry Product Innovations
The North American TIC industry is at the forefront of technological advancement, with recent innovations significantly enhancing the speed, accuracy, and efficiency of testing and certification processes. This includes the widespread adoption of automated testing systems, which reduce human error and increase throughput, and the deployment of advanced analytical techniques such as mass spectrometry, chromatography, and spectroscopy for more precise compositional analysis. The integration of Artificial Intelligence (AI) and Machine Learning (ML) is revolutionizing data analysis, enabling predictive capabilities, anomaly detection, and more sophisticated risk assessments. These technological leaps not only provide a competitive edge by drastically reducing testing turnaround times and improving the reliability of results but also streamline operational workflows, leading to enhanced efficiency and cost savings across diverse industrial sectors. This proactive embrace of technological advancements ensures the industry remains agile and responsive to evolving market demands and regulatory landscapes.
Report Scope & Segmentation Analysis
This report segments the North American TIC market by end-user vertical (Consumer Goods and Retail, Environmental, Food and Agriculture, Manufacturing and Industrial Goods, Oil and Gas, Construction and Engineering, Other), country (United States, Canada), and type (Outsourced, In-house). Each segment's growth projections, market sizes, and competitive dynamics are extensively analyzed. For example, the manufacturing segment is expected to grow at a xx% CAGR, driven by the increasing demand for quality control and compliance testing. The environmental testing sector shows promising growth based on stringent environmental regulations. The outsourced segment is expected to maintain its dominance due to cost-effectiveness and specialized expertise.
Key Drivers of North America TIC Industry Growth
The robust growth of the North American TIC industry is propelled by a multifaceted set of compelling factors. Paramount among these are increasingly stringent government regulations governing product safety, consumer protection, and environmental sustainability, which mandate rigorous testing and certification across virtually all product categories and industrial operations. Simultaneously, rapid technological advancements, including the widespread adoption of automation, the Internet of Things (IoT), and AI in testing methodologies, are significantly boosting testing efficiency, reducing operational costs, and expanding the scope of services that can be offered. The ongoing expansion of global trade and the critical need for businesses to ensure compliance with diverse international standards and trade agreements further amplify the demand for TIC services. Furthermore, the continuous expansion of the manufacturing sector, coupled with a heightened and pervasive consumer awareness regarding product quality, safety, and ethical sourcing, are collectively contributing to the industry's sustained and upward growth trajectory.
Challenges in the North America TIC Industry Sector
The TIC industry faces challenges such as intense competition, stringent regulatory compliance requirements, and potential supply chain disruptions. The high cost of specialized equipment and skilled labor can impact profitability. Furthermore, maintaining accuracy and consistency in testing procedures across different laboratories presents an ongoing challenge. These factors collectively impact the overall market competitiveness and growth trajectory.
Emerging Opportunities in North America TIC Industry
The North American TIC industry is ripe with emerging opportunities, driven by evolving technological frontiers and societal imperatives. Significant growth potential lies in specialized areas such as advanced materials testing, crucial for sectors like aerospace and automotive innovation. The burgeoning demand for sustainable product certification, including green building materials, energy-efficient products, and circular economy initiatives, presents a substantial market. Furthermore, the integration of blockchain technology offers transformative potential for enhanced traceability, data integrity, and supply chain transparency, addressing critical concerns around counterfeit goods and product provenance. Expanding service offerings into rapidly growing sectors like renewable energy (solar, wind, battery storage), biotechnology, and advanced healthcare technologies represents another avenue for substantial growth. The increasing focus on environmental remediation, climate change mitigation, and robust supply chain resilience will continue to fuel the demand for specialized TIC services, creating new avenues for innovation and market penetration.
Leading Players in the North America TIC Industry Market
- Envigo Corporation
- Intertek Group Plc
- ALS Limited
- Avomeen LLC
- DNV GL
- Applus Services SA
- AB Sciex LLC
- SGS SA
- Mistras Group
- DEKRA SE
- Bureau Veritas
- UL LLC
- TUV SUD
Key Developments in North America TIC Industry
- September 2022: SGS SA acquired Penumbra Security Inc., expanding its cybersecurity testing and compliance services.
- March 2022: DEKRA was selected to develop a Vehicle-Grid Innovation Laboratory, supporting the growth of the electric vehicle industry.
Future Outlook for North America TIC Industry Market
The North American TIC market is poised for continued growth, driven by technological advancements, increasing regulatory scrutiny, and the expansion of various end-user industries. Strategic opportunities lie in leveraging emerging technologies like AI and blockchain, expanding service offerings into niche sectors, and focusing on sustainable and environmentally conscious solutions. The overall market outlook is positive, with significant potential for growth in the coming years.
North America TIC Industry Segmentation
-
1. Type
- 1.1. Outsourced
- 1.2. In-house
-
2. End-User Vertical
- 2.1. Consumer Goods and Retail
- 2.2. Environmental (Effluent, Water, Soil, Air)
- 2.3. Food and Agriculture
- 2.4. Manufacturing and Industrial Goods
- 2.5. Oil and Gas
- 2.6. Construction and Engineering
- 2.7. Other End-user Verticals
North America TIC Industry Segmentation By Geography
-
1. North America
- 1.1. United States
- 1.2. Canada
- 1.3. Mexico
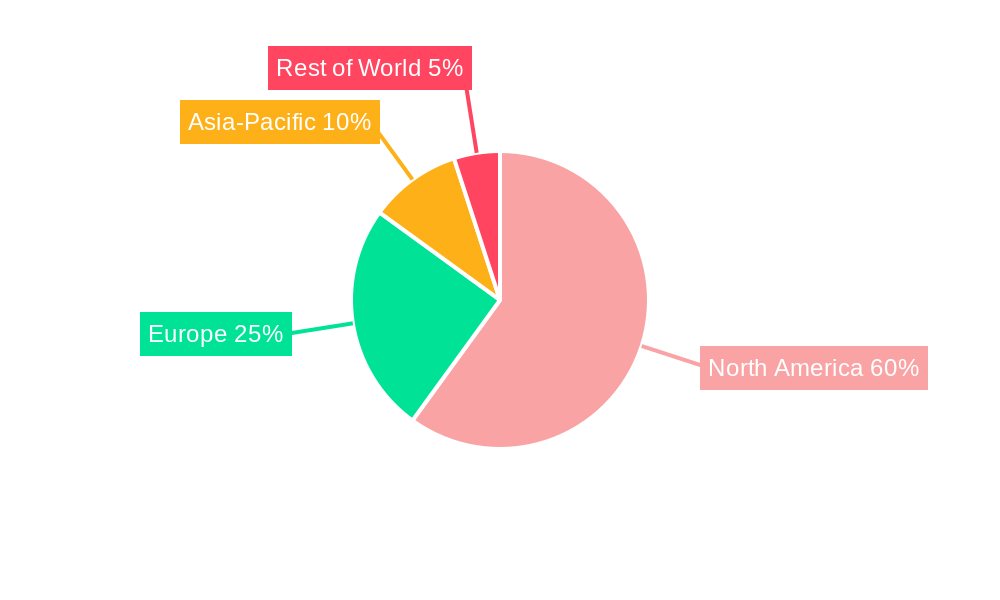
North America TIC Industry Regional Market Share
Geographic Coverage of North America TIC Industry
North America TIC Industry REPORT HIGHLIGHTS
| Aspects | Details |
|---|---|
| Study Period | 2020-2034 |
| Base Year | 2025 |
| Estimated Year | 2026 |
| Forecast Period | 2026-2034 |
| Historical Period | 2020-2025 |
| Growth Rate | CAGR of 4.88% from 2020-2034 |
| Segmentation |
|
Table of Contents
- 1. Introduction
- 1.1. Research Scope
- 1.2. Market Segmentation
- 1.3. Research Objective
- 1.4. Definitions and Assumptions
- 2. Executive Summary
- 2.1. Market Snapshot
- 3. Market Dynamics
- 3.1. Market Drivers
- 3.2. Market Restrains
- 3.3. Market Trends
- 3.4. Market Opportunities
- 4. Market Factor Analysis
- 4.1. Porters Five Forces
- 4.1.1. Bargaining Power of Suppliers
- 4.1.2. Bargaining Power of Buyers
- 4.1.3. Threat of New Entrants
- 4.1.4. Threat of Substitutes
- 4.1.5. Competitive Rivalry
- 4.2. PESTEL analysis
- 4.3. BCG Analysis
- 4.3.1. Stars (High Growth, High Market Share)
- 4.3.2. Cash Cows (Low Growth, High Market Share)
- 4.3.3. Question Mark (High Growth, Low Market Share)
- 4.3.4. Dogs (Low Growth, Low Market Share)
- 4.4. Ansoff Matrix Analysis
- 4.5. Supply Chain Analysis
- 4.6. Regulatory Landscape
- 4.7. Current Market Potential and Opportunity Assessment (TAM–SAM–SOM Framework)
- 4.8. PRI Analyst Note
- 4.1. Porters Five Forces
- 5. Market Analysis, Insights and Forecast 2021-2033
- 5.1. Market Analysis, Insights and Forecast - by Type
- 5.1.1. Outsourced
- 5.1.2. In-house
- 5.2. Market Analysis, Insights and Forecast - by End-User Vertical
- 5.2.1. Consumer Goods and Retail
- 5.2.2. Environmental (Effluent, Water, Soil, Air)
- 5.2.3. Food and Agriculture
- 5.2.4. Manufacturing and Industrial Goods
- 5.2.5. Oil and Gas
- 5.2.6. Construction and Engineering
- 5.2.7. Other End-user Verticals
- 5.3. Market Analysis, Insights and Forecast - by Region
- 5.3.1. North America
- 5.1. Market Analysis, Insights and Forecast - by Type
- 6. North America TIC Industry Analysis, Insights and Forecast, 2021-2033
- 6.1. Market Analysis, Insights and Forecast - by Type
- 6.1.1. Outsourced
- 6.1.2. In-house
- 6.2. Market Analysis, Insights and Forecast - by End-User Vertical
- 6.2.1. Consumer Goods and Retail
- 6.2.2. Environmental (Effluent, Water, Soil, Air)
- 6.2.3. Food and Agriculture
- 6.2.4. Manufacturing and Industrial Goods
- 6.2.5. Oil and Gas
- 6.2.6. Construction and Engineering
- 6.2.7. Other End-user Verticals
- 6.1. Market Analysis, Insights and Forecast - by Type
- 7. Competitive Analysis
- 7.1. Company Profiles
- 7.1.1 Envigo Corporation
- 7.1.1.1. Company Overview
- 7.1.1.2. Products
- 7.1.1.3. Company Financials
- 7.1.1.4. SWOT Analysis
- 7.1.2 Intertek Group Plc
- 7.1.2.1. Company Overview
- 7.1.2.2. Products
- 7.1.2.3. Company Financials
- 7.1.2.4. SWOT Analysis
- 7.1.3 ALS Limited*List Not Exhaustive
- 7.1.3.1. Company Overview
- 7.1.3.2. Products
- 7.1.3.3. Company Financials
- 7.1.3.4. SWOT Analysis
- 7.1.4 Avomeen LLC
- 7.1.4.1. Company Overview
- 7.1.4.2. Products
- 7.1.4.3. Company Financials
- 7.1.4.4. SWOT Analysis
- 7.1.5 DNV GL
- 7.1.5.1. Company Overview
- 7.1.5.2. Products
- 7.1.5.3. Company Financials
- 7.1.5.4. SWOT Analysis
- 7.1.6 Applus Services SA
- 7.1.6.1. Company Overview
- 7.1.6.2. Products
- 7.1.6.3. Company Financials
- 7.1.6.4. SWOT Analysis
- 7.1.7 AB Sciex LLC
- 7.1.7.1. Company Overview
- 7.1.7.2. Products
- 7.1.7.3. Company Financials
- 7.1.7.4. SWOT Analysis
- 7.1.8 SGS SA
- 7.1.8.1. Company Overview
- 7.1.8.2. Products
- 7.1.8.3. Company Financials
- 7.1.8.4. SWOT Analysis
- 7.1.9 Mistras Group
- 7.1.9.1. Company Overview
- 7.1.9.2. Products
- 7.1.9.3. Company Financials
- 7.1.9.4. SWOT Analysis
- 7.1.10 DEKRA SE
- 7.1.10.1. Company Overview
- 7.1.10.2. Products
- 7.1.10.3. Company Financials
- 7.1.10.4. SWOT Analysis
- 7.1.11 Bureau Veritas
- 7.1.11.1. Company Overview
- 7.1.11.2. Products
- 7.1.11.3. Company Financials
- 7.1.11.4. SWOT Analysis
- 7.1.12 UL LLC
- 7.1.12.1. Company Overview
- 7.1.12.2. Products
- 7.1.12.3. Company Financials
- 7.1.12.4. SWOT Analysis
- 7.1.13 TUV SUD
- 7.1.13.1. Company Overview
- 7.1.13.2. Products
- 7.1.13.3. Company Financials
- 7.1.13.4. SWOT Analysis
- 7.1.1 Envigo Corporation
- 7.2. Market Entropy
- 7.2.1 Company's Key Areas Served
- 7.2.2 Recent Developments
- 7.3. Company Market Share Analysis 2025
- 7.3.1 Top 5 Companies Market Share Analysis
- 7.3.2 Top 3 Companies Market Share Analysis
- 7.4. List of Potential Customers
- 8. Research Methodology
List of Figures
- Figure 1: North America TIC Industry Revenue Breakdown (million, %) by Product 2025 & 2033
- Figure 2: North America TIC Industry Share (%) by Company 2025
List of Tables
- Table 1: North America TIC Industry Revenue million Forecast, by Type 2020 & 2033
- Table 2: North America TIC Industry Revenue million Forecast, by End-User Vertical 2020 & 2033
- Table 3: North America TIC Industry Revenue million Forecast, by Region 2020 & 2033
- Table 4: North America TIC Industry Revenue million Forecast, by Type 2020 & 2033
- Table 5: North America TIC Industry Revenue million Forecast, by End-User Vertical 2020 & 2033
- Table 6: North America TIC Industry Revenue million Forecast, by Country 2020 & 2033
- Table 7: United States North America TIC Industry Revenue (million) Forecast, by Application 2020 & 2033
- Table 8: Canada North America TIC Industry Revenue (million) Forecast, by Application 2020 & 2033
- Table 9: Mexico North America TIC Industry Revenue (million) Forecast, by Application 2020 & 2033
Frequently Asked Questions
1. What is the projected Compound Annual Growth Rate (CAGR) of the North America TIC Industry?
The projected CAGR is approximately 4.88%.
2. Which companies are prominent players in the North America TIC Industry?
Key companies in the market include Envigo Corporation, Intertek Group Plc, ALS Limited*List Not Exhaustive, Avomeen LLC, DNV GL, Applus Services SA, AB Sciex LLC, SGS SA, Mistras Group, DEKRA SE, Bureau Veritas, UL LLC, TUV SUD.
3. What are the main segments of the North America TIC Industry?
The market segments include Type, End-User Vertical.
4. Can you provide details about the market size?
The market size is estimated to be USD 1125.21 million as of 2022.
5. What are some drivers contributing to market growth?
Highly Developed Regulatory Framework; Growing Demand For Outsourced Servic.
6. What are the notable trends driving market growth?
Automotive Industry Holds Significant Market Share.
7. Are there any restraints impacting market growth?
Entry Barriers for New Players and Standardization Concerns Especially in the Case of Inter-border Transactions.
8. Can you provide examples of recent developments in the market?
September 2022: SGS SA acquired Penumbra Security Inc., a recognized leader in different types of information security conformance testing to government standards and regulatory compliance for multinational companies. In addition, the company is accredited by the National Voluntary Laboratory Programs for Federal Information Processing Standard test methods (FIPS 140-2/3). This helps in the further development of TIC services for the company.
9. What pricing options are available for accessing the report?
Pricing options include single-user, multi-user, and enterprise licenses priced at USD 4750, USD 4950, and USD 6800 respectively.
10. Is the market size provided in terms of value or volume?
The market size is provided in terms of value, measured in million.
11. Are there any specific market keywords associated with the report?
Yes, the market keyword associated with the report is "North America TIC Industry," which aids in identifying and referencing the specific market segment covered.
12. How do I determine which pricing option suits my needs best?
The pricing options vary based on user requirements and access needs. Individual users may opt for single-user licenses, while businesses requiring broader access may choose multi-user or enterprise licenses for cost-effective access to the report.
13. Are there any additional resources or data provided in the North America TIC Industry report?
While the report offers comprehensive insights, it's advisable to review the specific contents or supplementary materials provided to ascertain if additional resources or data are available.
14. How can I stay updated on further developments or reports in the North America TIC Industry?
To stay informed about further developments, trends, and reports in the North America TIC Industry, consider subscribing to industry newsletters, following relevant companies and organizations, or regularly checking reputable industry news sources and publications.
Methodology
Step 1 - Identification of Relevant Samples Size from Population Database


Step 2 - Approaches for Defining Global Market Size (Value, Volume* & Price*)

Note*: In applicable scenarios
Step 3 - Data Sources
Primary Research
- Web Analytics
- Survey Reports
- Research Institute
- Latest Research Reports
- Opinion Leaders
Secondary Research
- Annual Reports
- White Paper
- Latest Press Release
- Industry Association
- Paid Database
- Investor Presentations

Step 4 - Data Triangulation
Involves using different sources of information in order to increase the validity of a study
These sources are likely to be stakeholders in a program - participants, other researchers, program staff, other community members, and so on.
Then we put all data in single framework & apply various statistical tools to find out the dynamic on the market.
During the analysis stage, feedback from the stakeholder groups would be compared to determine areas of agreement as well as areas of divergence