
Key Insights
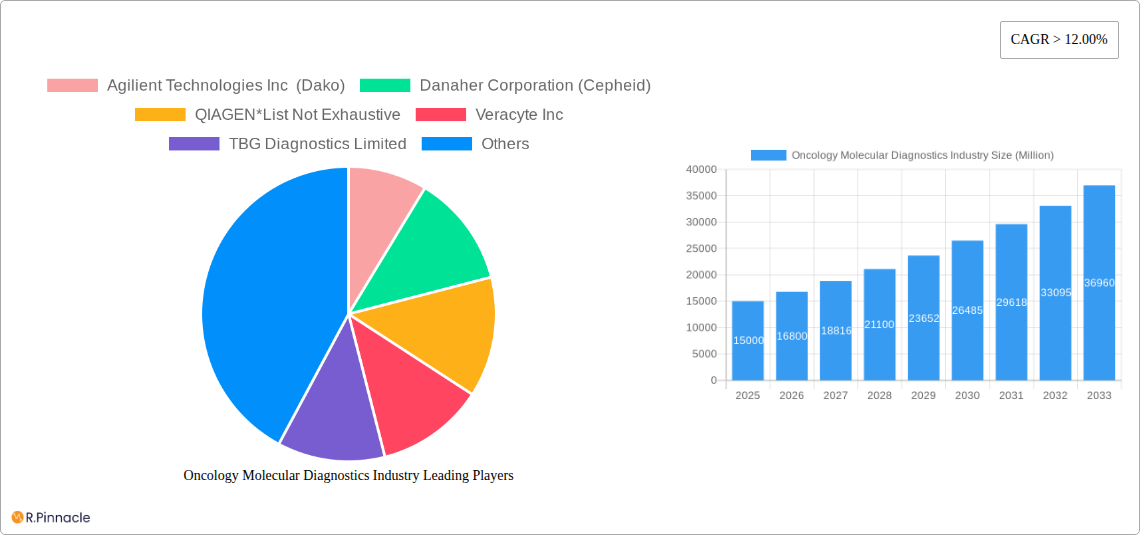
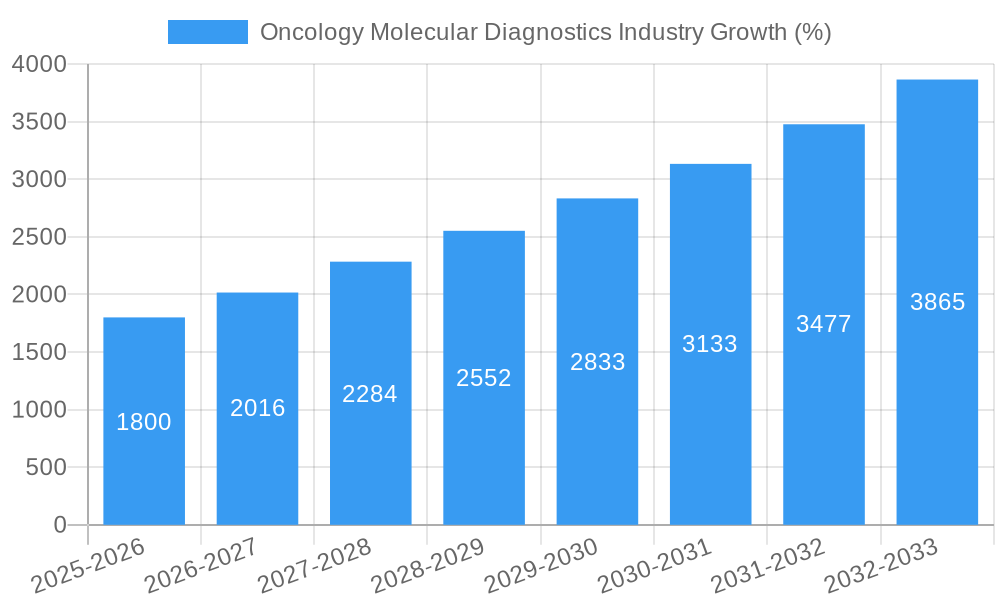
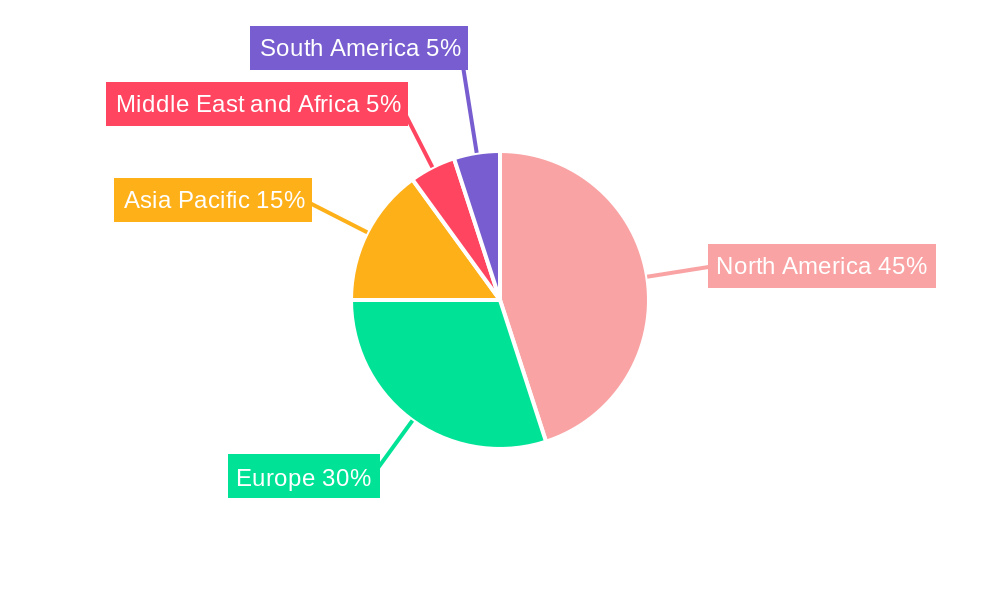
The oncology molecular diagnostics market is experiencing robust growth, driven by the rising incidence of cancer globally, advancements in molecular diagnostic technologies, and increasing demand for personalized medicine. The market's compound annual growth rate (CAGR) exceeding 12% signifies significant expansion, projected to reach substantial value by 2033. Key drivers include the development of more sensitive and specific diagnostic tests, enabling early cancer detection and improved treatment outcomes. The increasing adoption of next-generation sequencing (NGS) and other advanced technologies is further accelerating market growth. Technological advancements are leading to faster turnaround times, reduced costs, and the ability to analyze larger volumes of data, improving the accuracy and efficiency of cancer diagnostics. The market is segmented by application type (breast, prostate, colorectal, lung, blood, liver, cervical, and other cancers), end-user (hospitals, diagnostic centers, and others), product type (instruments, reagents, and others), and technology type (PCR, INAAT, DNA sequencing/NGS, in-situ hybridization, mass spectrometry, TMA, chips & microarrays, and others). The market's geographic distribution is widespread, with North America and Europe currently dominating due to established healthcare infrastructure and high adoption rates of advanced technologies. However, the Asia-Pacific region is expected to witness rapid growth fueled by increasing healthcare spending and rising cancer prevalence.
Despite the considerable growth potential, certain restraints exist. These include the high cost of advanced diagnostic technologies, the need for skilled professionals to operate and interpret results, and regulatory hurdles in certain regions. Furthermore, reimbursement challenges and the complexity of integrating molecular diagnostics into routine clinical practice can impede widespread adoption. However, ongoing technological innovation, coupled with efforts to reduce costs and improve accessibility, is expected to mitigate these challenges and sustain the market's strong growth trajectory. Competition among major players, including Agilent Technologies, Danaher Corporation, QIAGEN, and others, is intense, driving further innovation and market consolidation. The future of the oncology molecular diagnostics market hinges on continued technological advancements, strategic collaborations, and successful integration into broader cancer care pathways.
Oncology Molecular Diagnostics Industry: A Comprehensive Market Report (2019-2033)
This in-depth report provides a comprehensive analysis of the Oncology Molecular Diagnostics market, offering crucial insights for industry professionals, investors, and strategists. The report covers the period from 2019 to 2033, with a focus on the forecast period of 2025-2033 and a base year of 2025. The market is segmented by application type, end-user, product type, and technology type, providing a granular understanding of market dynamics and growth opportunities. The report includes detailed analysis of key players, emerging trends, and challenges, equipping readers with actionable intelligence for informed decision-making. The total market value is projected to reach xx Million by 2033.
Oncology Molecular Diagnostics Industry Market Structure & Innovation Trends
The Oncology Molecular Diagnostics market exhibits a moderately concentrated structure, with key players like Agilent Technologies Inc (Dako), Danaher Corporation (Cepheid), and QIAGEN holding significant market share. However, the market also features several smaller, specialized companies, leading to a dynamic competitive landscape. Innovation is driven by advancements in next-generation sequencing (NGS), digital PCR, and other molecular techniques. The regulatory landscape, particularly regarding approvals and reimbursement policies, significantly influences market growth. Product substitutes, such as traditional histopathology methods, remain present but are increasingly challenged by the superior accuracy and information provided by molecular diagnostics. M&A activity is frequent, with larger companies acquiring smaller, innovative firms to expand their product portfolios and technological capabilities. Deal values in recent years have averaged xx Million per transaction.
- Market Concentration: Moderately Concentrated
- Innovation Drivers: NGS, digital PCR, and other molecular advancements
- Regulatory Framework: Significant influence on market growth.
- M&A Activity: Frequent, with average deal values of xx Million.
Oncology Molecular Diagnostics Industry Market Dynamics & Trends
The Oncology Molecular Diagnostics market is experiencing robust growth, driven by factors such as increasing cancer incidence, rising demand for personalized medicine, and technological advancements enabling earlier and more precise diagnosis. The market is witnessing a significant shift towards minimally invasive diagnostic techniques and liquid biopsies. Technological disruptions, such as the adoption of AI-driven diagnostic tools, are enhancing accuracy and efficiency. Consumer preferences are increasingly focused on faster turnaround times, lower costs, and more comprehensive diagnostic information. The competitive dynamics are shaped by ongoing innovation, strategic partnerships, and mergers and acquisitions. The Compound Annual Growth Rate (CAGR) for the forecast period (2025-2033) is estimated to be xx%. Market penetration of NGS technologies is projected to reach xx% by 2033.
Dominant Regions & Segments in Oncology Molecular Diagnostics Industry
North America currently dominates the Oncology Molecular Diagnostics market, driven by strong healthcare infrastructure, high adoption rates of advanced technologies, and favorable regulatory environments. Within the application type segment, Breast Cancer, Lung Cancer, and Colorectal Cancer represent the largest market shares due to high incidence rates and increased awareness. Hospitals constitute the dominant end-user segment, reflecting the concentration of testing capabilities within established healthcare facilities. Reagents represent the largest market share within product type, reflecting the high volume of testing activity. Polymerase Chain Reaction (PCR) and DNA Sequencing technologies are currently leading the market.
- Key Drivers for North American Dominance:
- Advanced healthcare infrastructure
- High adoption rate of advanced technologies
- Favorable regulatory environment
- Largest Market Segments:
- By Application Type: Breast Cancer, Lung Cancer, Colorectal Cancer.
- By End User: Hospitals
- By Product Type: Reagents
- By Technology Type: PCR, DNA Sequencing.
Oncology Molecular Diagnostics Industry Product Innovations
Recent product developments focus on improved sensitivity, specificity, and multiplexing capabilities for molecular diagnostic assays. Innovations in liquid biopsy technology, including circulating tumor DNA (ctDNA) and circulating tumor cells (CTCs) analysis, are expanding the range of applications. These innovations offer significant competitive advantages by allowing earlier cancer detection, improved treatment monitoring, and reduced invasiveness. The integration of AI and machine learning is further enhancing the analytical capabilities of these technologies, improving diagnostic accuracy and providing more personalized treatment plans.
Report Scope & Segmentation Analysis
This report comprehensively segments the Oncology Molecular Diagnostics market by:
Application Type: Breast Cancer, Prostate Cancer, Colorectal Cancer, Lung Cancer, Blood Cancer, Liver Cancer, Cervical Cancer, and Other Application Types. Each segment shows varying growth rates due to prevalence, and research activity.
End User: Hospitals, Diagnostic Centers, and Other End Users. The hospital segment is dominant due to infrastructure and expertise.
Product Type: Instrument, Reagents, and Other Product Types. Reagents drive significant revenue due to testing volume.
Technology Type: Polymerase Chain Reaction (PCR), Isothermal Nucleic Acid Amplification Technology (INAAT), DNA Sequencing and Next-Generation Sequencing, In-situ Hybridization, Mass Spectrometry, Transcription Mediated Amplification (TMA), Chips and Microarrays, and Other Technology Types. NGS is a major growth driver.
Each segment includes detailed growth projections, market size estimations, and competitive analysis for the forecast period.
Key Drivers of Oncology Molecular Diagnostics Industry Growth
Several factors drive growth within the Oncology Molecular Diagnostics market: the increasing prevalence of cancer globally, the rising demand for personalized medicine, advancements in molecular diagnostic technologies, and supportive regulatory frameworks that encourage innovation and adoption of new tests. Favorable reimbursement policies in many countries also contribute to market expansion.
Challenges in the Oncology Molecular Diagnostics Industry Sector
Challenges include high testing costs that can limit accessibility, complexities associated with regulatory approvals and reimbursement processes, supply chain disruptions affecting reagent availability, and the intense competition among established players and emerging companies. These factors collectively impact market growth and profitability.
Emerging Opportunities in Oncology Molecular Diagnostics Industry
Emerging opportunities lie in the development of innovative diagnostic tools using liquid biopsies, the application of artificial intelligence for enhanced diagnostic accuracy and data analysis, and the expansion into emerging markets with rising cancer incidence rates. These opportunities are expected to shape future market dynamics and drive growth.
Leading Players in the Oncology Molecular Diagnostics Industry Market
- Agilent Technologies Inc (Dako)
- Danaher Corporation (Cepheid)
- QIAGEN
- Veracyte Inc
- TBG Diagnostics Limited
- HTG Molecular Diagnostics Inc
- Thermo Fisher Scientific Inc
- Abbott Laboratories
- F Hoffmann La-Roche Ltd
- bioMérieux SA
- Illumina Inc
- Sysmex Corporation (Sysmex Europe GmbH)
Key Developments in Oncology Molecular Diagnostics Industry
- 2023-03: Illumina launches a new NGS platform.
- 2022-11: Roche acquires a small molecular diagnostics company specializing in liquid biopsies.
- 2022-08: QIAGEN announces a new PCR assay for early detection of lung cancer.
- (Further developments will be detailed within the full report)
Future Outlook for Oncology Molecular Diagnostics Industry Market
The Oncology Molecular Diagnostics market is poised for continued growth, driven by advancements in technology, increasing healthcare spending, and a growing emphasis on personalized medicine. Strategic acquisitions, partnerships, and the development of innovative diagnostic solutions are expected to further shape the market landscape in the years to come. The expansion into new markets and application areas also offers significant opportunities for growth and profitability.
Oncology Molecular Diagnostics Industry Segmentation
-
1. Product Type
- 1.1. Instrument
- 1.2. Reagents
- 1.3. Other Product Types
-
2. Technology Type
- 2.1. Polymerase Chain Reaction (PCR)
- 2.2. Isotherm
- 2.3. DNA Sequencing and Next-Generation Sequencing
- 2.4. In-situ Hybridization
- 2.5. Mass Spectrometry
- 2.6. Transcription Mediated Amplification (TMA)
- 2.7. Chips and Microarrays
- 2.8. Other Technology Types
-
3. Application Type
- 3.1. Breast Cancer
- 3.2. Prostate Cancer
- 3.3. Colorectal Cancer
- 3.4. Lung Cancer
- 3.5. Blood Cancer
- 3.6. Liver Cancer
- 3.7. Cervical Cancer
- 3.8. Other Application Types
-
4. End User
- 4.1. Hospitals
- 4.2. Diagnostic Centers
- 4.3. Other End Users
Oncology Molecular Diagnostics Industry Segmentation By Geography
-
1. North America
- 1.1. United States
- 1.2. Canada
- 1.3. Mexico
-
2. Europe
- 2.1. Germany
- 2.2. United Kingdom
- 2.3. France
- 2.4. Italy
- 2.5. Spain
- 2.6. Rest of Europe
-
3. Asia Pacific
- 3.1. China
- 3.2. Japan
- 3.3. India
- 3.4. Australia
- 3.5. South Korea
- 3.6. Rest of Asia Pacific
-
4. Middle East and Africa
- 4.1. GCC
- 4.2. South Africa
- 4.3. Rest of Middle East and Africa
-
5. South America
- 5.1. Brazil
- 5.2. Argentina
- 5.3. Rest of South America
Oncology Molecular Diagnostics Industry REPORT HIGHLIGHTS
| Aspects | Details |
|---|---|
| Study Period | 2019-2033 |
| Base Year | 2024 |
| Estimated Year | 2025 |
| Forecast Period | 2025-2033 |
| Historical Period | 2019-2024 |
| Growth Rate | CAGR of > 12.00% from 2019-2033 |
| Segmentation |
|
Table of Contents
- 1. Introduction
- 1.1. Research Scope
- 1.2. Market Segmentation
- 1.3. Research Methodology
- 1.4. Definitions and Assumptions
- 2. Executive Summary
- 2.1. Introduction
- 3. Market Dynamics
- 3.1. Introduction
- 3.2. Market Drivers
- 3.2.1. Rising Prevalence of Cancer Worldwide; Technological Advancements in Diagnostic Testing; Increasing Demand for Point-of-care Treatment
- 3.3. Market Restrains
- 3.3.1. High Cost of Molecular Diagnostic Tests; Lack of Skilled Workforce and Stringent Regulatory Framework
- 3.4. Market Trends
- 3.4.1. Polymerase Chain Reaction (PCR) is Anticipated to Observe a Significant Growth
- 4. Market Factor Analysis
- 4.1. Porters Five Forces
- 4.2. Supply/Value Chain
- 4.3. PESTEL analysis
- 4.4. Market Entropy
- 4.5. Patent/Trademark Analysis
- 5. Global Oncology Molecular Diagnostics Industry Analysis, Insights and Forecast, 2019-2031
- 5.1. Market Analysis, Insights and Forecast - by Product Type
- 5.1.1. Instrument
- 5.1.2. Reagents
- 5.1.3. Other Product Types
- 5.2. Market Analysis, Insights and Forecast - by Technology Type
- 5.2.1. Polymerase Chain Reaction (PCR)
- 5.2.2. Isotherm
- 5.2.3. DNA Sequencing and Next-Generation Sequencing
- 5.2.4. In-situ Hybridization
- 5.2.5. Mass Spectrometry
- 5.2.6. Transcription Mediated Amplification (TMA)
- 5.2.7. Chips and Microarrays
- 5.2.8. Other Technology Types
- 5.3. Market Analysis, Insights and Forecast - by Application Type
- 5.3.1. Breast Cancer
- 5.3.2. Prostate Cancer
- 5.3.3. Colorectal Cancer
- 5.3.4. Lung Cancer
- 5.3.5. Blood Cancer
- 5.3.6. Liver Cancer
- 5.3.7. Cervical Cancer
- 5.3.8. Other Application Types
- 5.4. Market Analysis, Insights and Forecast - by End User
- 5.4.1. Hospitals
- 5.4.2. Diagnostic Centers
- 5.4.3. Other End Users
- 5.5. Market Analysis, Insights and Forecast - by Region
- 5.5.1. North America
- 5.5.2. Europe
- 5.5.3. Asia Pacific
- 5.5.4. Middle East and Africa
- 5.5.5. South America
- 5.1. Market Analysis, Insights and Forecast - by Product Type
- 6. North America Oncology Molecular Diagnostics Industry Analysis, Insights and Forecast, 2019-2031
- 6.1. Market Analysis, Insights and Forecast - by Product Type
- 6.1.1. Instrument
- 6.1.2. Reagents
- 6.1.3. Other Product Types
- 6.2. Market Analysis, Insights and Forecast - by Technology Type
- 6.2.1. Polymerase Chain Reaction (PCR)
- 6.2.2. Isotherm
- 6.2.3. DNA Sequencing and Next-Generation Sequencing
- 6.2.4. In-situ Hybridization
- 6.2.5. Mass Spectrometry
- 6.2.6. Transcription Mediated Amplification (TMA)
- 6.2.7. Chips and Microarrays
- 6.2.8. Other Technology Types
- 6.3. Market Analysis, Insights and Forecast - by Application Type
- 6.3.1. Breast Cancer
- 6.3.2. Prostate Cancer
- 6.3.3. Colorectal Cancer
- 6.3.4. Lung Cancer
- 6.3.5. Blood Cancer
- 6.3.6. Liver Cancer
- 6.3.7. Cervical Cancer
- 6.3.8. Other Application Types
- 6.4. Market Analysis, Insights and Forecast - by End User
- 6.4.1. Hospitals
- 6.4.2. Diagnostic Centers
- 6.4.3. Other End Users
- 6.1. Market Analysis, Insights and Forecast - by Product Type
- 7. Europe Oncology Molecular Diagnostics Industry Analysis, Insights and Forecast, 2019-2031
- 7.1. Market Analysis, Insights and Forecast - by Product Type
- 7.1.1. Instrument
- 7.1.2. Reagents
- 7.1.3. Other Product Types
- 7.2. Market Analysis, Insights and Forecast - by Technology Type
- 7.2.1. Polymerase Chain Reaction (PCR)
- 7.2.2. Isotherm
- 7.2.3. DNA Sequencing and Next-Generation Sequencing
- 7.2.4. In-situ Hybridization
- 7.2.5. Mass Spectrometry
- 7.2.6. Transcription Mediated Amplification (TMA)
- 7.2.7. Chips and Microarrays
- 7.2.8. Other Technology Types
- 7.3. Market Analysis, Insights and Forecast - by Application Type
- 7.3.1. Breast Cancer
- 7.3.2. Prostate Cancer
- 7.3.3. Colorectal Cancer
- 7.3.4. Lung Cancer
- 7.3.5. Blood Cancer
- 7.3.6. Liver Cancer
- 7.3.7. Cervical Cancer
- 7.3.8. Other Application Types
- 7.4. Market Analysis, Insights and Forecast - by End User
- 7.4.1. Hospitals
- 7.4.2. Diagnostic Centers
- 7.4.3. Other End Users
- 7.1. Market Analysis, Insights and Forecast - by Product Type
- 8. Asia Pacific Oncology Molecular Diagnostics Industry Analysis, Insights and Forecast, 2019-2031
- 8.1. Market Analysis, Insights and Forecast - by Product Type
- 8.1.1. Instrument
- 8.1.2. Reagents
- 8.1.3. Other Product Types
- 8.2. Market Analysis, Insights and Forecast - by Technology Type
- 8.2.1. Polymerase Chain Reaction (PCR)
- 8.2.2. Isotherm
- 8.2.3. DNA Sequencing and Next-Generation Sequencing
- 8.2.4. In-situ Hybridization
- 8.2.5. Mass Spectrometry
- 8.2.6. Transcription Mediated Amplification (TMA)
- 8.2.7. Chips and Microarrays
- 8.2.8. Other Technology Types
- 8.3. Market Analysis, Insights and Forecast - by Application Type
- 8.3.1. Breast Cancer
- 8.3.2. Prostate Cancer
- 8.3.3. Colorectal Cancer
- 8.3.4. Lung Cancer
- 8.3.5. Blood Cancer
- 8.3.6. Liver Cancer
- 8.3.7. Cervical Cancer
- 8.3.8. Other Application Types
- 8.4. Market Analysis, Insights and Forecast - by End User
- 8.4.1. Hospitals
- 8.4.2. Diagnostic Centers
- 8.4.3. Other End Users
- 8.1. Market Analysis, Insights and Forecast - by Product Type
- 9. Middle East and Africa Oncology Molecular Diagnostics Industry Analysis, Insights and Forecast, 2019-2031
- 9.1. Market Analysis, Insights and Forecast - by Product Type
- 9.1.1. Instrument
- 9.1.2. Reagents
- 9.1.3. Other Product Types
- 9.2. Market Analysis, Insights and Forecast - by Technology Type
- 9.2.1. Polymerase Chain Reaction (PCR)
- 9.2.2. Isotherm
- 9.2.3. DNA Sequencing and Next-Generation Sequencing
- 9.2.4. In-situ Hybridization
- 9.2.5. Mass Spectrometry
- 9.2.6. Transcription Mediated Amplification (TMA)
- 9.2.7. Chips and Microarrays
- 9.2.8. Other Technology Types
- 9.3. Market Analysis, Insights and Forecast - by Application Type
- 9.3.1. Breast Cancer
- 9.3.2. Prostate Cancer
- 9.3.3. Colorectal Cancer
- 9.3.4. Lung Cancer
- 9.3.5. Blood Cancer
- 9.3.6. Liver Cancer
- 9.3.7. Cervical Cancer
- 9.3.8. Other Application Types
- 9.4. Market Analysis, Insights and Forecast - by End User
- 9.4.1. Hospitals
- 9.4.2. Diagnostic Centers
- 9.4.3. Other End Users
- 9.1. Market Analysis, Insights and Forecast - by Product Type
- 10. South America Oncology Molecular Diagnostics Industry Analysis, Insights and Forecast, 2019-2031
- 10.1. Market Analysis, Insights and Forecast - by Product Type
- 10.1.1. Instrument
- 10.1.2. Reagents
- 10.1.3. Other Product Types
- 10.2. Market Analysis, Insights and Forecast - by Technology Type
- 10.2.1. Polymerase Chain Reaction (PCR)
- 10.2.2. Isotherm
- 10.2.3. DNA Sequencing and Next-Generation Sequencing
- 10.2.4. In-situ Hybridization
- 10.2.5. Mass Spectrometry
- 10.2.6. Transcription Mediated Amplification (TMA)
- 10.2.7. Chips and Microarrays
- 10.2.8. Other Technology Types
- 10.3. Market Analysis, Insights and Forecast - by Application Type
- 10.3.1. Breast Cancer
- 10.3.2. Prostate Cancer
- 10.3.3. Colorectal Cancer
- 10.3.4. Lung Cancer
- 10.3.5. Blood Cancer
- 10.3.6. Liver Cancer
- 10.3.7. Cervical Cancer
- 10.3.8. Other Application Types
- 10.4. Market Analysis, Insights and Forecast - by End User
- 10.4.1. Hospitals
- 10.4.2. Diagnostic Centers
- 10.4.3. Other End Users
- 10.1. Market Analysis, Insights and Forecast - by Product Type
- 11. North America Oncology Molecular Diagnostics Industry Analysis, Insights and Forecast, 2019-2031
- 11.1. Market Analysis, Insights and Forecast - By Country/Sub-region
- 11.1.1 United States
- 11.1.2 Canada
- 11.1.3 Mexico
- 12. Europe Oncology Molecular Diagnostics Industry Analysis, Insights and Forecast, 2019-2031
- 12.1. Market Analysis, Insights and Forecast - By Country/Sub-region
- 12.1.1 Germany
- 12.1.2 United Kingdom
- 12.1.3 France
- 12.1.4 Italy
- 12.1.5 Spain
- 12.1.6 Rest of Europe
- 13. Asia Pacific Oncology Molecular Diagnostics Industry Analysis, Insights and Forecast, 2019-2031
- 13.1. Market Analysis, Insights and Forecast - By Country/Sub-region
- 13.1.1 China
- 13.1.2 Japan
- 13.1.3 India
- 13.1.4 Australia
- 13.1.5 South Korea
- 13.1.6 Rest of Asia Pacific
- 14. Middle East and Africa Oncology Molecular Diagnostics Industry Analysis, Insights and Forecast, 2019-2031
- 14.1. Market Analysis, Insights and Forecast - By Country/Sub-region
- 14.1.1 GCC
- 14.1.2 South Africa
- 14.1.3 Rest of Middle East and Africa
- 15. South America Oncology Molecular Diagnostics Industry Analysis, Insights and Forecast, 2019-2031
- 15.1. Market Analysis, Insights and Forecast - By Country/Sub-region
- 15.1.1 Brazil
- 15.1.2 Argentina
- 15.1.3 Rest of South America
- 16. Competitive Analysis
- 16.1. Global Market Share Analysis 2024
- 16.2. Company Profiles
- 16.2.1 Agilient Technologies Inc (Dako)
- 16.2.1.1. Overview
- 16.2.1.2. Products
- 16.2.1.3. SWOT Analysis
- 16.2.1.4. Recent Developments
- 16.2.1.5. Financials (Based on Availability)
- 16.2.2 Danaher Corporation (Cepheid)
- 16.2.2.1. Overview
- 16.2.2.2. Products
- 16.2.2.3. SWOT Analysis
- 16.2.2.4. Recent Developments
- 16.2.2.5. Financials (Based on Availability)
- 16.2.3 QIAGEN*List Not Exhaustive
- 16.2.3.1. Overview
- 16.2.3.2. Products
- 16.2.3.3. SWOT Analysis
- 16.2.3.4. Recent Developments
- 16.2.3.5. Financials (Based on Availability)
- 16.2.4 Veracyte Inc
- 16.2.4.1. Overview
- 16.2.4.2. Products
- 16.2.4.3. SWOT Analysis
- 16.2.4.4. Recent Developments
- 16.2.4.5. Financials (Based on Availability)
- 16.2.5 TBG Diagnostics Limited
- 16.2.5.1. Overview
- 16.2.5.2. Products
- 16.2.5.3. SWOT Analysis
- 16.2.5.4. Recent Developments
- 16.2.5.5. Financials (Based on Availability)
- 16.2.6 HTG Molecular Diagnostics Inc
- 16.2.6.1. Overview
- 16.2.6.2. Products
- 16.2.6.3. SWOT Analysis
- 16.2.6.4. Recent Developments
- 16.2.6.5. Financials (Based on Availability)
- 16.2.7 Thermo Fisher Scientific Inc
- 16.2.7.1. Overview
- 16.2.7.2. Products
- 16.2.7.3. SWOT Analysis
- 16.2.7.4. Recent Developments
- 16.2.7.5. Financials (Based on Availability)
- 16.2.8 Abbott Laboratories
- 16.2.8.1. Overview
- 16.2.8.2. Products
- 16.2.8.3. SWOT Analysis
- 16.2.8.4. Recent Developments
- 16.2.8.5. Financials (Based on Availability)
- 16.2.9 F Hoffmann La-Roche Ltd
- 16.2.9.1. Overview
- 16.2.9.2. Products
- 16.2.9.3. SWOT Analysis
- 16.2.9.4. Recent Developments
- 16.2.9.5. Financials (Based on Availability)
- 16.2.10 bioMérieux SA
- 16.2.10.1. Overview
- 16.2.10.2. Products
- 16.2.10.3. SWOT Analysis
- 16.2.10.4. Recent Developments
- 16.2.10.5. Financials (Based on Availability)
- 16.2.11 Illumina Inc
- 16.2.11.1. Overview
- 16.2.11.2. Products
- 16.2.11.3. SWOT Analysis
- 16.2.11.4. Recent Developments
- 16.2.11.5. Financials (Based on Availability)
- 16.2.12 Sysmex Corporation (Sysmex Europe GmbH)
- 16.2.12.1. Overview
- 16.2.12.2. Products
- 16.2.12.3. SWOT Analysis
- 16.2.12.4. Recent Developments
- 16.2.12.5. Financials (Based on Availability)
- 16.2.1 Agilient Technologies Inc (Dako)
List of Figures
- Figure 1: Global Oncology Molecular Diagnostics Industry Revenue Breakdown (Million, %) by Region 2024 & 2032
- Figure 2: North America Oncology Molecular Diagnostics Industry Revenue (Million), by Country 2024 & 2032
- Figure 3: North America Oncology Molecular Diagnostics Industry Revenue Share (%), by Country 2024 & 2032
- Figure 4: Europe Oncology Molecular Diagnostics Industry Revenue (Million), by Country 2024 & 2032
- Figure 5: Europe Oncology Molecular Diagnostics Industry Revenue Share (%), by Country 2024 & 2032
- Figure 6: Asia Pacific Oncology Molecular Diagnostics Industry Revenue (Million), by Country 2024 & 2032
- Figure 7: Asia Pacific Oncology Molecular Diagnostics Industry Revenue Share (%), by Country 2024 & 2032
- Figure 8: Middle East and Africa Oncology Molecular Diagnostics Industry Revenue (Million), by Country 2024 & 2032
- Figure 9: Middle East and Africa Oncology Molecular Diagnostics Industry Revenue Share (%), by Country 2024 & 2032
- Figure 10: South America Oncology Molecular Diagnostics Industry Revenue (Million), by Country 2024 & 2032
- Figure 11: South America Oncology Molecular Diagnostics Industry Revenue Share (%), by Country 2024 & 2032
- Figure 12: North America Oncology Molecular Diagnostics Industry Revenue (Million), by Product Type 2024 & 2032
- Figure 13: North America Oncology Molecular Diagnostics Industry Revenue Share (%), by Product Type 2024 & 2032
- Figure 14: North America Oncology Molecular Diagnostics Industry Revenue (Million), by Technology Type 2024 & 2032
- Figure 15: North America Oncology Molecular Diagnostics Industry Revenue Share (%), by Technology Type 2024 & 2032
- Figure 16: North America Oncology Molecular Diagnostics Industry Revenue (Million), by Application Type 2024 & 2032
- Figure 17: North America Oncology Molecular Diagnostics Industry Revenue Share (%), by Application Type 2024 & 2032
- Figure 18: North America Oncology Molecular Diagnostics Industry Revenue (Million), by End User 2024 & 2032
- Figure 19: North America Oncology Molecular Diagnostics Industry Revenue Share (%), by End User 2024 & 2032
- Figure 20: North America Oncology Molecular Diagnostics Industry Revenue (Million), by Country 2024 & 2032
- Figure 21: North America Oncology Molecular Diagnostics Industry Revenue Share (%), by Country 2024 & 2032
- Figure 22: Europe Oncology Molecular Diagnostics Industry Revenue (Million), by Product Type 2024 & 2032
- Figure 23: Europe Oncology Molecular Diagnostics Industry Revenue Share (%), by Product Type 2024 & 2032
- Figure 24: Europe Oncology Molecular Diagnostics Industry Revenue (Million), by Technology Type 2024 & 2032
- Figure 25: Europe Oncology Molecular Diagnostics Industry Revenue Share (%), by Technology Type 2024 & 2032
- Figure 26: Europe Oncology Molecular Diagnostics Industry Revenue (Million), by Application Type 2024 & 2032
- Figure 27: Europe Oncology Molecular Diagnostics Industry Revenue Share (%), by Application Type 2024 & 2032
- Figure 28: Europe Oncology Molecular Diagnostics Industry Revenue (Million), by End User 2024 & 2032
- Figure 29: Europe Oncology Molecular Diagnostics Industry Revenue Share (%), by End User 2024 & 2032
- Figure 30: Europe Oncology Molecular Diagnostics Industry Revenue (Million), by Country 2024 & 2032
- Figure 31: Europe Oncology Molecular Diagnostics Industry Revenue Share (%), by Country 2024 & 2032
- Figure 32: Asia Pacific Oncology Molecular Diagnostics Industry Revenue (Million), by Product Type 2024 & 2032
- Figure 33: Asia Pacific Oncology Molecular Diagnostics Industry Revenue Share (%), by Product Type 2024 & 2032
- Figure 34: Asia Pacific Oncology Molecular Diagnostics Industry Revenue (Million), by Technology Type 2024 & 2032
- Figure 35: Asia Pacific Oncology Molecular Diagnostics Industry Revenue Share (%), by Technology Type 2024 & 2032
- Figure 36: Asia Pacific Oncology Molecular Diagnostics Industry Revenue (Million), by Application Type 2024 & 2032
- Figure 37: Asia Pacific Oncology Molecular Diagnostics Industry Revenue Share (%), by Application Type 2024 & 2032
- Figure 38: Asia Pacific Oncology Molecular Diagnostics Industry Revenue (Million), by End User 2024 & 2032
- Figure 39: Asia Pacific Oncology Molecular Diagnostics Industry Revenue Share (%), by End User 2024 & 2032
- Figure 40: Asia Pacific Oncology Molecular Diagnostics Industry Revenue (Million), by Country 2024 & 2032
- Figure 41: Asia Pacific Oncology Molecular Diagnostics Industry Revenue Share (%), by Country 2024 & 2032
- Figure 42: Middle East and Africa Oncology Molecular Diagnostics Industry Revenue (Million), by Product Type 2024 & 2032
- Figure 43: Middle East and Africa Oncology Molecular Diagnostics Industry Revenue Share (%), by Product Type 2024 & 2032
- Figure 44: Middle East and Africa Oncology Molecular Diagnostics Industry Revenue (Million), by Technology Type 2024 & 2032
- Figure 45: Middle East and Africa Oncology Molecular Diagnostics Industry Revenue Share (%), by Technology Type 2024 & 2032
- Figure 46: Middle East and Africa Oncology Molecular Diagnostics Industry Revenue (Million), by Application Type 2024 & 2032
- Figure 47: Middle East and Africa Oncology Molecular Diagnostics Industry Revenue Share (%), by Application Type 2024 & 2032
- Figure 48: Middle East and Africa Oncology Molecular Diagnostics Industry Revenue (Million), by End User 2024 & 2032
- Figure 49: Middle East and Africa Oncology Molecular Diagnostics Industry Revenue Share (%), by End User 2024 & 2032
- Figure 50: Middle East and Africa Oncology Molecular Diagnostics Industry Revenue (Million), by Country 2024 & 2032
- Figure 51: Middle East and Africa Oncology Molecular Diagnostics Industry Revenue Share (%), by Country 2024 & 2032
- Figure 52: South America Oncology Molecular Diagnostics Industry Revenue (Million), by Product Type 2024 & 2032
- Figure 53: South America Oncology Molecular Diagnostics Industry Revenue Share (%), by Product Type 2024 & 2032
- Figure 54: South America Oncology Molecular Diagnostics Industry Revenue (Million), by Technology Type 2024 & 2032
- Figure 55: South America Oncology Molecular Diagnostics Industry Revenue Share (%), by Technology Type 2024 & 2032
- Figure 56: South America Oncology Molecular Diagnostics Industry Revenue (Million), by Application Type 2024 & 2032
- Figure 57: South America Oncology Molecular Diagnostics Industry Revenue Share (%), by Application Type 2024 & 2032
- Figure 58: South America Oncology Molecular Diagnostics Industry Revenue (Million), by End User 2024 & 2032
- Figure 59: South America Oncology Molecular Diagnostics Industry Revenue Share (%), by End User 2024 & 2032
- Figure 60: South America Oncology Molecular Diagnostics Industry Revenue (Million), by Country 2024 & 2032
- Figure 61: South America Oncology Molecular Diagnostics Industry Revenue Share (%), by Country 2024 & 2032
List of Tables
- Table 1: Global Oncology Molecular Diagnostics Industry Revenue Million Forecast, by Region 2019 & 2032
- Table 2: Global Oncology Molecular Diagnostics Industry Revenue Million Forecast, by Product Type 2019 & 2032
- Table 3: Global Oncology Molecular Diagnostics Industry Revenue Million Forecast, by Technology Type 2019 & 2032
- Table 4: Global Oncology Molecular Diagnostics Industry Revenue Million Forecast, by Application Type 2019 & 2032
- Table 5: Global Oncology Molecular Diagnostics Industry Revenue Million Forecast, by End User 2019 & 2032
- Table 6: Global Oncology Molecular Diagnostics Industry Revenue Million Forecast, by Region 2019 & 2032
- Table 7: Global Oncology Molecular Diagnostics Industry Revenue Million Forecast, by Country 2019 & 2032
- Table 8: United States Oncology Molecular Diagnostics Industry Revenue (Million) Forecast, by Application 2019 & 2032
- Table 9: Canada Oncology Molecular Diagnostics Industry Revenue (Million) Forecast, by Application 2019 & 2032
- Table 10: Mexico Oncology Molecular Diagnostics Industry Revenue (Million) Forecast, by Application 2019 & 2032
- Table 11: Global Oncology Molecular Diagnostics Industry Revenue Million Forecast, by Country 2019 & 2032
- Table 12: Germany Oncology Molecular Diagnostics Industry Revenue (Million) Forecast, by Application 2019 & 2032
- Table 13: United Kingdom Oncology Molecular Diagnostics Industry Revenue (Million) Forecast, by Application 2019 & 2032
- Table 14: France Oncology Molecular Diagnostics Industry Revenue (Million) Forecast, by Application 2019 & 2032
- Table 15: Italy Oncology Molecular Diagnostics Industry Revenue (Million) Forecast, by Application 2019 & 2032
- Table 16: Spain Oncology Molecular Diagnostics Industry Revenue (Million) Forecast, by Application 2019 & 2032
- Table 17: Rest of Europe Oncology Molecular Diagnostics Industry Revenue (Million) Forecast, by Application 2019 & 2032
- Table 18: Global Oncology Molecular Diagnostics Industry Revenue Million Forecast, by Country 2019 & 2032
- Table 19: China Oncology Molecular Diagnostics Industry Revenue (Million) Forecast, by Application 2019 & 2032
- Table 20: Japan Oncology Molecular Diagnostics Industry Revenue (Million) Forecast, by Application 2019 & 2032
- Table 21: India Oncology Molecular Diagnostics Industry Revenue (Million) Forecast, by Application 2019 & 2032
- Table 22: Australia Oncology Molecular Diagnostics Industry Revenue (Million) Forecast, by Application 2019 & 2032
- Table 23: South Korea Oncology Molecular Diagnostics Industry Revenue (Million) Forecast, by Application 2019 & 2032
- Table 24: Rest of Asia Pacific Oncology Molecular Diagnostics Industry Revenue (Million) Forecast, by Application 2019 & 2032
- Table 25: Global Oncology Molecular Diagnostics Industry Revenue Million Forecast, by Country 2019 & 2032
- Table 26: GCC Oncology Molecular Diagnostics Industry Revenue (Million) Forecast, by Application 2019 & 2032
- Table 27: South Africa Oncology Molecular Diagnostics Industry Revenue (Million) Forecast, by Application 2019 & 2032
- Table 28: Rest of Middle East and Africa Oncology Molecular Diagnostics Industry Revenue (Million) Forecast, by Application 2019 & 2032
- Table 29: Global Oncology Molecular Diagnostics Industry Revenue Million Forecast, by Country 2019 & 2032
- Table 30: Brazil Oncology Molecular Diagnostics Industry Revenue (Million) Forecast, by Application 2019 & 2032
- Table 31: Argentina Oncology Molecular Diagnostics Industry Revenue (Million) Forecast, by Application 2019 & 2032
- Table 32: Rest of South America Oncology Molecular Diagnostics Industry Revenue (Million) Forecast, by Application 2019 & 2032
- Table 33: Global Oncology Molecular Diagnostics Industry Revenue Million Forecast, by Product Type 2019 & 2032
- Table 34: Global Oncology Molecular Diagnostics Industry Revenue Million Forecast, by Technology Type 2019 & 2032
- Table 35: Global Oncology Molecular Diagnostics Industry Revenue Million Forecast, by Application Type 2019 & 2032
- Table 36: Global Oncology Molecular Diagnostics Industry Revenue Million Forecast, by End User 2019 & 2032
- Table 37: Global Oncology Molecular Diagnostics Industry Revenue Million Forecast, by Country 2019 & 2032
- Table 38: United States Oncology Molecular Diagnostics Industry Revenue (Million) Forecast, by Application 2019 & 2032
- Table 39: Canada Oncology Molecular Diagnostics Industry Revenue (Million) Forecast, by Application 2019 & 2032
- Table 40: Mexico Oncology Molecular Diagnostics Industry Revenue (Million) Forecast, by Application 2019 & 2032
- Table 41: Global Oncology Molecular Diagnostics Industry Revenue Million Forecast, by Product Type 2019 & 2032
- Table 42: Global Oncology Molecular Diagnostics Industry Revenue Million Forecast, by Technology Type 2019 & 2032
- Table 43: Global Oncology Molecular Diagnostics Industry Revenue Million Forecast, by Application Type 2019 & 2032
- Table 44: Global Oncology Molecular Diagnostics Industry Revenue Million Forecast, by End User 2019 & 2032
- Table 45: Global Oncology Molecular Diagnostics Industry Revenue Million Forecast, by Country 2019 & 2032
- Table 46: Germany Oncology Molecular Diagnostics Industry Revenue (Million) Forecast, by Application 2019 & 2032
- Table 47: United Kingdom Oncology Molecular Diagnostics Industry Revenue (Million) Forecast, by Application 2019 & 2032
- Table 48: France Oncology Molecular Diagnostics Industry Revenue (Million) Forecast, by Application 2019 & 2032
- Table 49: Italy Oncology Molecular Diagnostics Industry Revenue (Million) Forecast, by Application 2019 & 2032
- Table 50: Spain Oncology Molecular Diagnostics Industry Revenue (Million) Forecast, by Application 2019 & 2032
- Table 51: Rest of Europe Oncology Molecular Diagnostics Industry Revenue (Million) Forecast, by Application 2019 & 2032
- Table 52: Global Oncology Molecular Diagnostics Industry Revenue Million Forecast, by Product Type 2019 & 2032
- Table 53: Global Oncology Molecular Diagnostics Industry Revenue Million Forecast, by Technology Type 2019 & 2032
- Table 54: Global Oncology Molecular Diagnostics Industry Revenue Million Forecast, by Application Type 2019 & 2032
- Table 55: Global Oncology Molecular Diagnostics Industry Revenue Million Forecast, by End User 2019 & 2032
- Table 56: Global Oncology Molecular Diagnostics Industry Revenue Million Forecast, by Country 2019 & 2032
- Table 57: China Oncology Molecular Diagnostics Industry Revenue (Million) Forecast, by Application 2019 & 2032
- Table 58: Japan Oncology Molecular Diagnostics Industry Revenue (Million) Forecast, by Application 2019 & 2032
- Table 59: India Oncology Molecular Diagnostics Industry Revenue (Million) Forecast, by Application 2019 & 2032
- Table 60: Australia Oncology Molecular Diagnostics Industry Revenue (Million) Forecast, by Application 2019 & 2032
- Table 61: South Korea Oncology Molecular Diagnostics Industry Revenue (Million) Forecast, by Application 2019 & 2032
- Table 62: Rest of Asia Pacific Oncology Molecular Diagnostics Industry Revenue (Million) Forecast, by Application 2019 & 2032
- Table 63: Global Oncology Molecular Diagnostics Industry Revenue Million Forecast, by Product Type 2019 & 2032
- Table 64: Global Oncology Molecular Diagnostics Industry Revenue Million Forecast, by Technology Type 2019 & 2032
- Table 65: Global Oncology Molecular Diagnostics Industry Revenue Million Forecast, by Application Type 2019 & 2032
- Table 66: Global Oncology Molecular Diagnostics Industry Revenue Million Forecast, by End User 2019 & 2032
- Table 67: Global Oncology Molecular Diagnostics Industry Revenue Million Forecast, by Country 2019 & 2032
- Table 68: GCC Oncology Molecular Diagnostics Industry Revenue (Million) Forecast, by Application 2019 & 2032
- Table 69: South Africa Oncology Molecular Diagnostics Industry Revenue (Million) Forecast, by Application 2019 & 2032
- Table 70: Rest of Middle East and Africa Oncology Molecular Diagnostics Industry Revenue (Million) Forecast, by Application 2019 & 2032
- Table 71: Global Oncology Molecular Diagnostics Industry Revenue Million Forecast, by Product Type 2019 & 2032
- Table 72: Global Oncology Molecular Diagnostics Industry Revenue Million Forecast, by Technology Type 2019 & 2032
- Table 73: Global Oncology Molecular Diagnostics Industry Revenue Million Forecast, by Application Type 2019 & 2032
- Table 74: Global Oncology Molecular Diagnostics Industry Revenue Million Forecast, by End User 2019 & 2032
- Table 75: Global Oncology Molecular Diagnostics Industry Revenue Million Forecast, by Country 2019 & 2032
- Table 76: Brazil Oncology Molecular Diagnostics Industry Revenue (Million) Forecast, by Application 2019 & 2032
- Table 77: Argentina Oncology Molecular Diagnostics Industry Revenue (Million) Forecast, by Application 2019 & 2032
- Table 78: Rest of South America Oncology Molecular Diagnostics Industry Revenue (Million) Forecast, by Application 2019 & 2032
Frequently Asked Questions
1. What is the projected Compound Annual Growth Rate (CAGR) of the Oncology Molecular Diagnostics Industry?
The projected CAGR is approximately > 12.00%.
2. Which companies are prominent players in the Oncology Molecular Diagnostics Industry?
Key companies in the market include Agilient Technologies Inc (Dako), Danaher Corporation (Cepheid), QIAGEN*List Not Exhaustive, Veracyte Inc, TBG Diagnostics Limited, HTG Molecular Diagnostics Inc, Thermo Fisher Scientific Inc, Abbott Laboratories, F Hoffmann La-Roche Ltd, bioMérieux SA, Illumina Inc, Sysmex Corporation (Sysmex Europe GmbH).
3. What are the main segments of the Oncology Molecular Diagnostics Industry?
The market segments include Product Type, Technology Type, Application Type, End User.
4. Can you provide details about the market size?
The market size is estimated to be USD XX Million as of 2022.
5. What are some drivers contributing to market growth?
Rising Prevalence of Cancer Worldwide; Technological Advancements in Diagnostic Testing; Increasing Demand for Point-of-care Treatment.
6. What are the notable trends driving market growth?
Polymerase Chain Reaction (PCR) is Anticipated to Observe a Significant Growth.
7. Are there any restraints impacting market growth?
High Cost of Molecular Diagnostic Tests; Lack of Skilled Workforce and Stringent Regulatory Framework.
8. Can you provide examples of recent developments in the market?
N/A
9. What pricing options are available for accessing the report?
Pricing options include single-user, multi-user, and enterprise licenses priced at USD 4750, USD 5250, and USD 8750 respectively.
10. Is the market size provided in terms of value or volume?
The market size is provided in terms of value, measured in Million.
11. Are there any specific market keywords associated with the report?
Yes, the market keyword associated with the report is "Oncology Molecular Diagnostics Industry," which aids in identifying and referencing the specific market segment covered.
12. How do I determine which pricing option suits my needs best?
The pricing options vary based on user requirements and access needs. Individual users may opt for single-user licenses, while businesses requiring broader access may choose multi-user or enterprise licenses for cost-effective access to the report.
13. Are there any additional resources or data provided in the Oncology Molecular Diagnostics Industry report?
While the report offers comprehensive insights, it's advisable to review the specific contents or supplementary materials provided to ascertain if additional resources or data are available.
14. How can I stay updated on further developments or reports in the Oncology Molecular Diagnostics Industry?
To stay informed about further developments, trends, and reports in the Oncology Molecular Diagnostics Industry, consider subscribing to industry newsletters, following relevant companies and organizations, or regularly checking reputable industry news sources and publications.
Methodology
Step 1 - Identification of Relevant Samples Size from Population Database


Step 2 - Approaches for Defining Global Market Size (Value, Volume* & Price*)

Note*: In applicable scenarios
Step 3 - Data Sources
Primary Research
- Web Analytics
- Survey Reports
- Research Institute
- Latest Research Reports
- Opinion Leaders
Secondary Research
- Annual Reports
- White Paper
- Latest Press Release
- Industry Association
- Paid Database
- Investor Presentations

Step 4 - Data Triangulation
Involves using different sources of information in order to increase the validity of a study
These sources are likely to be stakeholders in a program - participants, other researchers, program staff, other community members, and so on.
Then we put all data in single framework & apply various statistical tools to find out the dynamic on the market.
During the analysis stage, feedback from the stakeholder groups would be compared to determine areas of agreement as well as areas of divergence


