
Key Insights
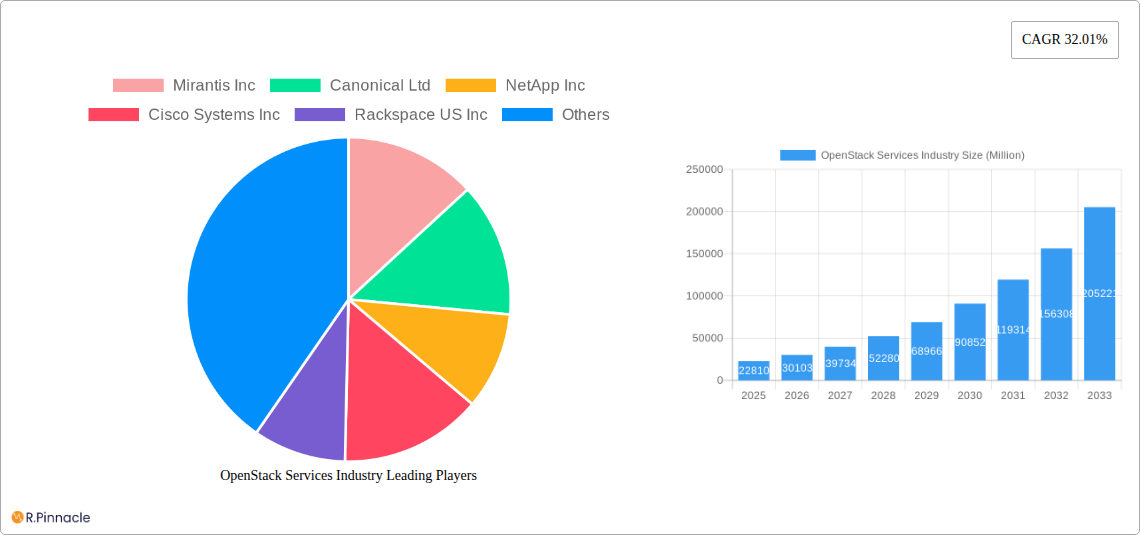
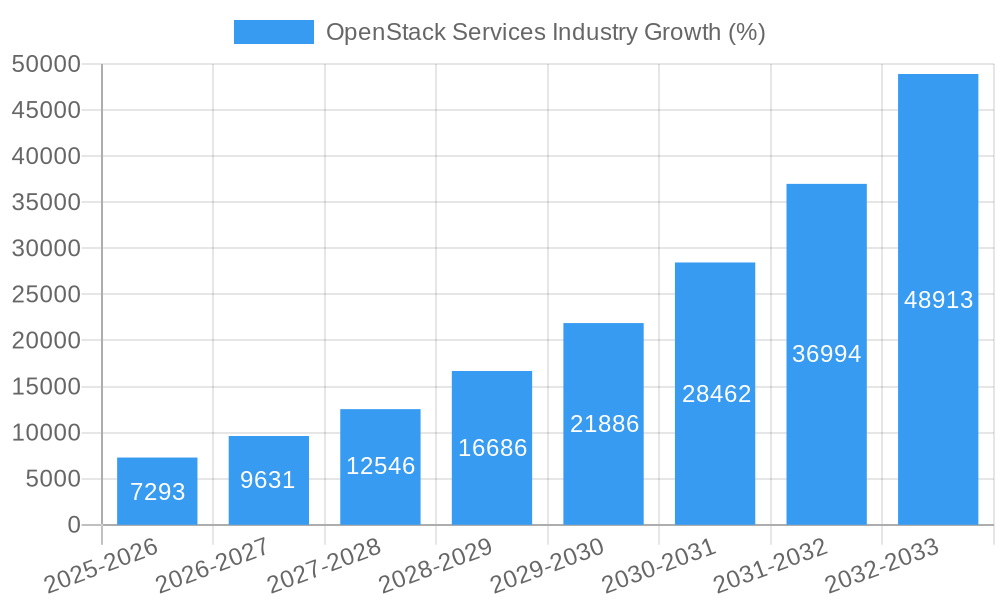
The OpenStack services market, valued at $22.81 billion in 2025, is experiencing robust growth, projected to expand at a compound annual growth rate (CAGR) of 32.01% from 2025 to 2033. This rapid expansion is fueled by several key drivers. The increasing adoption of cloud-native applications and microservices architectures necessitates flexible and scalable infrastructure solutions, which OpenStack effectively provides. Furthermore, the rising demand for hybrid cloud deployments, combining on-premise and cloud resources, is bolstering OpenStack's appeal. Organizations across diverse sectors, including information technology, telecommunications, banking and financial services, and retail/e-commerce, are leveraging OpenStack to enhance agility, reduce IT costs, and improve operational efficiency. The preference for on-cloud deployment models is contributing significantly to market growth, driven by scalability and reduced upfront infrastructure investments. However, the market also faces certain restraints, such as the complexity of OpenStack implementation and the need for skilled professionals, potentially hindering widespread adoption among smaller enterprises. Competitive pressures from established cloud providers and the emergence of alternative open-source solutions also pose challenges to market growth. Nevertheless, the overall market outlook remains positive, driven by the increasing adoption of hybrid and multi-cloud strategies, underpinning consistent growth in the coming years.
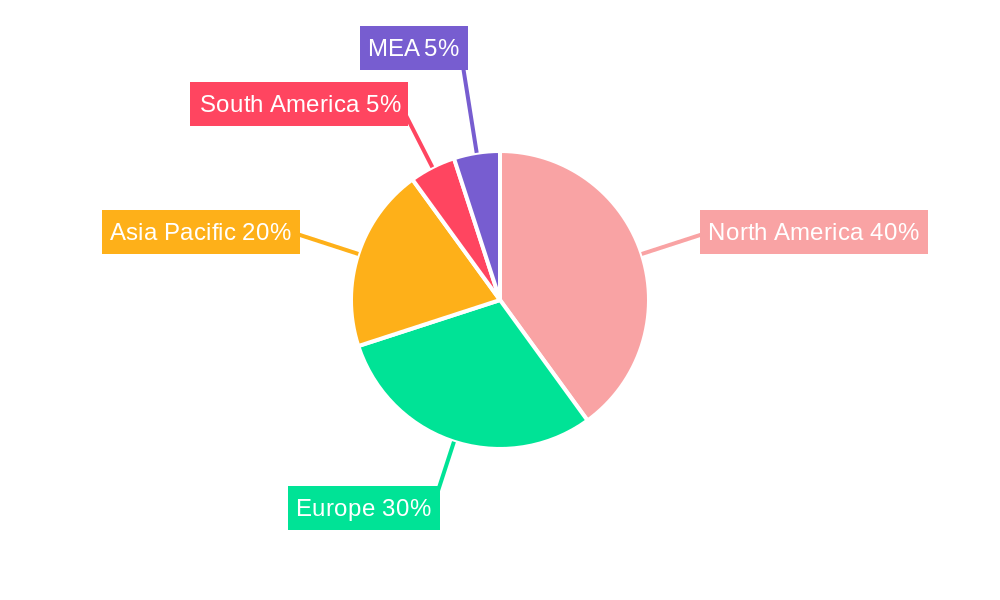
The geographical distribution of the OpenStack services market demonstrates significant regional variations. North America currently holds a substantial market share, primarily due to the high concentration of technology companies and early adoption of cloud technologies. Europe and Asia-Pacific regions are also witnessing rapid growth, driven by increasing digital transformation initiatives and government investments in infrastructure development. While North America retains its leadership, the Asia-Pacific region is expected to show significant growth over the forecast period, driven by burgeoning economies like China and India. The South America and MEA regions, although exhibiting slower growth initially, are projected to gain momentum in the coming years, fueled by expanding digital infrastructure and increasing cloud adoption across various industry verticals. Key players like Mirantis Inc., Canonical Ltd., NetApp Inc., and VMware Inc. are actively shaping the market landscape through continuous innovation and strategic partnerships, driving both market growth and competitive dynamics.
OpenStack Services Industry Market Report: 2019-2033
This comprehensive report provides an in-depth analysis of the OpenStack Services industry, projecting a market value exceeding $XX Million by 2033. The report covers the period from 2019 to 2033, with a focus on the 2025-2033 forecast period. It offers invaluable insights for industry professionals, investors, and strategists seeking to understand and navigate this dynamic market. Key players such as Mirantis Inc, Canonical Ltd, NetApp Inc, Cisco Systems Inc, Rackspace US Inc, Hewlett Packard Enterprise Development LP, Red Hat Inc, Dell Inc, Huawei Technologies Co Ltd, and VMware Inc are analyzed, providing a comprehensive overview of the competitive landscape.
OpenStack Services Industry Market Structure & Innovation Trends
The OpenStack services market exhibits a moderately consolidated structure, with a few major players holding significant market share. Mirantis Inc, Red Hat Inc, and VMware Inc are among the leading players, collectively controlling approximately xx% of the market in 2025. However, several smaller, specialized companies also contribute significantly. The market is characterized by continuous innovation driven by the need for greater scalability, security, and cost-effectiveness in cloud infrastructure. Regulatory frameworks, particularly concerning data privacy and security, significantly influence market dynamics. The industry also faces competition from alternative cloud platforms like AWS and Azure, representing key product substitutes. The end-user demographic is diverse, spanning IT, telecom, banking, academia, and retail/e-commerce sectors. M&A activity has been moderate in recent years, with deal values ranging from $XX Million to $XX Million, reflecting consolidation trends within the sector.
- Market Concentration: Moderately consolidated, with top 3 players holding xx% market share (2025).
- Innovation Drivers: Scalability, security, cost-effectiveness.
- Regulatory Framework: Data privacy and security regulations are key influences.
- Product Substitutes: AWS, Azure, and other public cloud providers.
- M&A Activity: Moderate activity with deals valued between $XX Million and $XX Million.
OpenStack Services Industry Market Dynamics & Trends
The OpenStack services market is projected to experience a Compound Annual Growth Rate (CAGR) of xx% during the forecast period (2025-2033), driven by the increasing adoption of cloud computing across various industries. Technological disruptions, such as the rise of containerization and serverless computing, are reshaping the market landscape. Consumer preferences are shifting towards flexible, scalable, and secure cloud solutions, fueling demand for OpenStack services. Competitive dynamics are intense, with existing players continuously innovating and new entrants emerging. Market penetration is expected to increase significantly in developing economies, driven by improved digital infrastructure and increasing adoption of cloud-based solutions. Increased demand from the Information Technology sector is expected to be a major growth driver, increasing market penetration to xx% by 2033.
Dominant Regions & Segments in OpenStack Services Industry
North America currently dominates the OpenStack services market, followed by Europe and Asia Pacific. This dominance is attributed to factors such as strong IT infrastructure, high adoption rates of cloud technologies, and the presence of major players.
- North America: High adoption of cloud technologies, strong IT infrastructure.
- Europe: Growing cloud adoption, stringent data privacy regulations.
- Asia Pacific: Rapid economic growth, increasing digitalization.
By End-user Industry: The Information Technology sector is the largest segment, accounting for xx% of the market in 2025. Telecommunication and Banking & Financial Services sectors also show strong growth potential.
- Information Technology: High demand for scalable and secure infrastructure.
- Telecommunication: Need for robust network management and virtualization.
- Banking and Financial Services: Strict regulatory compliance needs, and high security demands.
- Academic: Growing adoption of cloud solutions for research and education.
- Retail/E-commerce: Demand for scalable infrastructure to handle peak loads.
By Deployment Model: On-premise deployment remains dominant in 2025, but On-cloud deployment is experiencing rapid growth, driven by ease of use and cost-effectiveness.
- On-Premise: Existing infrastructure and security concerns.
- On-Cloud: Scalability, cost-efficiency, and ease of management.
OpenStack Services Industry Product Innovations
Recent innovations in OpenStack focus on enhancing scalability, security, and ease of use. This includes advancements in container orchestration, improved automation tools, and enhanced security features. These innovations aim to improve the overall user experience and expand the applicability of OpenStack across various use cases. The increased integration with other technologies such as Kubernetes also enhances the platforms' competitive advantage.
Report Scope & Segmentation Analysis
This report segments the OpenStack services market by end-user industry (Information Technology, Telecommunication, Banking and Financial Services, Academic, Retail/E-commerce) and deployment model (On-cloud, On-premise). Each segment's growth projections, market size, and competitive dynamics are analyzed. The market size for each segment is projected to grow exponentially over the forecast period with the IT and Telecommunications sectors seeing the greatest rate of growth.
Key Drivers of OpenStack Services Industry Growth
The growth of the OpenStack services industry is driven by several factors. The increasing adoption of cloud computing across various industries is a major driver. Government initiatives promoting digital transformation are also creating opportunities for growth. Furthermore, the need for cost-effective and scalable IT infrastructure is driving adoption.
Challenges in the OpenStack Services Industry Sector
The OpenStack services industry faces challenges such as the complexity of the platform, competition from other cloud providers, and the need for skilled professionals. These factors can hinder adoption and market growth. The high cost of implementation compared to other cloud solutions can also be a barrier.
Emerging Opportunities in OpenStack Services Industry
Emerging opportunities include the integration of OpenStack with other technologies like AI and machine learning, the expansion into new markets such as IoT, and the adoption of edge computing. These trends are creating new growth avenues for the industry.
Leading Players in the OpenStack Services Industry Market
- Mirantis Inc
- Canonical Ltd
- NetApp Inc
- Cisco Systems Inc
- Rackspace US Inc
- Hewlett Packard Enterprise Development LP
- Red Hat Inc
- Dell Inc
- Huawei Technologies Co Ltd
- VMware Inc
Key Developments in OpenStack Services Industry Industry
- October 2023: UNICC partners with Canonical to build a secure private cloud environment for the UN system.
- September 2022: Red Hat releases a new version of its OpenStack platform with enhanced telecom operator capabilities.
- June 2022: VEXXHOST Inc. launches Atmosphere, an open-source tool for deploying OpenStack environments.
Future Outlook for OpenStack Services Industry Market
The OpenStack services market is poised for continued growth, driven by increasing cloud adoption, technological advancements, and the expansion into new markets. Strategic partnerships and collaborations will play a crucial role in shaping the future of the industry. The market is expected to continue to grow at a CAGR of xx% during the forecast period, fueled by innovative solutions and rising global demand.
OpenStack Services Industry Segmentation
-
1. Deployment Model
- 1.1. On-Cloud
- 1.2. On-Premise
-
2. End-user Industry
- 2.1. Information Technology
- 2.2. Telecommunication
- 2.3. Banking and Financial Services
- 2.4. Academic
- 2.5. Retail/E-Commerce
OpenStack Services Industry Segmentation By Geography
- 1. North America
- 2. Europe
- 3. Asia
- 4. Latin America
- 5. Middle East and Africa
OpenStack Services Industry REPORT HIGHLIGHTS
| Aspects | Details |
|---|---|
| Study Period | 2019-2033 |
| Base Year | 2024 |
| Estimated Year | 2025 |
| Forecast Period | 2025-2033 |
| Historical Period | 2019-2024 |
| Growth Rate | CAGR of 32.01% from 2019-2033 |
| Segmentation |
|
Table of Contents
- 1. Introduction
- 1.1. Research Scope
- 1.2. Market Segmentation
- 1.3. Research Methodology
- 1.4. Definitions and Assumptions
- 2. Executive Summary
- 2.1. Introduction
- 3. Market Dynamics
- 3.1. Introduction
- 3.2. Market Drivers
- 3.2.1. Increasing Need for Organizations to Improve Their Business Agility and Efficiency; OpenStack Being Open Source Provides the Flexibility for Customized Solution; Increasing use of OpenStack Services in Telecommunication Sector
- 3.3. Market Restrains
- 3.3.1 Lack of Robustness that Enterprises Desire for Their Data Centers
- 3.3.2 Including IT Management Features
- 3.3.3 Such as Availability and Security
- 3.4. Market Trends
- 3.4.1. Increasing use of OpenStack Services in Telecommunication Sector is Driving the Market
- 4. Market Factor Analysis
- 4.1. Porters Five Forces
- 4.2. Supply/Value Chain
- 4.3. PESTEL analysis
- 4.4. Market Entropy
- 4.5. Patent/Trademark Analysis
- 5. Global OpenStack Services Industry Analysis, Insights and Forecast, 2019-2031
- 5.1. Market Analysis, Insights and Forecast - by Deployment Model
- 5.1.1. On-Cloud
- 5.1.2. On-Premise
- 5.2. Market Analysis, Insights and Forecast - by End-user Industry
- 5.2.1. Information Technology
- 5.2.2. Telecommunication
- 5.2.3. Banking and Financial Services
- 5.2.4. Academic
- 5.2.5. Retail/E-Commerce
- 5.3. Market Analysis, Insights and Forecast - by Region
- 5.3.1. North America
- 5.3.2. Europe
- 5.3.3. Asia
- 5.3.4. Latin America
- 5.3.5. Middle East and Africa
- 5.1. Market Analysis, Insights and Forecast - by Deployment Model
- 6. North America OpenStack Services Industry Analysis, Insights and Forecast, 2019-2031
- 6.1. Market Analysis, Insights and Forecast - by Deployment Model
- 6.1.1. On-Cloud
- 6.1.2. On-Premise
- 6.2. Market Analysis, Insights and Forecast - by End-user Industry
- 6.2.1. Information Technology
- 6.2.2. Telecommunication
- 6.2.3. Banking and Financial Services
- 6.2.4. Academic
- 6.2.5. Retail/E-Commerce
- 6.1. Market Analysis, Insights and Forecast - by Deployment Model
- 7. Europe OpenStack Services Industry Analysis, Insights and Forecast, 2019-2031
- 7.1. Market Analysis, Insights and Forecast - by Deployment Model
- 7.1.1. On-Cloud
- 7.1.2. On-Premise
- 7.2. Market Analysis, Insights and Forecast - by End-user Industry
- 7.2.1. Information Technology
- 7.2.2. Telecommunication
- 7.2.3. Banking and Financial Services
- 7.2.4. Academic
- 7.2.5. Retail/E-Commerce
- 7.1. Market Analysis, Insights and Forecast - by Deployment Model
- 8. Asia OpenStack Services Industry Analysis, Insights and Forecast, 2019-2031
- 8.1. Market Analysis, Insights and Forecast - by Deployment Model
- 8.1.1. On-Cloud
- 8.1.2. On-Premise
- 8.2. Market Analysis, Insights and Forecast - by End-user Industry
- 8.2.1. Information Technology
- 8.2.2. Telecommunication
- 8.2.3. Banking and Financial Services
- 8.2.4. Academic
- 8.2.5. Retail/E-Commerce
- 8.1. Market Analysis, Insights and Forecast - by Deployment Model
- 9. Latin America OpenStack Services Industry Analysis, Insights and Forecast, 2019-2031
- 9.1. Market Analysis, Insights and Forecast - by Deployment Model
- 9.1.1. On-Cloud
- 9.1.2. On-Premise
- 9.2. Market Analysis, Insights and Forecast - by End-user Industry
- 9.2.1. Information Technology
- 9.2.2. Telecommunication
- 9.2.3. Banking and Financial Services
- 9.2.4. Academic
- 9.2.5. Retail/E-Commerce
- 9.1. Market Analysis, Insights and Forecast - by Deployment Model
- 10. Middle East and Africa OpenStack Services Industry Analysis, Insights and Forecast, 2019-2031
- 10.1. Market Analysis, Insights and Forecast - by Deployment Model
- 10.1.1. On-Cloud
- 10.1.2. On-Premise
- 10.2. Market Analysis, Insights and Forecast - by End-user Industry
- 10.2.1. Information Technology
- 10.2.2. Telecommunication
- 10.2.3. Banking and Financial Services
- 10.2.4. Academic
- 10.2.5. Retail/E-Commerce
- 10.1. Market Analysis, Insights and Forecast - by Deployment Model
- 11. North America OpenStack Services Industry Analysis, Insights and Forecast, 2019-2031
- 11.1. Market Analysis, Insights and Forecast - By Country/Sub-region
- 11.1.1 United States
- 11.1.2 Canada
- 11.1.3 Mexico
- 12. Europe OpenStack Services Industry Analysis, Insights and Forecast, 2019-2031
- 12.1. Market Analysis, Insights and Forecast - By Country/Sub-region
- 12.1.1 Germany
- 12.1.2 United Kingdom
- 12.1.3 France
- 12.1.4 Spain
- 12.1.5 Italy
- 12.1.6 Spain
- 12.1.7 Belgium
- 12.1.8 Netherland
- 12.1.9 Nordics
- 12.1.10 Rest of Europe
- 13. Asia Pacific OpenStack Services Industry Analysis, Insights and Forecast, 2019-2031
- 13.1. Market Analysis, Insights and Forecast - By Country/Sub-region
- 13.1.1 China
- 13.1.2 Japan
- 13.1.3 India
- 13.1.4 South Korea
- 13.1.5 Southeast Asia
- 13.1.6 Australia
- 13.1.7 Indonesia
- 13.1.8 Phillipes
- 13.1.9 Singapore
- 13.1.10 Thailandc
- 13.1.11 Rest of Asia Pacific
- 14. South America OpenStack Services Industry Analysis, Insights and Forecast, 2019-2031
- 14.1. Market Analysis, Insights and Forecast - By Country/Sub-region
- 14.1.1 Brazil
- 14.1.2 Argentina
- 14.1.3 Peru
- 14.1.4 Chile
- 14.1.5 Colombia
- 14.1.6 Ecuador
- 14.1.7 Venezuela
- 14.1.8 Rest of South America
- 15. North America OpenStack Services Industry Analysis, Insights and Forecast, 2019-2031
- 15.1. Market Analysis, Insights and Forecast - By Country/Sub-region
- 15.1.1 United States
- 15.1.2 Canada
- 15.1.3 Mexico
- 16. MEA OpenStack Services Industry Analysis, Insights and Forecast, 2019-2031
- 16.1. Market Analysis, Insights and Forecast - By Country/Sub-region
- 16.1.1 United Arab Emirates
- 16.1.2 Saudi Arabia
- 16.1.3 South Africa
- 16.1.4 Rest of Middle East and Africa
- 17. Competitive Analysis
- 17.1. Global Market Share Analysis 2024
- 17.2. Company Profiles
- 17.2.1 Mirantis Inc
- 17.2.1.1. Overview
- 17.2.1.2. Products
- 17.2.1.3. SWOT Analysis
- 17.2.1.4. Recent Developments
- 17.2.1.5. Financials (Based on Availability)
- 17.2.2 Canonical Ltd
- 17.2.2.1. Overview
- 17.2.2.2. Products
- 17.2.2.3. SWOT Analysis
- 17.2.2.4. Recent Developments
- 17.2.2.5. Financials (Based on Availability)
- 17.2.3 NetApp Inc
- 17.2.3.1. Overview
- 17.2.3.2. Products
- 17.2.3.3. SWOT Analysis
- 17.2.3.4. Recent Developments
- 17.2.3.5. Financials (Based on Availability)
- 17.2.4 Cisco Systems Inc
- 17.2.4.1. Overview
- 17.2.4.2. Products
- 17.2.4.3. SWOT Analysis
- 17.2.4.4. Recent Developments
- 17.2.4.5. Financials (Based on Availability)
- 17.2.5 Rackspace US Inc
- 17.2.5.1. Overview
- 17.2.5.2. Products
- 17.2.5.3. SWOT Analysis
- 17.2.5.4. Recent Developments
- 17.2.5.5. Financials (Based on Availability)
- 17.2.6 Hewlett Packard Enterprise Development LP
- 17.2.6.1. Overview
- 17.2.6.2. Products
- 17.2.6.3. SWOT Analysis
- 17.2.6.4. Recent Developments
- 17.2.6.5. Financials (Based on Availability)
- 17.2.7 Red Hat Inc
- 17.2.7.1. Overview
- 17.2.7.2. Products
- 17.2.7.3. SWOT Analysis
- 17.2.7.4. Recent Developments
- 17.2.7.5. Financials (Based on Availability)
- 17.2.8 Dell Inc
- 17.2.8.1. Overview
- 17.2.8.2. Products
- 17.2.8.3. SWOT Analysis
- 17.2.8.4. Recent Developments
- 17.2.8.5. Financials (Based on Availability)
- 17.2.9 Huawei Technologies Co Ltd
- 17.2.9.1. Overview
- 17.2.9.2. Products
- 17.2.9.3. SWOT Analysis
- 17.2.9.4. Recent Developments
- 17.2.9.5. Financials (Based on Availability)
- 17.2.10 VMware Inc
- 17.2.10.1. Overview
- 17.2.10.2. Products
- 17.2.10.3. SWOT Analysis
- 17.2.10.4. Recent Developments
- 17.2.10.5. Financials (Based on Availability)
- 17.2.1 Mirantis Inc
List of Figures
- Figure 1: Global OpenStack Services Industry Revenue Breakdown (Million, %) by Region 2024 & 2032
- Figure 2: North America OpenStack Services Industry Revenue (Million), by Country 2024 & 2032
- Figure 3: North America OpenStack Services Industry Revenue Share (%), by Country 2024 & 2032
- Figure 4: Europe OpenStack Services Industry Revenue (Million), by Country 2024 & 2032
- Figure 5: Europe OpenStack Services Industry Revenue Share (%), by Country 2024 & 2032
- Figure 6: Asia Pacific OpenStack Services Industry Revenue (Million), by Country 2024 & 2032
- Figure 7: Asia Pacific OpenStack Services Industry Revenue Share (%), by Country 2024 & 2032
- Figure 8: South America OpenStack Services Industry Revenue (Million), by Country 2024 & 2032
- Figure 9: South America OpenStack Services Industry Revenue Share (%), by Country 2024 & 2032
- Figure 10: North America OpenStack Services Industry Revenue (Million), by Country 2024 & 2032
- Figure 11: North America OpenStack Services Industry Revenue Share (%), by Country 2024 & 2032
- Figure 12: MEA OpenStack Services Industry Revenue (Million), by Country 2024 & 2032
- Figure 13: MEA OpenStack Services Industry Revenue Share (%), by Country 2024 & 2032
- Figure 14: North America OpenStack Services Industry Revenue (Million), by Deployment Model 2024 & 2032
- Figure 15: North America OpenStack Services Industry Revenue Share (%), by Deployment Model 2024 & 2032
- Figure 16: North America OpenStack Services Industry Revenue (Million), by End-user Industry 2024 & 2032
- Figure 17: North America OpenStack Services Industry Revenue Share (%), by End-user Industry 2024 & 2032
- Figure 18: North America OpenStack Services Industry Revenue (Million), by Country 2024 & 2032
- Figure 19: North America OpenStack Services Industry Revenue Share (%), by Country 2024 & 2032
- Figure 20: Europe OpenStack Services Industry Revenue (Million), by Deployment Model 2024 & 2032
- Figure 21: Europe OpenStack Services Industry Revenue Share (%), by Deployment Model 2024 & 2032
- Figure 22: Europe OpenStack Services Industry Revenue (Million), by End-user Industry 2024 & 2032
- Figure 23: Europe OpenStack Services Industry Revenue Share (%), by End-user Industry 2024 & 2032
- Figure 24: Europe OpenStack Services Industry Revenue (Million), by Country 2024 & 2032
- Figure 25: Europe OpenStack Services Industry Revenue Share (%), by Country 2024 & 2032
- Figure 26: Asia OpenStack Services Industry Revenue (Million), by Deployment Model 2024 & 2032
- Figure 27: Asia OpenStack Services Industry Revenue Share (%), by Deployment Model 2024 & 2032
- Figure 28: Asia OpenStack Services Industry Revenue (Million), by End-user Industry 2024 & 2032
- Figure 29: Asia OpenStack Services Industry Revenue Share (%), by End-user Industry 2024 & 2032
- Figure 30: Asia OpenStack Services Industry Revenue (Million), by Country 2024 & 2032
- Figure 31: Asia OpenStack Services Industry Revenue Share (%), by Country 2024 & 2032
- Figure 32: Latin America OpenStack Services Industry Revenue (Million), by Deployment Model 2024 & 2032
- Figure 33: Latin America OpenStack Services Industry Revenue Share (%), by Deployment Model 2024 & 2032
- Figure 34: Latin America OpenStack Services Industry Revenue (Million), by End-user Industry 2024 & 2032
- Figure 35: Latin America OpenStack Services Industry Revenue Share (%), by End-user Industry 2024 & 2032
- Figure 36: Latin America OpenStack Services Industry Revenue (Million), by Country 2024 & 2032
- Figure 37: Latin America OpenStack Services Industry Revenue Share (%), by Country 2024 & 2032
- Figure 38: Middle East and Africa OpenStack Services Industry Revenue (Million), by Deployment Model 2024 & 2032
- Figure 39: Middle East and Africa OpenStack Services Industry Revenue Share (%), by Deployment Model 2024 & 2032
- Figure 40: Middle East and Africa OpenStack Services Industry Revenue (Million), by End-user Industry 2024 & 2032
- Figure 41: Middle East and Africa OpenStack Services Industry Revenue Share (%), by End-user Industry 2024 & 2032
- Figure 42: Middle East and Africa OpenStack Services Industry Revenue (Million), by Country 2024 & 2032
- Figure 43: Middle East and Africa OpenStack Services Industry Revenue Share (%), by Country 2024 & 2032
List of Tables
- Table 1: Global OpenStack Services Industry Revenue Million Forecast, by Region 2019 & 2032
- Table 2: Global OpenStack Services Industry Revenue Million Forecast, by Deployment Model 2019 & 2032
- Table 3: Global OpenStack Services Industry Revenue Million Forecast, by End-user Industry 2019 & 2032
- Table 4: Global OpenStack Services Industry Revenue Million Forecast, by Region 2019 & 2032
- Table 5: Global OpenStack Services Industry Revenue Million Forecast, by Country 2019 & 2032
- Table 6: United States OpenStack Services Industry Revenue (Million) Forecast, by Application 2019 & 2032
- Table 7: Canada OpenStack Services Industry Revenue (Million) Forecast, by Application 2019 & 2032
- Table 8: Mexico OpenStack Services Industry Revenue (Million) Forecast, by Application 2019 & 2032
- Table 9: Global OpenStack Services Industry Revenue Million Forecast, by Country 2019 & 2032
- Table 10: Germany OpenStack Services Industry Revenue (Million) Forecast, by Application 2019 & 2032
- Table 11: United Kingdom OpenStack Services Industry Revenue (Million) Forecast, by Application 2019 & 2032
- Table 12: France OpenStack Services Industry Revenue (Million) Forecast, by Application 2019 & 2032
- Table 13: Spain OpenStack Services Industry Revenue (Million) Forecast, by Application 2019 & 2032
- Table 14: Italy OpenStack Services Industry Revenue (Million) Forecast, by Application 2019 & 2032
- Table 15: Spain OpenStack Services Industry Revenue (Million) Forecast, by Application 2019 & 2032
- Table 16: Belgium OpenStack Services Industry Revenue (Million) Forecast, by Application 2019 & 2032
- Table 17: Netherland OpenStack Services Industry Revenue (Million) Forecast, by Application 2019 & 2032
- Table 18: Nordics OpenStack Services Industry Revenue (Million) Forecast, by Application 2019 & 2032
- Table 19: Rest of Europe OpenStack Services Industry Revenue (Million) Forecast, by Application 2019 & 2032
- Table 20: Global OpenStack Services Industry Revenue Million Forecast, by Country 2019 & 2032
- Table 21: China OpenStack Services Industry Revenue (Million) Forecast, by Application 2019 & 2032
- Table 22: Japan OpenStack Services Industry Revenue (Million) Forecast, by Application 2019 & 2032
- Table 23: India OpenStack Services Industry Revenue (Million) Forecast, by Application 2019 & 2032
- Table 24: South Korea OpenStack Services Industry Revenue (Million) Forecast, by Application 2019 & 2032
- Table 25: Southeast Asia OpenStack Services Industry Revenue (Million) Forecast, by Application 2019 & 2032
- Table 26: Australia OpenStack Services Industry Revenue (Million) Forecast, by Application 2019 & 2032
- Table 27: Indonesia OpenStack Services Industry Revenue (Million) Forecast, by Application 2019 & 2032
- Table 28: Phillipes OpenStack Services Industry Revenue (Million) Forecast, by Application 2019 & 2032
- Table 29: Singapore OpenStack Services Industry Revenue (Million) Forecast, by Application 2019 & 2032
- Table 30: Thailandc OpenStack Services Industry Revenue (Million) Forecast, by Application 2019 & 2032
- Table 31: Rest of Asia Pacific OpenStack Services Industry Revenue (Million) Forecast, by Application 2019 & 2032
- Table 32: Global OpenStack Services Industry Revenue Million Forecast, by Country 2019 & 2032
- Table 33: Brazil OpenStack Services Industry Revenue (Million) Forecast, by Application 2019 & 2032
- Table 34: Argentina OpenStack Services Industry Revenue (Million) Forecast, by Application 2019 & 2032
- Table 35: Peru OpenStack Services Industry Revenue (Million) Forecast, by Application 2019 & 2032
- Table 36: Chile OpenStack Services Industry Revenue (Million) Forecast, by Application 2019 & 2032
- Table 37: Colombia OpenStack Services Industry Revenue (Million) Forecast, by Application 2019 & 2032
- Table 38: Ecuador OpenStack Services Industry Revenue (Million) Forecast, by Application 2019 & 2032
- Table 39: Venezuela OpenStack Services Industry Revenue (Million) Forecast, by Application 2019 & 2032
- Table 40: Rest of South America OpenStack Services Industry Revenue (Million) Forecast, by Application 2019 & 2032
- Table 41: Global OpenStack Services Industry Revenue Million Forecast, by Country 2019 & 2032
- Table 42: United States OpenStack Services Industry Revenue (Million) Forecast, by Application 2019 & 2032
- Table 43: Canada OpenStack Services Industry Revenue (Million) Forecast, by Application 2019 & 2032
- Table 44: Mexico OpenStack Services Industry Revenue (Million) Forecast, by Application 2019 & 2032
- Table 45: Global OpenStack Services Industry Revenue Million Forecast, by Country 2019 & 2032
- Table 46: United Arab Emirates OpenStack Services Industry Revenue (Million) Forecast, by Application 2019 & 2032
- Table 47: Saudi Arabia OpenStack Services Industry Revenue (Million) Forecast, by Application 2019 & 2032
- Table 48: South Africa OpenStack Services Industry Revenue (Million) Forecast, by Application 2019 & 2032
- Table 49: Rest of Middle East and Africa OpenStack Services Industry Revenue (Million) Forecast, by Application 2019 & 2032
- Table 50: Global OpenStack Services Industry Revenue Million Forecast, by Deployment Model 2019 & 2032
- Table 51: Global OpenStack Services Industry Revenue Million Forecast, by End-user Industry 2019 & 2032
- Table 52: Global OpenStack Services Industry Revenue Million Forecast, by Country 2019 & 2032
- Table 53: Global OpenStack Services Industry Revenue Million Forecast, by Deployment Model 2019 & 2032
- Table 54: Global OpenStack Services Industry Revenue Million Forecast, by End-user Industry 2019 & 2032
- Table 55: Global OpenStack Services Industry Revenue Million Forecast, by Country 2019 & 2032
- Table 56: Global OpenStack Services Industry Revenue Million Forecast, by Deployment Model 2019 & 2032
- Table 57: Global OpenStack Services Industry Revenue Million Forecast, by End-user Industry 2019 & 2032
- Table 58: Global OpenStack Services Industry Revenue Million Forecast, by Country 2019 & 2032
- Table 59: Global OpenStack Services Industry Revenue Million Forecast, by Deployment Model 2019 & 2032
- Table 60: Global OpenStack Services Industry Revenue Million Forecast, by End-user Industry 2019 & 2032
- Table 61: Global OpenStack Services Industry Revenue Million Forecast, by Country 2019 & 2032
- Table 62: Global OpenStack Services Industry Revenue Million Forecast, by Deployment Model 2019 & 2032
- Table 63: Global OpenStack Services Industry Revenue Million Forecast, by End-user Industry 2019 & 2032
- Table 64: Global OpenStack Services Industry Revenue Million Forecast, by Country 2019 & 2032
Frequently Asked Questions
1. What is the projected Compound Annual Growth Rate (CAGR) of the OpenStack Services Industry?
The projected CAGR is approximately 32.01%.
2. Which companies are prominent players in the OpenStack Services Industry?
Key companies in the market include Mirantis Inc, Canonical Ltd, NetApp Inc, Cisco Systems Inc, Rackspace US Inc, Hewlett Packard Enterprise Development LP, Red Hat Inc, Dell Inc, Huawei Technologies Co Ltd, VMware Inc.
3. What are the main segments of the OpenStack Services Industry?
The market segments include Deployment Model, End-user Industry.
4. Can you provide details about the market size?
The market size is estimated to be USD 22.81 Million as of 2022.
5. What are some drivers contributing to market growth?
Increasing Need for Organizations to Improve Their Business Agility and Efficiency; OpenStack Being Open Source Provides the Flexibility for Customized Solution; Increasing use of OpenStack Services in Telecommunication Sector.
6. What are the notable trends driving market growth?
Increasing use of OpenStack Services in Telecommunication Sector is Driving the Market.
7. Are there any restraints impacting market growth?
Lack of Robustness that Enterprises Desire for Their Data Centers. Including IT Management Features. Such as Availability and Security.
8. Can you provide examples of recent developments in the market?
October 2023 - UNICC is Partnered with Canonical, the publisher of Ubuntu and provider of open-source security, support and services, to build and deliver the secure private cloud environment for the UN system, offering advanced security and data sovereignty for the UN’s most sensitive data and software applications.
9. What pricing options are available for accessing the report?
Pricing options include single-user, multi-user, and enterprise licenses priced at USD 4750, USD 5250, and USD 8750 respectively.
10. Is the market size provided in terms of value or volume?
The market size is provided in terms of value, measured in Million.
11. Are there any specific market keywords associated with the report?
Yes, the market keyword associated with the report is "OpenStack Services Industry," which aids in identifying and referencing the specific market segment covered.
12. How do I determine which pricing option suits my needs best?
The pricing options vary based on user requirements and access needs. Individual users may opt for single-user licenses, while businesses requiring broader access may choose multi-user or enterprise licenses for cost-effective access to the report.
13. Are there any additional resources or data provided in the OpenStack Services Industry report?
While the report offers comprehensive insights, it's advisable to review the specific contents or supplementary materials provided to ascertain if additional resources or data are available.
14. How can I stay updated on further developments or reports in the OpenStack Services Industry?
To stay informed about further developments, trends, and reports in the OpenStack Services Industry, consider subscribing to industry newsletters, following relevant companies and organizations, or regularly checking reputable industry news sources and publications.
Methodology
Step 1 - Identification of Relevant Samples Size from Population Database


Step 2 - Approaches for Defining Global Market Size (Value, Volume* & Price*)

Note*: In applicable scenarios
Step 3 - Data Sources
Primary Research
- Web Analytics
- Survey Reports
- Research Institute
- Latest Research Reports
- Opinion Leaders
Secondary Research
- Annual Reports
- White Paper
- Latest Press Release
- Industry Association
- Paid Database
- Investor Presentations

Step 4 - Data Triangulation
Involves using different sources of information in order to increase the validity of a study
These sources are likely to be stakeholders in a program - participants, other researchers, program staff, other community members, and so on.
Then we put all data in single framework & apply various statistical tools to find out the dynamic on the market.
During the analysis stage, feedback from the stakeholder groups would be compared to determine areas of agreement as well as areas of divergence


