
Key Insights
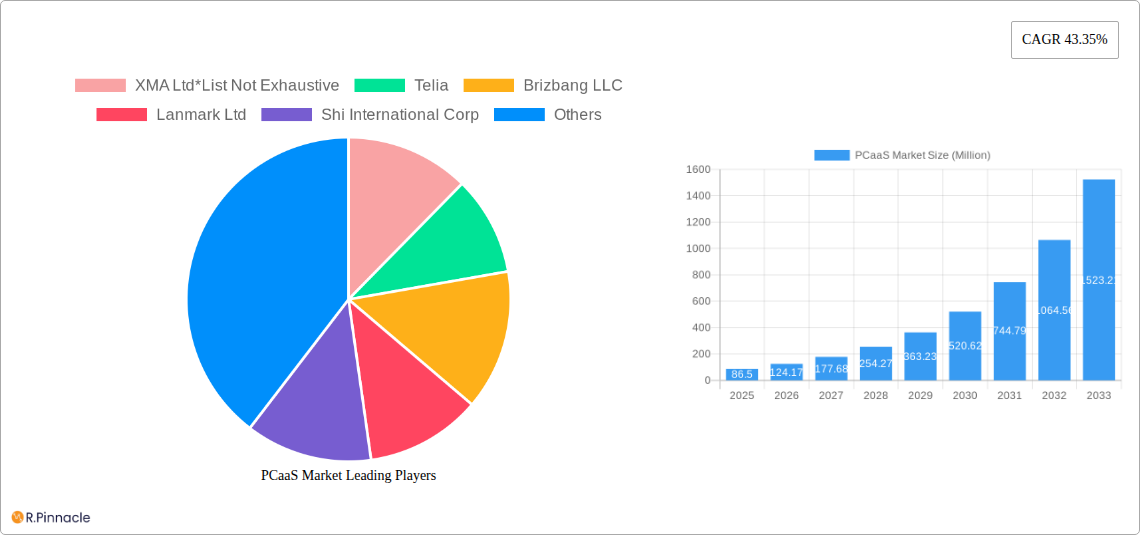
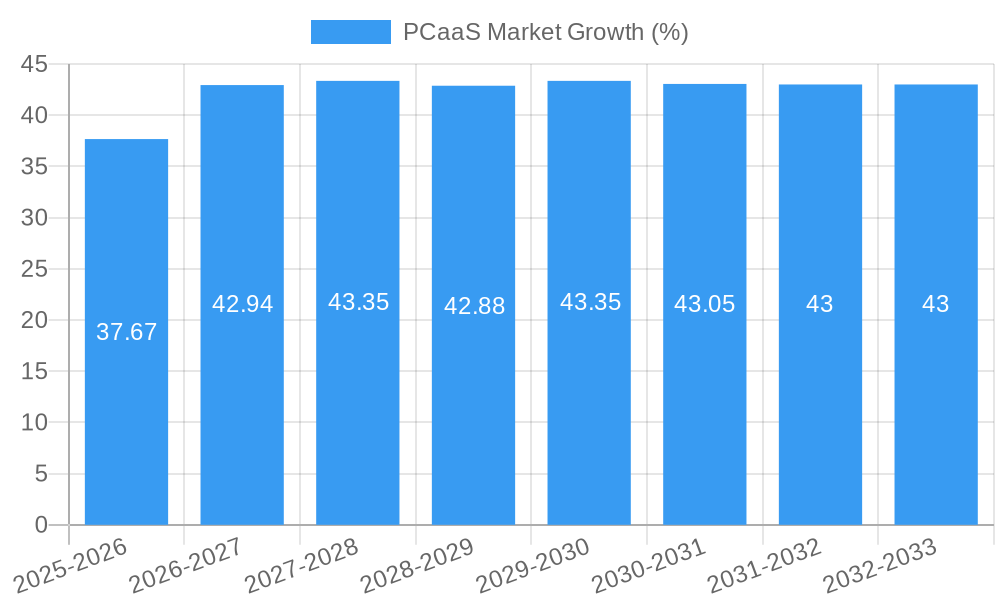
The PCaaS (Personal Computer as a Service) market is experiencing robust growth, projected to reach $86.50 million in 2025 and exhibiting a remarkable Compound Annual Growth Rate (CAGR) of 43.35%. This surge is driven by several key factors. The increasing adoption of cloud-based solutions by businesses of all sizes—from small and medium-scale organizations to large enterprises—is a primary catalyst. Furthermore, the rising need for streamlined IT infrastructure management, reduced capital expenditure, and enhanced scalability are compelling organizations across diverse sectors, including BFSI, healthcare, IT & telecom, government, and education, to embrace PCaaS models. The flexibility and cost-effectiveness offered by PCaaS are particularly attractive to businesses facing fluctuating operational needs, allowing them to scale their computing resources up or down as required, avoiding the complexities and expenses associated with traditional PC ownership. The market is segmented by hardware, software, and services offerings, with software-centric solutions likely gaining traction due to their agility and adaptability. Leading vendors like HP Inc., Dell Technologies, and Lenovo Group Ltd. are actively shaping this market, alongside specialized PCaaS providers. Competition is expected to intensify as more players enter the field, further fueling innovation and driving down prices.
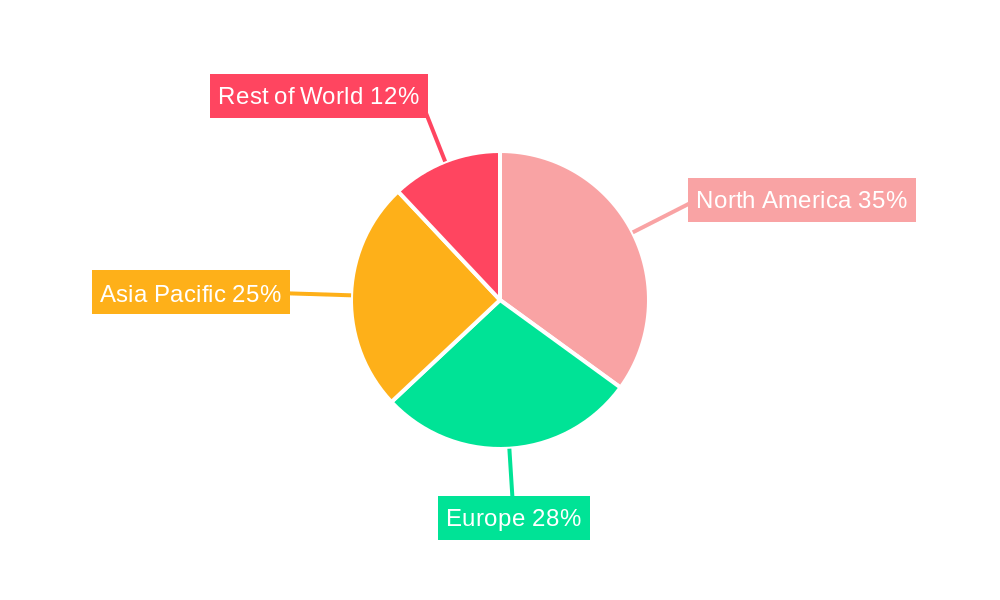
The market's growth trajectory is expected to remain strong throughout the forecast period (2025-2033). While potential restraints such as concerns about data security and network dependency might exist, the overall benefits of PCaaS, including improved employee productivity and reduced IT support burden, outweigh these challenges. The Asia-Pacific region is anticipated to witness significant growth, driven by increasing digitalization and the expansion of businesses in developing economies. North America and Europe, while already significant markets, are also expected to contribute substantially to the overall market expansion. The market will likely see further diversification with tailored PCaaS solutions emerging to meet specific industry requirements. This will encompass features like enhanced security protocols for sensitive data handling in sectors such as BFSI and healthcare, further driving market penetration and fostering long-term growth.
PCaaS Market Report: 2019-2033 Forecast
This comprehensive report provides a detailed analysis of the PCaaS (Personal Computer as a Service) market, offering invaluable insights for industry professionals, investors, and strategists. The report covers the period from 2019 to 2033, with a focus on the 2025-2033 forecast period. The study examines market dynamics, key players, emerging trends, and future growth opportunities. Projected market value in 2025 is estimated at xx Million, with a CAGR of xx% from 2025-2033.
PCaaS Market Structure & Innovation Trends
The PCaaS market exhibits a moderately fragmented structure, with several key players vying for market share. While precise market share data for individual companies is proprietary and requires further investigation, estimates suggest that the top five players hold a combined share of approximately xx%. The market landscape is dynamic, with significant M&A activity observed in the historical period (2019-2024). Deal values ranged from xx Million to xx Million, reflecting a trend toward consolidation and expansion. Innovation is driven by advancements in cloud computing, AI, and cybersecurity, pushing the development of more secure and feature-rich PCaaS offerings. The regulatory environment varies across different geographic regions but generally promotes competition. Product substitutes primarily include traditional PC ownership models and other cloud-based services. End-user demographics are shifting toward a broader base, encompassing small and medium-sized businesses (SMBs), large enterprises, and diverse end-user industries.
PCaaS Market Dynamics & Trends
The PCaaS market is experiencing robust growth, driven by factors such as the increasing adoption of cloud computing, the rising demand for flexible IT solutions, and the growing need to reduce capital expenditure. The CAGR for the forecast period is projected at xx%. This growth is particularly notable in the SMB segment, fueled by the affordability and scalability of PCaaS. Technological disruptions, including the integration of AI and IoT into PCaaS offerings, are further accelerating market expansion. Consumer preferences are trending towards subscription-based models and on-demand accessibility, aligning perfectly with the PCaaS proposition. Market penetration in developed regions is already high, but significant growth potential exists in emerging economies as digital transformation gains momentum.
Dominant Regions & Segments in PCaaS Market
Leading Region: North America currently holds the largest market share, driven by strong technological advancements, high digital literacy, and substantial IT investments.
Leading Segment (By Type): Services currently represents the largest segment, benefiting from growing demand for managed IT support, device management, and software updates.
Leading Segment (By Deployment Type): Large organizations are the leading adopters of PCaaS solutions, due to their greater capacity for IT investment and the significant benefits of centralized management and security.
Leading Segment (By End-user Industry): The IT and Telecom sector stands as the leading adopter, followed closely by BFSI (Banking, Financial Services, and Insurance), driven by the critical need for secure and reliable computing infrastructure.
Key Drivers for Regional Dominance:
- North America: Strong technological infrastructure, high IT spending, early adoption of cloud technologies.
- Europe: Increasing focus on digital transformation initiatives by governments and businesses.
- Asia-Pacific: Rapid economic growth, rising digitalization across various sectors.
PCaaS Market Product Innovations
Recent product developments focus on enhanced security features, AI-powered device management capabilities, and seamless integration with other cloud-based services. The competitive landscape encourages continuous innovation, leading to improved user experiences and more tailored subscription options. This trend caters to the market need for flexible, scalable, and cost-effective IT solutions.
Report Scope & Segmentation Analysis
This report segments the PCaaS market by type (Hardware, Software, Services), deployment type (Small and Medium-scale Organizations, Large Organizations), and end-user industry (BFSI, Healthcare and Life Sciences, IT and Telecom, Government and Defense, Education, Other End-user Industries). Each segment is comprehensively analyzed, including growth projections, market size estimates, and competitive dynamics. Growth rates vary significantly across segments; for instance, the services segment is expected to witness faster growth compared to hardware due to the increasing outsourcing of IT management.
Key Drivers of PCaaS Market Growth
The PCaaS market's growth is propelled by factors like the increasing demand for flexible IT solutions, the need for reduced IT infrastructure costs, and the advancements in cloud computing technologies. Government initiatives promoting digital transformation and the rising adoption of remote work models further contribute to market expansion.
Challenges in the PCaaS Market Sector
The PCaaS market faces challenges such as data security concerns, potential vendor lock-in, and the need for reliable internet connectivity. These factors can significantly impact adoption rates, especially in regions with limited infrastructure. Competition among providers is intense, forcing companies to continuously innovate and improve their offerings.
Emerging Opportunities in PCaaS Market
Significant opportunities exist in expanding PCaaS adoption across emerging markets, integrating advanced technologies like AI and IoT, and developing customized solutions tailored to specific industry needs. The market presents substantial potential for growth in sectors like education and healthcare, where digital transformation is gaining momentum.
Leading Players in the PCaaS Market Market
- XMA Ltd *List Not Exhaustive
- Telia
- Brizbang LLC
- Lanmark Ltd
- Shi International Corp
- HP Inc
- Compucom Systems Inc (Office Depot Inc )
- Utopia Software LLC
- Symetri
- Lenovo Group Ltd
- Intel Corporation
- Dell Technologies
Key Developments in PCaaS Market Industry
March 2022: Apple launched Apple Business Essentials, offering a comprehensive suite of services for US small businesses, including iCloud storage, 24/7 support, and device management. This significantly expands the PCaaS market access for Apple devices.
January 2022: HP expanded its digital services portfolio with a new subscription management service targeting SMBs, empowering businesses to make informed software purchasing decisions and streamlining their IT operations.
Future Outlook for PCaaS Market Market
The PCaaS market is poised for continued growth, driven by technological advancements, increasing demand for flexible IT solutions, and the rising adoption of cloud computing. Strategic partnerships and acquisitions will likely reshape the market landscape, leading to enhanced service offerings and greater market penetration. The long-term outlook is optimistic, with significant growth potential across various segments and geographic regions.
PCaaS Market Segmentation
-
1. Type
- 1.1. Hardware
- 1.2. Software
- 1.3. Services
-
2. Deployment Type
- 2.1. Small and Medium-scale Organizations
- 2.2. Large Organizations
-
3. End-user Industry
- 3.1. BFSI
- 3.2. Healthcare and Life Sciences
- 3.3. IT and Telecom
- 3.4. Government and Defense
- 3.5. Education
- 3.6. Other End-user Industries
PCaaS Market Segmentation By Geography
- 1. North America
- 2. Europe
- 3. Asia Pacific
- 4. Rest of the World
PCaaS Market REPORT HIGHLIGHTS
| Aspects | Details |
|---|---|
| Study Period | 2019-2033 |
| Base Year | 2024 |
| Estimated Year | 2025 |
| Forecast Period | 2025-2033 |
| Historical Period | 2019-2024 |
| Growth Rate | CAGR of 43.35% from 2019-2033 |
| Segmentation |
|
Table of Contents
- 1. Introduction
- 1.1. Research Scope
- 1.2. Market Segmentation
- 1.3. Research Methodology
- 1.4. Definitions and Assumptions
- 2. Executive Summary
- 2.1. Introduction
- 3. Market Dynamics
- 3.1. Introduction
- 3.2. Market Drivers
- 3.2.1. Increasing Demand from Small and Medium-scale Organizations Due to Cost Benefits; Renewed Focus on Managed Service Providers
- 3.3. Market Restrains
- 3.3.1. Lack of Product Differentiation
- 3.4. Market Trends
- 3.4.1. Small and Medium-scale Organizations is Expected to Register a Significant Growth
- 4. Market Factor Analysis
- 4.1. Porters Five Forces
- 4.2. Supply/Value Chain
- 4.3. PESTEL analysis
- 4.4. Market Entropy
- 4.5. Patent/Trademark Analysis
- 5. Global PCaaS Market Analysis, Insights and Forecast, 2019-2031
- 5.1. Market Analysis, Insights and Forecast - by Type
- 5.1.1. Hardware
- 5.1.2. Software
- 5.1.3. Services
- 5.2. Market Analysis, Insights and Forecast - by Deployment Type
- 5.2.1. Small and Medium-scale Organizations
- 5.2.2. Large Organizations
- 5.3. Market Analysis, Insights and Forecast - by End-user Industry
- 5.3.1. BFSI
- 5.3.2. Healthcare and Life Sciences
- 5.3.3. IT and Telecom
- 5.3.4. Government and Defense
- 5.3.5. Education
- 5.3.6. Other End-user Industries
- 5.4. Market Analysis, Insights and Forecast - by Region
- 5.4.1. North America
- 5.4.2. Europe
- 5.4.3. Asia Pacific
- 5.4.4. Rest of the World
- 5.1. Market Analysis, Insights and Forecast - by Type
- 6. North America PCaaS Market Analysis, Insights and Forecast, 2019-2031
- 6.1. Market Analysis, Insights and Forecast - by Type
- 6.1.1. Hardware
- 6.1.2. Software
- 6.1.3. Services
- 6.2. Market Analysis, Insights and Forecast - by Deployment Type
- 6.2.1. Small and Medium-scale Organizations
- 6.2.2. Large Organizations
- 6.3. Market Analysis, Insights and Forecast - by End-user Industry
- 6.3.1. BFSI
- 6.3.2. Healthcare and Life Sciences
- 6.3.3. IT and Telecom
- 6.3.4. Government and Defense
- 6.3.5. Education
- 6.3.6. Other End-user Industries
- 6.1. Market Analysis, Insights and Forecast - by Type
- 7. Europe PCaaS Market Analysis, Insights and Forecast, 2019-2031
- 7.1. Market Analysis, Insights and Forecast - by Type
- 7.1.1. Hardware
- 7.1.2. Software
- 7.1.3. Services
- 7.2. Market Analysis, Insights and Forecast - by Deployment Type
- 7.2.1. Small and Medium-scale Organizations
- 7.2.2. Large Organizations
- 7.3. Market Analysis, Insights and Forecast - by End-user Industry
- 7.3.1. BFSI
- 7.3.2. Healthcare and Life Sciences
- 7.3.3. IT and Telecom
- 7.3.4. Government and Defense
- 7.3.5. Education
- 7.3.6. Other End-user Industries
- 7.1. Market Analysis, Insights and Forecast - by Type
- 8. Asia Pacific PCaaS Market Analysis, Insights and Forecast, 2019-2031
- 8.1. Market Analysis, Insights and Forecast - by Type
- 8.1.1. Hardware
- 8.1.2. Software
- 8.1.3. Services
- 8.2. Market Analysis, Insights and Forecast - by Deployment Type
- 8.2.1. Small and Medium-scale Organizations
- 8.2.2. Large Organizations
- 8.3. Market Analysis, Insights and Forecast - by End-user Industry
- 8.3.1. BFSI
- 8.3.2. Healthcare and Life Sciences
- 8.3.3. IT and Telecom
- 8.3.4. Government and Defense
- 8.3.5. Education
- 8.3.6. Other End-user Industries
- 8.1. Market Analysis, Insights and Forecast - by Type
- 9. Rest of the World PCaaS Market Analysis, Insights and Forecast, 2019-2031
- 9.1. Market Analysis, Insights and Forecast - by Type
- 9.1.1. Hardware
- 9.1.2. Software
- 9.1.3. Services
- 9.2. Market Analysis, Insights and Forecast - by Deployment Type
- 9.2.1. Small and Medium-scale Organizations
- 9.2.2. Large Organizations
- 9.3. Market Analysis, Insights and Forecast - by End-user Industry
- 9.3.1. BFSI
- 9.3.2. Healthcare and Life Sciences
- 9.3.3. IT and Telecom
- 9.3.4. Government and Defense
- 9.3.5. Education
- 9.3.6. Other End-user Industries
- 9.1. Market Analysis, Insights and Forecast - by Type
- 10. North America PCaaS Market Analysis, Insights and Forecast, 2019-2031
- 10.1. Market Analysis, Insights and Forecast - By Country/Sub-region
- 10.1.1.
- 11. Europe PCaaS Market Analysis, Insights and Forecast, 2019-2031
- 11.1. Market Analysis, Insights and Forecast - By Country/Sub-region
- 11.1.1.
- 12. Asia Pacific PCaaS Market Analysis, Insights and Forecast, 2019-2031
- 12.1. Market Analysis, Insights and Forecast - By Country/Sub-region
- 12.1.1.
- 13. Rest of the World PCaaS Market Analysis, Insights and Forecast, 2019-2031
- 13.1. Market Analysis, Insights and Forecast - By Country/Sub-region
- 13.1.1.
- 14. Competitive Analysis
- 14.1. Global Market Share Analysis 2024
- 14.2. Company Profiles
- 14.2.1 XMA Ltd*List Not Exhaustive
- 14.2.1.1. Overview
- 14.2.1.2. Products
- 14.2.1.3. SWOT Analysis
- 14.2.1.4. Recent Developments
- 14.2.1.5. Financials (Based on Availability)
- 14.2.2 Telia
- 14.2.2.1. Overview
- 14.2.2.2. Products
- 14.2.2.3. SWOT Analysis
- 14.2.2.4. Recent Developments
- 14.2.2.5. Financials (Based on Availability)
- 14.2.3 Brizbang LLC
- 14.2.3.1. Overview
- 14.2.3.2. Products
- 14.2.3.3. SWOT Analysis
- 14.2.3.4. Recent Developments
- 14.2.3.5. Financials (Based on Availability)
- 14.2.4 Lanmark Ltd
- 14.2.4.1. Overview
- 14.2.4.2. Products
- 14.2.4.3. SWOT Analysis
- 14.2.4.4. Recent Developments
- 14.2.4.5. Financials (Based on Availability)
- 14.2.5 Shi International Corp
- 14.2.5.1. Overview
- 14.2.5.2. Products
- 14.2.5.3. SWOT Analysis
- 14.2.5.4. Recent Developments
- 14.2.5.5. Financials (Based on Availability)
- 14.2.6 HP Inc
- 14.2.6.1. Overview
- 14.2.6.2. Products
- 14.2.6.3. SWOT Analysis
- 14.2.6.4. Recent Developments
- 14.2.6.5. Financials (Based on Availability)
- 14.2.7 Compucom Systems Inc (Office Depot Inc )
- 14.2.7.1. Overview
- 14.2.7.2. Products
- 14.2.7.3. SWOT Analysis
- 14.2.7.4. Recent Developments
- 14.2.7.5. Financials (Based on Availability)
- 14.2.8 Utopia Software LLC
- 14.2.8.1. Overview
- 14.2.8.2. Products
- 14.2.8.3. SWOT Analysis
- 14.2.8.4. Recent Developments
- 14.2.8.5. Financials (Based on Availability)
- 14.2.9 Symetri
- 14.2.9.1. Overview
- 14.2.9.2. Products
- 14.2.9.3. SWOT Analysis
- 14.2.9.4. Recent Developments
- 14.2.9.5. Financials (Based on Availability)
- 14.2.10 Lenovo Group Ltd
- 14.2.10.1. Overview
- 14.2.10.2. Products
- 14.2.10.3. SWOT Analysis
- 14.2.10.4. Recent Developments
- 14.2.10.5. Financials (Based on Availability)
- 14.2.11 Intel Corporation
- 14.2.11.1. Overview
- 14.2.11.2. Products
- 14.2.11.3. SWOT Analysis
- 14.2.11.4. Recent Developments
- 14.2.11.5. Financials (Based on Availability)
- 14.2.12 Dell Technologies
- 14.2.12.1. Overview
- 14.2.12.2. Products
- 14.2.12.3. SWOT Analysis
- 14.2.12.4. Recent Developments
- 14.2.12.5. Financials (Based on Availability)
- 14.2.1 XMA Ltd*List Not Exhaustive
List of Figures
- Figure 1: Global PCaaS Market Revenue Breakdown (Million, %) by Region 2024 & 2032
- Figure 2: North America PCaaS Market Revenue (Million), by Country 2024 & 2032
- Figure 3: North America PCaaS Market Revenue Share (%), by Country 2024 & 2032
- Figure 4: Europe PCaaS Market Revenue (Million), by Country 2024 & 2032
- Figure 5: Europe PCaaS Market Revenue Share (%), by Country 2024 & 2032
- Figure 6: Asia Pacific PCaaS Market Revenue (Million), by Country 2024 & 2032
- Figure 7: Asia Pacific PCaaS Market Revenue Share (%), by Country 2024 & 2032
- Figure 8: Rest of the World PCaaS Market Revenue (Million), by Country 2024 & 2032
- Figure 9: Rest of the World PCaaS Market Revenue Share (%), by Country 2024 & 2032
- Figure 10: North America PCaaS Market Revenue (Million), by Type 2024 & 2032
- Figure 11: North America PCaaS Market Revenue Share (%), by Type 2024 & 2032
- Figure 12: North America PCaaS Market Revenue (Million), by Deployment Type 2024 & 2032
- Figure 13: North America PCaaS Market Revenue Share (%), by Deployment Type 2024 & 2032
- Figure 14: North America PCaaS Market Revenue (Million), by End-user Industry 2024 & 2032
- Figure 15: North America PCaaS Market Revenue Share (%), by End-user Industry 2024 & 2032
- Figure 16: North America PCaaS Market Revenue (Million), by Country 2024 & 2032
- Figure 17: North America PCaaS Market Revenue Share (%), by Country 2024 & 2032
- Figure 18: Europe PCaaS Market Revenue (Million), by Type 2024 & 2032
- Figure 19: Europe PCaaS Market Revenue Share (%), by Type 2024 & 2032
- Figure 20: Europe PCaaS Market Revenue (Million), by Deployment Type 2024 & 2032
- Figure 21: Europe PCaaS Market Revenue Share (%), by Deployment Type 2024 & 2032
- Figure 22: Europe PCaaS Market Revenue (Million), by End-user Industry 2024 & 2032
- Figure 23: Europe PCaaS Market Revenue Share (%), by End-user Industry 2024 & 2032
- Figure 24: Europe PCaaS Market Revenue (Million), by Country 2024 & 2032
- Figure 25: Europe PCaaS Market Revenue Share (%), by Country 2024 & 2032
- Figure 26: Asia Pacific PCaaS Market Revenue (Million), by Type 2024 & 2032
- Figure 27: Asia Pacific PCaaS Market Revenue Share (%), by Type 2024 & 2032
- Figure 28: Asia Pacific PCaaS Market Revenue (Million), by Deployment Type 2024 & 2032
- Figure 29: Asia Pacific PCaaS Market Revenue Share (%), by Deployment Type 2024 & 2032
- Figure 30: Asia Pacific PCaaS Market Revenue (Million), by End-user Industry 2024 & 2032
- Figure 31: Asia Pacific PCaaS Market Revenue Share (%), by End-user Industry 2024 & 2032
- Figure 32: Asia Pacific PCaaS Market Revenue (Million), by Country 2024 & 2032
- Figure 33: Asia Pacific PCaaS Market Revenue Share (%), by Country 2024 & 2032
- Figure 34: Rest of the World PCaaS Market Revenue (Million), by Type 2024 & 2032
- Figure 35: Rest of the World PCaaS Market Revenue Share (%), by Type 2024 & 2032
- Figure 36: Rest of the World PCaaS Market Revenue (Million), by Deployment Type 2024 & 2032
- Figure 37: Rest of the World PCaaS Market Revenue Share (%), by Deployment Type 2024 & 2032
- Figure 38: Rest of the World PCaaS Market Revenue (Million), by End-user Industry 2024 & 2032
- Figure 39: Rest of the World PCaaS Market Revenue Share (%), by End-user Industry 2024 & 2032
- Figure 40: Rest of the World PCaaS Market Revenue (Million), by Country 2024 & 2032
- Figure 41: Rest of the World PCaaS Market Revenue Share (%), by Country 2024 & 2032
List of Tables
- Table 1: Global PCaaS Market Revenue Million Forecast, by Region 2019 & 2032
- Table 2: Global PCaaS Market Revenue Million Forecast, by Type 2019 & 2032
- Table 3: Global PCaaS Market Revenue Million Forecast, by Deployment Type 2019 & 2032
- Table 4: Global PCaaS Market Revenue Million Forecast, by End-user Industry 2019 & 2032
- Table 5: Global PCaaS Market Revenue Million Forecast, by Region 2019 & 2032
- Table 6: Global PCaaS Market Revenue Million Forecast, by Country 2019 & 2032
- Table 7: PCaaS Market Revenue (Million) Forecast, by Application 2019 & 2032
- Table 8: Global PCaaS Market Revenue Million Forecast, by Country 2019 & 2032
- Table 9: PCaaS Market Revenue (Million) Forecast, by Application 2019 & 2032
- Table 10: Global PCaaS Market Revenue Million Forecast, by Country 2019 & 2032
- Table 11: PCaaS Market Revenue (Million) Forecast, by Application 2019 & 2032
- Table 12: Global PCaaS Market Revenue Million Forecast, by Country 2019 & 2032
- Table 13: PCaaS Market Revenue (Million) Forecast, by Application 2019 & 2032
- Table 14: Global PCaaS Market Revenue Million Forecast, by Type 2019 & 2032
- Table 15: Global PCaaS Market Revenue Million Forecast, by Deployment Type 2019 & 2032
- Table 16: Global PCaaS Market Revenue Million Forecast, by End-user Industry 2019 & 2032
- Table 17: Global PCaaS Market Revenue Million Forecast, by Country 2019 & 2032
- Table 18: Global PCaaS Market Revenue Million Forecast, by Type 2019 & 2032
- Table 19: Global PCaaS Market Revenue Million Forecast, by Deployment Type 2019 & 2032
- Table 20: Global PCaaS Market Revenue Million Forecast, by End-user Industry 2019 & 2032
- Table 21: Global PCaaS Market Revenue Million Forecast, by Country 2019 & 2032
- Table 22: Global PCaaS Market Revenue Million Forecast, by Type 2019 & 2032
- Table 23: Global PCaaS Market Revenue Million Forecast, by Deployment Type 2019 & 2032
- Table 24: Global PCaaS Market Revenue Million Forecast, by End-user Industry 2019 & 2032
- Table 25: Global PCaaS Market Revenue Million Forecast, by Country 2019 & 2032
- Table 26: Global PCaaS Market Revenue Million Forecast, by Type 2019 & 2032
- Table 27: Global PCaaS Market Revenue Million Forecast, by Deployment Type 2019 & 2032
- Table 28: Global PCaaS Market Revenue Million Forecast, by End-user Industry 2019 & 2032
- Table 29: Global PCaaS Market Revenue Million Forecast, by Country 2019 & 2032
Frequently Asked Questions
1. What is the projected Compound Annual Growth Rate (CAGR) of the PCaaS Market?
The projected CAGR is approximately 43.35%.
2. Which companies are prominent players in the PCaaS Market?
Key companies in the market include XMA Ltd*List Not Exhaustive, Telia, Brizbang LLC, Lanmark Ltd, Shi International Corp, HP Inc, Compucom Systems Inc (Office Depot Inc ), Utopia Software LLC, Symetri, Lenovo Group Ltd, Intel Corporation, Dell Technologies.
3. What are the main segments of the PCaaS Market?
The market segments include Type, Deployment Type, End-user Industry.
4. Can you provide details about the market size?
The market size is estimated to be USD 86.50 Million as of 2022.
5. What are some drivers contributing to market growth?
Increasing Demand from Small and Medium-scale Organizations Due to Cost Benefits; Renewed Focus on Managed Service Providers.
6. What are the notable trends driving market growth?
Small and Medium-scale Organizations is Expected to Register a Significant Growth.
7. Are there any restraints impacting market growth?
Lack of Product Differentiation.
8. Can you provide examples of recent developments in the market?
March 2022: Apple stated that all US small businesses can now access Apple Business Essentials. The new service combines iCloud storage, 24/7 Apple support, and device management into customizable subscription options. AppleCare+ for Business Essentials choices that may be added to any plan were also revealed by Apple. All clients, including those using Apple Business Essentials in beta, will also have access to a two-month free trial.
9. What pricing options are available for accessing the report?
Pricing options include single-user, multi-user, and enterprise licenses priced at USD 4750, USD 5250, and USD 8750 respectively.
10. Is the market size provided in terms of value or volume?
The market size is provided in terms of value, measured in Million.
11. Are there any specific market keywords associated with the report?
Yes, the market keyword associated with the report is "PCaaS Market," which aids in identifying and referencing the specific market segment covered.
12. How do I determine which pricing option suits my needs best?
The pricing options vary based on user requirements and access needs. Individual users may opt for single-user licenses, while businesses requiring broader access may choose multi-user or enterprise licenses for cost-effective access to the report.
13. Are there any additional resources or data provided in the PCaaS Market report?
While the report offers comprehensive insights, it's advisable to review the specific contents or supplementary materials provided to ascertain if additional resources or data are available.
14. How can I stay updated on further developments or reports in the PCaaS Market?
To stay informed about further developments, trends, and reports in the PCaaS Market, consider subscribing to industry newsletters, following relevant companies and organizations, or regularly checking reputable industry news sources and publications.
Methodology
Step 1 - Identification of Relevant Samples Size from Population Database


Step 2 - Approaches for Defining Global Market Size (Value, Volume* & Price*)

Note*: In applicable scenarios
Step 3 - Data Sources
Primary Research
- Web Analytics
- Survey Reports
- Research Institute
- Latest Research Reports
- Opinion Leaders
Secondary Research
- Annual Reports
- White Paper
- Latest Press Release
- Industry Association
- Paid Database
- Investor Presentations

Step 4 - Data Triangulation
Involves using different sources of information in order to increase the validity of a study
These sources are likely to be stakeholders in a program - participants, other researchers, program staff, other community members, and so on.
Then we put all data in single framework & apply various statistical tools to find out the dynamic on the market.
During the analysis stage, feedback from the stakeholder groups would be compared to determine areas of agreement as well as areas of divergence


