
Key Insights
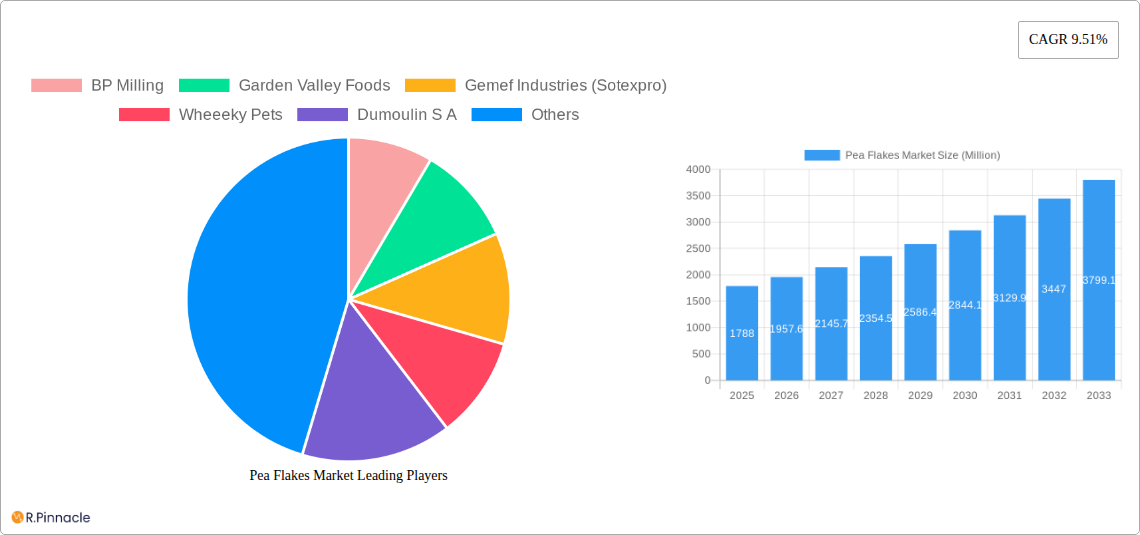
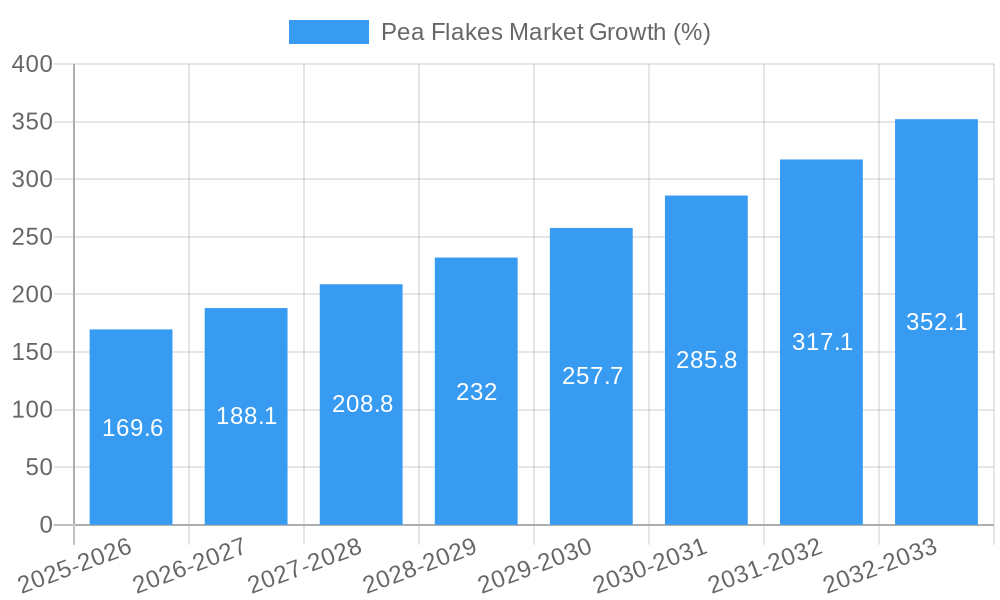
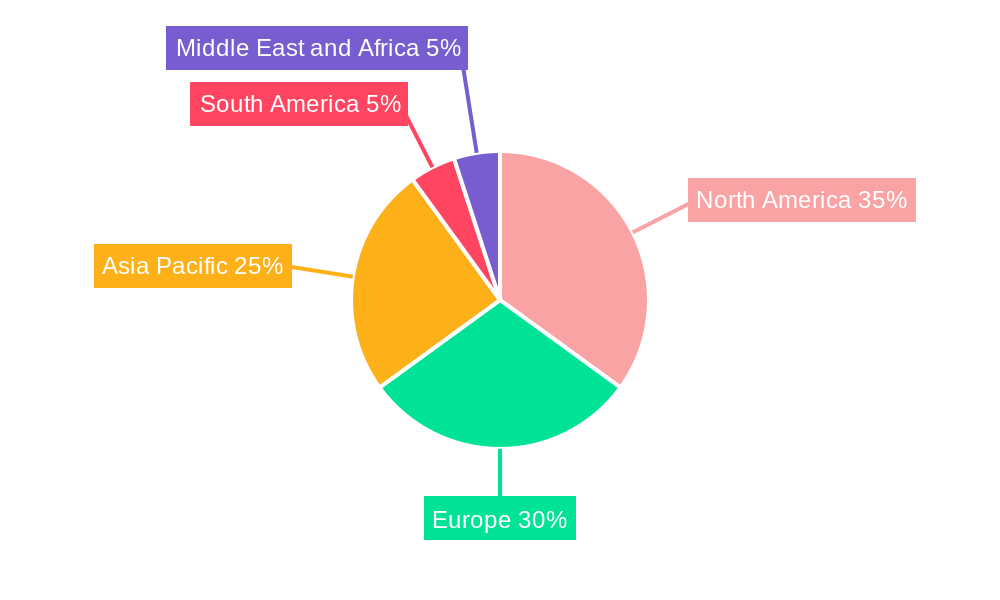
The global pea flakes market, valued at $1,788 million in 2025, is projected to experience robust growth, driven by a compound annual growth rate (CAGR) of 9.51% from 2025 to 2033. This expansion is fueled by several key factors. The increasing popularity of plant-based diets and the rising demand for sustainable and nutritious food alternatives are significantly boosting the consumption of pea flakes as a protein source in various applications. The versatility of pea flakes, applicable in animal feed, processed foods (e.g., snacks, baked goods), and other applications, further enhances market growth. Growth is also spurred by the expanding processed food industry and the increasing adoption of online retail channels, offering convenient access to consumers. While challenges such as price fluctuations in raw materials and potential supply chain disruptions may pose some constraints, the overall market outlook remains positive. Specific regional growth will likely vary; North America and Europe are expected to maintain significant market shares due to established consumer bases and robust food processing industries, while the Asia-Pacific region is poised for substantial growth due to rising disposable incomes and changing dietary habits. The competitive landscape includes both large multinational corporations and smaller regional players, with continuous innovation in product offerings and expansion into new markets driving further competition.
The segmentation within the pea flakes market reveals distinct growth patterns. Green pea flakes currently hold a larger market share compared to yellow pea flakes due to consumer preference and color appeal. Within applications, animal feed constitutes a considerable portion, driven by the growing livestock industry's demand for sustainable and cost-effective protein sources. However, processed food applications are expected to witness faster growth rates due to the aforementioned factors of increasing health consciousness and the versatility of pea flakes in various food products. Distribution channels show a shift towards online stores, reflecting the broader trend of e-commerce growth and consumer preference for convenient shopping experiences. Hypermarkets and supermarkets remain dominant channels, but online channels are expected to capture significant market share in the forecast period, driven by technological advancements and improved consumer access to online platforms. Future market performance will depend on the continued innovation in pea flake production, advancements in processing techniques to improve product quality and expand applications, and strategic collaborations between manufacturers and distributors to enhance market reach and availability.
Pea Flakes Market: A Comprehensive Report (2019-2033)
This comprehensive report provides an in-depth analysis of the global pea flakes market, offering valuable insights for industry professionals, investors, and strategic decision-makers. The report covers the period from 2019 to 2033, with a focus on the forecast period 2025-2033 and a base year of 2025. The market is segmented by type (green pea, yellow pea), application (animal feed, processed food, other applications), and distribution channel (hypermarkets/supermarkets, convenience stores, online stores, other channels). The report's value lies in its detailed analysis of market dynamics, competitive landscape, and future growth potential, providing actionable intelligence for navigating this evolving market. The total market size is projected to reach xx Million by 2033, exhibiting a CAGR of xx% during the forecast period.
Pea Flakes Market Structure & Innovation Trends
This section analyzes the competitive landscape of the pea flakes market, focusing on market concentration, innovation drivers, regulatory frameworks, and M&A activities. The market is moderately fragmented, with key players like BP Milling, Garden Valley Foods, Gemef Industries (Sotexpro), and AGT Foods and Ingredients Inc. holding significant, but not dominant, market share.
- Market Concentration: The Herfindahl-Hirschman Index (HHI) is estimated at xx, indicating a moderately fragmented market.
- Innovation Drivers: Growing demand for plant-based protein sources, coupled with advancements in pea flake processing technologies, are key drivers of innovation.
- Regulatory Frameworks: Food safety regulations and labeling requirements significantly impact market dynamics.
- Product Substitutes: Other plant-based protein sources, such as soy flakes and lentil flakes, pose competitive challenges.
- End-User Demographics: The increasing health-conscious population and rising demand for vegan/vegetarian products are boosting the market.
- M&A Activities: The report documents several M&A activities in the recent past with a total deal value of approximately xx Million. These acquisitions have led to increased market consolidation and expansion into new geographic regions.
Pea Flakes Market Dynamics & Trends
The global pea flakes market is witnessing robust growth driven by several factors. The rising demand for plant-based protein, particularly in the animal feed and processed food sectors, fuels market expansion. Technological advancements in pea processing are enhancing product quality and efficiency, leading to improved yield and reduced production costs. The increasing popularity of vegan and vegetarian diets is further driving consumption. Consumer preference for clean-label, natural ingredients influences product development and market segmentation. Competitive dynamics are characterized by intense competition among established players and the emergence of new entrants, pushing innovation and price competitiveness. The market is projected to witness a CAGR of xx% during the forecast period, with significant market penetration in key regions. This strong growth is driven by a number of factors, including the rising adoption of pea flakes in various applications, coupled with advancements in processing technology.
Dominant Regions & Segments in Pea Flakes Market
This section highlights the leading regions and segments within the pea flakes market.
By Type:
- Green Pea: This segment dominates the market, accounting for xx% of total revenue in 2025, driven by its higher protein content and broader applications.
- Yellow Pea: The yellow pea segment is experiencing moderate growth, attributed to its unique flavor profile and suitability for specific applications.
By Application:
- Animal Feed: This is the largest application segment, capturing xx% of the market in 2025 due to its cost-effectiveness and nutritional value as a feed ingredient.
- Processed Food: The processed food segment is showing substantial growth, driven by the increasing demand for plant-based alternatives in various food products.
- Other Applications: This category includes niche applications like pet food and functional food ingredients, showcasing promising growth potential.
By Distribution Channel:
- Hypermarkets and Supermarkets: This channel holds the largest market share, indicating strong penetration into mainstream retail.
- Online Stores: The online sales segment is growing rapidly, indicating changing consumer purchase patterns and market accessibility.
Key drivers for dominance vary across segments and regions. For example, North America leads in processed food applications due to high consumer demand for plant-based protein, while Asia-Pacific shows strong growth in animal feed applications, driven by increasing livestock production. Governmental policies promoting sustainable agriculture and investment in infrastructure also contribute to regional market development.
Pea Flakes Market Product Innovations
Recent years have witnessed significant innovations in pea flake processing technologies, leading to improved product quality, increased yields, and more efficient production processes. New methods for enhancing protein content and functional properties are being explored, as are innovations related to packaging and shelf-life extension. These innovations aim to meet the evolving demands of various end-use industries, leading to a broader range of applications and stronger market competitiveness.
Report Scope & Segmentation Analysis
This report offers a detailed analysis of the pea flakes market, segmented by type (green pea and yellow pea), application (animal feed, processed food, and other applications), and distribution channel (hypermarkets/supermarkets, convenience stores, online stores, and other channels). Each segment is assessed based on its market size, growth projections, and competitive dynamics. The green pea segment is projected to dominate, driven by high demand. The animal feed application segment demonstrates significant potential, while the online distribution channel exhibits the fastest growth rate. Competitive analysis explores the strategies employed by key players to secure market share.
Key Drivers of Pea Flakes Market Growth
The pea flakes market is propelled by increasing consumer demand for plant-based proteins, driven by health consciousness and dietary preferences. The rising global population and growing meat consumption are boosting the demand for animal feed, making pea flakes a cost-effective and nutritious alternative. Furthermore, technological advancements in pea flake processing lead to higher yields, improving efficiency and lowering costs. Favorable government regulations in several regions also contribute to the growth by incentivizing sustainable agriculture.
Challenges in the Pea Flakes Market Sector
The pea flakes market faces challenges such as fluctuations in raw material prices, which impact production costs and profitability. Competition from other plant-based protein sources puts pressure on market share. Strict food safety and labeling regulations necessitate high production standards and compliance costs. Finally, supply chain disruptions can affect the smooth delivery of pea flakes to end users.
Emerging Opportunities in Pea Flakes Market
The pea flakes market offers significant opportunities for growth. Emerging markets in developing countries are presenting new avenues for expansion. The development of functional pea flakes with enhanced properties could unlock new applications in the food and beverage industry. Innovation in processing technologies and eco-friendly packaging further enhance sustainability and reduce environmental footprint, leading to increased consumer acceptance and broader market appeal.
Leading Players in the Pea Flakes Market Market
- BP Milling
- Garden Valley Foods
- Gemef Industries (Sotexpro)
- Wheeeky Pets
- Dumoulin S A
- Om Foods Inc
- JR Farm
- Inland Empire Foods Inc
- Exotic Nutrition
- AGT Foods and Ingredients Inc.
Key Developments in Pea Flakes Market Industry
- [Date]: New pea flake processing lines launched by [Company Name], significantly increasing production capacity.
- [Date]: Collaboration between [Pea Flake Manufacturer] and [Health Food Company] to develop new pea flake-based products.
- [Date]: Acquisition of [Pea Flake Business] by [Multinational Corporation], expanding market reach and product portfolio.
Future Outlook for Pea Flakes Market Market
The pea flakes market exhibits strong future growth potential, driven by sustained demand for plant-based protein, technological advancements, and expanding applications across various industries. Strategic partnerships, innovation in product development, and expansion into new geographical markets will be crucial for players seeking to capitalize on the emerging opportunities in this dynamic market. Focus on sustainability and eco-friendly practices will further enhance market attractiveness and competitive advantage.
Pea Flakes Market Segmentation
-
1. Type
- 1.1. Green Pea
- 1.2. Yellow Pea
-
2. Application
- 2.1. Animal Feed
- 2.2. Processed Food
- 2.3. Other Applications
-
3. Distribution Channel
- 3.1. Hypermarkets and Supermarkets
- 3.2. Convenience stores
- 3.3. Online Stores
- 3.4. Other Channels
Pea Flakes Market Segmentation By Geography
-
1. North America
- 1.1. United States
- 1.2. Canada
- 1.3. Mexico
- 1.4. Rest of North America
-
2. Europe
- 2.1. Spain
- 2.2. United Kingdom
- 2.3. Germany
- 2.4. France
- 2.5. Italy
- 2.6. Russia
- 2.7. Rest of Europe
-
3. Asia Pacific
- 3.1. China
- 3.2. Japan
- 3.3. India
- 3.4. Australia
- 3.5. Rest of Asia Pacific
-
4. South America
- 4.1. Brazil
- 4.2. Argentina
- 4.3. Rest of South America
-
5. Middle East and Africa
- 5.1. South Africa
- 5.2. Saudi Arabia
- 5.3. Rest of Middle East and Africa
Pea Flakes Market REPORT HIGHLIGHTS
| Aspects | Details |
|---|---|
| Study Period | 2019-2033 |
| Base Year | 2024 |
| Estimated Year | 2025 |
| Forecast Period | 2025-2033 |
| Historical Period | 2019-2024 |
| Growth Rate | CAGR of 9.51% from 2019-2033 |
| Segmentation |
|
Table of Contents
- 1. Introduction
- 1.1. Research Scope
- 1.2. Market Segmentation
- 1.3. Research Methodology
- 1.4. Definitions and Assumptions
- 2. Executive Summary
- 2.1. Introduction
- 3. Market Dynamics
- 3.1. Introduction
- 3.2. Market Drivers
- 3.2.1. Increasing application of Gelatin in healthcare and pharmaceutical sector
- 3.3. Market Restrains
- 3.3.1. Rising demand for clean label products
- 3.4. Market Trends
- 3.4.1. Pea Flakes find Extensive Application in Food Industry
- 4. Market Factor Analysis
- 4.1. Porters Five Forces
- 4.2. Supply/Value Chain
- 4.3. PESTEL analysis
- 4.4. Market Entropy
- 4.5. Patent/Trademark Analysis
- 5. Global Pea Flakes Market Analysis, Insights and Forecast, 2019-2031
- 5.1. Market Analysis, Insights and Forecast - by Type
- 5.1.1. Green Pea
- 5.1.2. Yellow Pea
- 5.2. Market Analysis, Insights and Forecast - by Application
- 5.2.1. Animal Feed
- 5.2.2. Processed Food
- 5.2.3. Other Applications
- 5.3. Market Analysis, Insights and Forecast - by Distribution Channel
- 5.3.1. Hypermarkets and Supermarkets
- 5.3.2. Convenience stores
- 5.3.3. Online Stores
- 5.3.4. Other Channels
- 5.4. Market Analysis, Insights and Forecast - by Region
- 5.4.1. North America
- 5.4.2. Europe
- 5.4.3. Asia Pacific
- 5.4.4. South America
- 5.4.5. Middle East and Africa
- 5.1. Market Analysis, Insights and Forecast - by Type
- 6. North America Pea Flakes Market Analysis, Insights and Forecast, 2019-2031
- 6.1. Market Analysis, Insights and Forecast - by Type
- 6.1.1. Green Pea
- 6.1.2. Yellow Pea
- 6.2. Market Analysis, Insights and Forecast - by Application
- 6.2.1. Animal Feed
- 6.2.2. Processed Food
- 6.2.3. Other Applications
- 6.3. Market Analysis, Insights and Forecast - by Distribution Channel
- 6.3.1. Hypermarkets and Supermarkets
- 6.3.2. Convenience stores
- 6.3.3. Online Stores
- 6.3.4. Other Channels
- 6.1. Market Analysis, Insights and Forecast - by Type
- 7. Europe Pea Flakes Market Analysis, Insights and Forecast, 2019-2031
- 7.1. Market Analysis, Insights and Forecast - by Type
- 7.1.1. Green Pea
- 7.1.2. Yellow Pea
- 7.2. Market Analysis, Insights and Forecast - by Application
- 7.2.1. Animal Feed
- 7.2.2. Processed Food
- 7.2.3. Other Applications
- 7.3. Market Analysis, Insights and Forecast - by Distribution Channel
- 7.3.1. Hypermarkets and Supermarkets
- 7.3.2. Convenience stores
- 7.3.3. Online Stores
- 7.3.4. Other Channels
- 7.1. Market Analysis, Insights and Forecast - by Type
- 8. Asia Pacific Pea Flakes Market Analysis, Insights and Forecast, 2019-2031
- 8.1. Market Analysis, Insights and Forecast - by Type
- 8.1.1. Green Pea
- 8.1.2. Yellow Pea
- 8.2. Market Analysis, Insights and Forecast - by Application
- 8.2.1. Animal Feed
- 8.2.2. Processed Food
- 8.2.3. Other Applications
- 8.3. Market Analysis, Insights and Forecast - by Distribution Channel
- 8.3.1. Hypermarkets and Supermarkets
- 8.3.2. Convenience stores
- 8.3.3. Online Stores
- 8.3.4. Other Channels
- 8.1. Market Analysis, Insights and Forecast - by Type
- 9. South America Pea Flakes Market Analysis, Insights and Forecast, 2019-2031
- 9.1. Market Analysis, Insights and Forecast - by Type
- 9.1.1. Green Pea
- 9.1.2. Yellow Pea
- 9.2. Market Analysis, Insights and Forecast - by Application
- 9.2.1. Animal Feed
- 9.2.2. Processed Food
- 9.2.3. Other Applications
- 9.3. Market Analysis, Insights and Forecast - by Distribution Channel
- 9.3.1. Hypermarkets and Supermarkets
- 9.3.2. Convenience stores
- 9.3.3. Online Stores
- 9.3.4. Other Channels
- 9.1. Market Analysis, Insights and Forecast - by Type
- 10. Middle East and Africa Pea Flakes Market Analysis, Insights and Forecast, 2019-2031
- 10.1. Market Analysis, Insights and Forecast - by Type
- 10.1.1. Green Pea
- 10.1.2. Yellow Pea
- 10.2. Market Analysis, Insights and Forecast - by Application
- 10.2.1. Animal Feed
- 10.2.2. Processed Food
- 10.2.3. Other Applications
- 10.3. Market Analysis, Insights and Forecast - by Distribution Channel
- 10.3.1. Hypermarkets and Supermarkets
- 10.3.2. Convenience stores
- 10.3.3. Online Stores
- 10.3.4. Other Channels
- 10.1. Market Analysis, Insights and Forecast - by Type
- 11. North America Pea Flakes Market Analysis, Insights and Forecast, 2019-2031
- 11.1. Market Analysis, Insights and Forecast - By Country/Sub-region
- 11.1.1 United States
- 11.1.2 Canada
- 11.1.3 Mexico
- 11.1.4 Rest of North America
- 12. Europe Pea Flakes Market Analysis, Insights and Forecast, 2019-2031
- 12.1. Market Analysis, Insights and Forecast - By Country/Sub-region
- 12.1.1 Spain
- 12.1.2 United Kingdom
- 12.1.3 Germany
- 12.1.4 France
- 12.1.5 Italy
- 12.1.6 Russia
- 12.1.7 Rest of Europe
- 13. Asia Pacific Pea Flakes Market Analysis, Insights and Forecast, 2019-2031
- 13.1. Market Analysis, Insights and Forecast - By Country/Sub-region
- 13.1.1 China
- 13.1.2 Japan
- 13.1.3 India
- 13.1.4 Australia
- 13.1.5 Rest of Asia Pacific
- 14. South America Pea Flakes Market Analysis, Insights and Forecast, 2019-2031
- 14.1. Market Analysis, Insights and Forecast - By Country/Sub-region
- 14.1.1 Brazil
- 14.1.2 Argentina
- 14.1.3 Rest of South America
- 15. Middle East and Africa Pea Flakes Market Analysis, Insights and Forecast, 2019-2031
- 15.1. Market Analysis, Insights and Forecast - By Country/Sub-region
- 15.1.1 South Africa
- 15.1.2 Saudi Arabia
- 15.1.3 Rest of Middle East and Africa
- 16. Competitive Analysis
- 16.1. Global Market Share Analysis 2024
- 16.2. Company Profiles
- 16.2.1 BP Milling
- 16.2.1.1. Overview
- 16.2.1.2. Products
- 16.2.1.3. SWOT Analysis
- 16.2.1.4. Recent Developments
- 16.2.1.5. Financials (Based on Availability)
- 16.2.2 Garden Valley Foods
- 16.2.2.1. Overview
- 16.2.2.2. Products
- 16.2.2.3. SWOT Analysis
- 16.2.2.4. Recent Developments
- 16.2.2.5. Financials (Based on Availability)
- 16.2.3 Gemef Industries (Sotexpro)
- 16.2.3.1. Overview
- 16.2.3.2. Products
- 16.2.3.3. SWOT Analysis
- 16.2.3.4. Recent Developments
- 16.2.3.5. Financials (Based on Availability)
- 16.2.4 Wheeeky Pets
- 16.2.4.1. Overview
- 16.2.4.2. Products
- 16.2.4.3. SWOT Analysis
- 16.2.4.4. Recent Developments
- 16.2.4.5. Financials (Based on Availability)
- 16.2.5 Dumoulin S A
- 16.2.5.1. Overview
- 16.2.5.2. Products
- 16.2.5.3. SWOT Analysis
- 16.2.5.4. Recent Developments
- 16.2.5.5. Financials (Based on Availability)
- 16.2.6 Om Foods Inc
- 16.2.6.1. Overview
- 16.2.6.2. Products
- 16.2.6.3. SWOT Analysis
- 16.2.6.4. Recent Developments
- 16.2.6.5. Financials (Based on Availability)
- 16.2.7 JR Farm
- 16.2.7.1. Overview
- 16.2.7.2. Products
- 16.2.7.3. SWOT Analysis
- 16.2.7.4. Recent Developments
- 16.2.7.5. Financials (Based on Availability)
- 16.2.8 Inland Empire Foods Inc
- 16.2.8.1. Overview
- 16.2.8.2. Products
- 16.2.8.3. SWOT Analysis
- 16.2.8.4. Recent Developments
- 16.2.8.5. Financials (Based on Availability)
- 16.2.9 Exotic Nutrition*List Not Exhaustive
- 16.2.9.1. Overview
- 16.2.9.2. Products
- 16.2.9.3. SWOT Analysis
- 16.2.9.4. Recent Developments
- 16.2.9.5. Financials (Based on Availability)
- 16.2.10 AGT Foods and Ingredients Inc.
- 16.2.10.1. Overview
- 16.2.10.2. Products
- 16.2.10.3. SWOT Analysis
- 16.2.10.4. Recent Developments
- 16.2.10.5. Financials (Based on Availability)
- 16.2.1 BP Milling
List of Figures
- Figure 1: Global Pea Flakes Market Revenue Breakdown (Million, %) by Region 2024 & 2032
- Figure 2: Global Pea Flakes Market Volume Breakdown (K Tons, %) by Region 2024 & 2032
- Figure 3: North America Pea Flakes Market Revenue (Million), by Country 2024 & 2032
- Figure 4: North America Pea Flakes Market Volume (K Tons), by Country 2024 & 2032
- Figure 5: North America Pea Flakes Market Revenue Share (%), by Country 2024 & 2032
- Figure 6: North America Pea Flakes Market Volume Share (%), by Country 2024 & 2032
- Figure 7: Europe Pea Flakes Market Revenue (Million), by Country 2024 & 2032
- Figure 8: Europe Pea Flakes Market Volume (K Tons), by Country 2024 & 2032
- Figure 9: Europe Pea Flakes Market Revenue Share (%), by Country 2024 & 2032
- Figure 10: Europe Pea Flakes Market Volume Share (%), by Country 2024 & 2032
- Figure 11: Asia Pacific Pea Flakes Market Revenue (Million), by Country 2024 & 2032
- Figure 12: Asia Pacific Pea Flakes Market Volume (K Tons), by Country 2024 & 2032
- Figure 13: Asia Pacific Pea Flakes Market Revenue Share (%), by Country 2024 & 2032
- Figure 14: Asia Pacific Pea Flakes Market Volume Share (%), by Country 2024 & 2032
- Figure 15: South America Pea Flakes Market Revenue (Million), by Country 2024 & 2032
- Figure 16: South America Pea Flakes Market Volume (K Tons), by Country 2024 & 2032
- Figure 17: South America Pea Flakes Market Revenue Share (%), by Country 2024 & 2032
- Figure 18: South America Pea Flakes Market Volume Share (%), by Country 2024 & 2032
- Figure 19: Middle East and Africa Pea Flakes Market Revenue (Million), by Country 2024 & 2032
- Figure 20: Middle East and Africa Pea Flakes Market Volume (K Tons), by Country 2024 & 2032
- Figure 21: Middle East and Africa Pea Flakes Market Revenue Share (%), by Country 2024 & 2032
- Figure 22: Middle East and Africa Pea Flakes Market Volume Share (%), by Country 2024 & 2032
- Figure 23: North America Pea Flakes Market Revenue (Million), by Type 2024 & 2032
- Figure 24: North America Pea Flakes Market Volume (K Tons), by Type 2024 & 2032
- Figure 25: North America Pea Flakes Market Revenue Share (%), by Type 2024 & 2032
- Figure 26: North America Pea Flakes Market Volume Share (%), by Type 2024 & 2032
- Figure 27: North America Pea Flakes Market Revenue (Million), by Application 2024 & 2032
- Figure 28: North America Pea Flakes Market Volume (K Tons), by Application 2024 & 2032
- Figure 29: North America Pea Flakes Market Revenue Share (%), by Application 2024 & 2032
- Figure 30: North America Pea Flakes Market Volume Share (%), by Application 2024 & 2032
- Figure 31: North America Pea Flakes Market Revenue (Million), by Distribution Channel 2024 & 2032
- Figure 32: North America Pea Flakes Market Volume (K Tons), by Distribution Channel 2024 & 2032
- Figure 33: North America Pea Flakes Market Revenue Share (%), by Distribution Channel 2024 & 2032
- Figure 34: North America Pea Flakes Market Volume Share (%), by Distribution Channel 2024 & 2032
- Figure 35: North America Pea Flakes Market Revenue (Million), by Country 2024 & 2032
- Figure 36: North America Pea Flakes Market Volume (K Tons), by Country 2024 & 2032
- Figure 37: North America Pea Flakes Market Revenue Share (%), by Country 2024 & 2032
- Figure 38: North America Pea Flakes Market Volume Share (%), by Country 2024 & 2032
- Figure 39: Europe Pea Flakes Market Revenue (Million), by Type 2024 & 2032
- Figure 40: Europe Pea Flakes Market Volume (K Tons), by Type 2024 & 2032
- Figure 41: Europe Pea Flakes Market Revenue Share (%), by Type 2024 & 2032
- Figure 42: Europe Pea Flakes Market Volume Share (%), by Type 2024 & 2032
- Figure 43: Europe Pea Flakes Market Revenue (Million), by Application 2024 & 2032
- Figure 44: Europe Pea Flakes Market Volume (K Tons), by Application 2024 & 2032
- Figure 45: Europe Pea Flakes Market Revenue Share (%), by Application 2024 & 2032
- Figure 46: Europe Pea Flakes Market Volume Share (%), by Application 2024 & 2032
- Figure 47: Europe Pea Flakes Market Revenue (Million), by Distribution Channel 2024 & 2032
- Figure 48: Europe Pea Flakes Market Volume (K Tons), by Distribution Channel 2024 & 2032
- Figure 49: Europe Pea Flakes Market Revenue Share (%), by Distribution Channel 2024 & 2032
- Figure 50: Europe Pea Flakes Market Volume Share (%), by Distribution Channel 2024 & 2032
- Figure 51: Europe Pea Flakes Market Revenue (Million), by Country 2024 & 2032
- Figure 52: Europe Pea Flakes Market Volume (K Tons), by Country 2024 & 2032
- Figure 53: Europe Pea Flakes Market Revenue Share (%), by Country 2024 & 2032
- Figure 54: Europe Pea Flakes Market Volume Share (%), by Country 2024 & 2032
- Figure 55: Asia Pacific Pea Flakes Market Revenue (Million), by Type 2024 & 2032
- Figure 56: Asia Pacific Pea Flakes Market Volume (K Tons), by Type 2024 & 2032
- Figure 57: Asia Pacific Pea Flakes Market Revenue Share (%), by Type 2024 & 2032
- Figure 58: Asia Pacific Pea Flakes Market Volume Share (%), by Type 2024 & 2032
- Figure 59: Asia Pacific Pea Flakes Market Revenue (Million), by Application 2024 & 2032
- Figure 60: Asia Pacific Pea Flakes Market Volume (K Tons), by Application 2024 & 2032
- Figure 61: Asia Pacific Pea Flakes Market Revenue Share (%), by Application 2024 & 2032
- Figure 62: Asia Pacific Pea Flakes Market Volume Share (%), by Application 2024 & 2032
- Figure 63: Asia Pacific Pea Flakes Market Revenue (Million), by Distribution Channel 2024 & 2032
- Figure 64: Asia Pacific Pea Flakes Market Volume (K Tons), by Distribution Channel 2024 & 2032
- Figure 65: Asia Pacific Pea Flakes Market Revenue Share (%), by Distribution Channel 2024 & 2032
- Figure 66: Asia Pacific Pea Flakes Market Volume Share (%), by Distribution Channel 2024 & 2032
- Figure 67: Asia Pacific Pea Flakes Market Revenue (Million), by Country 2024 & 2032
- Figure 68: Asia Pacific Pea Flakes Market Volume (K Tons), by Country 2024 & 2032
- Figure 69: Asia Pacific Pea Flakes Market Revenue Share (%), by Country 2024 & 2032
- Figure 70: Asia Pacific Pea Flakes Market Volume Share (%), by Country 2024 & 2032
- Figure 71: South America Pea Flakes Market Revenue (Million), by Type 2024 & 2032
- Figure 72: South America Pea Flakes Market Volume (K Tons), by Type 2024 & 2032
- Figure 73: South America Pea Flakes Market Revenue Share (%), by Type 2024 & 2032
- Figure 74: South America Pea Flakes Market Volume Share (%), by Type 2024 & 2032
- Figure 75: South America Pea Flakes Market Revenue (Million), by Application 2024 & 2032
- Figure 76: South America Pea Flakes Market Volume (K Tons), by Application 2024 & 2032
- Figure 77: South America Pea Flakes Market Revenue Share (%), by Application 2024 & 2032
- Figure 78: South America Pea Flakes Market Volume Share (%), by Application 2024 & 2032
- Figure 79: South America Pea Flakes Market Revenue (Million), by Distribution Channel 2024 & 2032
- Figure 80: South America Pea Flakes Market Volume (K Tons), by Distribution Channel 2024 & 2032
- Figure 81: South America Pea Flakes Market Revenue Share (%), by Distribution Channel 2024 & 2032
- Figure 82: South America Pea Flakes Market Volume Share (%), by Distribution Channel 2024 & 2032
- Figure 83: South America Pea Flakes Market Revenue (Million), by Country 2024 & 2032
- Figure 84: South America Pea Flakes Market Volume (K Tons), by Country 2024 & 2032
- Figure 85: South America Pea Flakes Market Revenue Share (%), by Country 2024 & 2032
- Figure 86: South America Pea Flakes Market Volume Share (%), by Country 2024 & 2032
- Figure 87: Middle East and Africa Pea Flakes Market Revenue (Million), by Type 2024 & 2032
- Figure 88: Middle East and Africa Pea Flakes Market Volume (K Tons), by Type 2024 & 2032
- Figure 89: Middle East and Africa Pea Flakes Market Revenue Share (%), by Type 2024 & 2032
- Figure 90: Middle East and Africa Pea Flakes Market Volume Share (%), by Type 2024 & 2032
- Figure 91: Middle East and Africa Pea Flakes Market Revenue (Million), by Application 2024 & 2032
- Figure 92: Middle East and Africa Pea Flakes Market Volume (K Tons), by Application 2024 & 2032
- Figure 93: Middle East and Africa Pea Flakes Market Revenue Share (%), by Application 2024 & 2032
- Figure 94: Middle East and Africa Pea Flakes Market Volume Share (%), by Application 2024 & 2032
- Figure 95: Middle East and Africa Pea Flakes Market Revenue (Million), by Distribution Channel 2024 & 2032
- Figure 96: Middle East and Africa Pea Flakes Market Volume (K Tons), by Distribution Channel 2024 & 2032
- Figure 97: Middle East and Africa Pea Flakes Market Revenue Share (%), by Distribution Channel 2024 & 2032
- Figure 98: Middle East and Africa Pea Flakes Market Volume Share (%), by Distribution Channel 2024 & 2032
- Figure 99: Middle East and Africa Pea Flakes Market Revenue (Million), by Country 2024 & 2032
- Figure 100: Middle East and Africa Pea Flakes Market Volume (K Tons), by Country 2024 & 2032
- Figure 101: Middle East and Africa Pea Flakes Market Revenue Share (%), by Country 2024 & 2032
- Figure 102: Middle East and Africa Pea Flakes Market Volume Share (%), by Country 2024 & 2032
List of Tables
- Table 1: Global Pea Flakes Market Revenue Million Forecast, by Region 2019 & 2032
- Table 2: Global Pea Flakes Market Volume K Tons Forecast, by Region 2019 & 2032
- Table 3: Global Pea Flakes Market Revenue Million Forecast, by Type 2019 & 2032
- Table 4: Global Pea Flakes Market Volume K Tons Forecast, by Type 2019 & 2032
- Table 5: Global Pea Flakes Market Revenue Million Forecast, by Application 2019 & 2032
- Table 6: Global Pea Flakes Market Volume K Tons Forecast, by Application 2019 & 2032
- Table 7: Global Pea Flakes Market Revenue Million Forecast, by Distribution Channel 2019 & 2032
- Table 8: Global Pea Flakes Market Volume K Tons Forecast, by Distribution Channel 2019 & 2032
- Table 9: Global Pea Flakes Market Revenue Million Forecast, by Region 2019 & 2032
- Table 10: Global Pea Flakes Market Volume K Tons Forecast, by Region 2019 & 2032
- Table 11: Global Pea Flakes Market Revenue Million Forecast, by Country 2019 & 2032
- Table 12: Global Pea Flakes Market Volume K Tons Forecast, by Country 2019 & 2032
- Table 13: United States Pea Flakes Market Revenue (Million) Forecast, by Application 2019 & 2032
- Table 14: United States Pea Flakes Market Volume (K Tons) Forecast, by Application 2019 & 2032
- Table 15: Canada Pea Flakes Market Revenue (Million) Forecast, by Application 2019 & 2032
- Table 16: Canada Pea Flakes Market Volume (K Tons) Forecast, by Application 2019 & 2032
- Table 17: Mexico Pea Flakes Market Revenue (Million) Forecast, by Application 2019 & 2032
- Table 18: Mexico Pea Flakes Market Volume (K Tons) Forecast, by Application 2019 & 2032
- Table 19: Rest of North America Pea Flakes Market Revenue (Million) Forecast, by Application 2019 & 2032
- Table 20: Rest of North America Pea Flakes Market Volume (K Tons) Forecast, by Application 2019 & 2032
- Table 21: Global Pea Flakes Market Revenue Million Forecast, by Country 2019 & 2032
- Table 22: Global Pea Flakes Market Volume K Tons Forecast, by Country 2019 & 2032
- Table 23: Spain Pea Flakes Market Revenue (Million) Forecast, by Application 2019 & 2032
- Table 24: Spain Pea Flakes Market Volume (K Tons) Forecast, by Application 2019 & 2032
- Table 25: United Kingdom Pea Flakes Market Revenue (Million) Forecast, by Application 2019 & 2032
- Table 26: United Kingdom Pea Flakes Market Volume (K Tons) Forecast, by Application 2019 & 2032
- Table 27: Germany Pea Flakes Market Revenue (Million) Forecast, by Application 2019 & 2032
- Table 28: Germany Pea Flakes Market Volume (K Tons) Forecast, by Application 2019 & 2032
- Table 29: France Pea Flakes Market Revenue (Million) Forecast, by Application 2019 & 2032
- Table 30: France Pea Flakes Market Volume (K Tons) Forecast, by Application 2019 & 2032
- Table 31: Italy Pea Flakes Market Revenue (Million) Forecast, by Application 2019 & 2032
- Table 32: Italy Pea Flakes Market Volume (K Tons) Forecast, by Application 2019 & 2032
- Table 33: Russia Pea Flakes Market Revenue (Million) Forecast, by Application 2019 & 2032
- Table 34: Russia Pea Flakes Market Volume (K Tons) Forecast, by Application 2019 & 2032
- Table 35: Rest of Europe Pea Flakes Market Revenue (Million) Forecast, by Application 2019 & 2032
- Table 36: Rest of Europe Pea Flakes Market Volume (K Tons) Forecast, by Application 2019 & 2032
- Table 37: Global Pea Flakes Market Revenue Million Forecast, by Country 2019 & 2032
- Table 38: Global Pea Flakes Market Volume K Tons Forecast, by Country 2019 & 2032
- Table 39: China Pea Flakes Market Revenue (Million) Forecast, by Application 2019 & 2032
- Table 40: China Pea Flakes Market Volume (K Tons) Forecast, by Application 2019 & 2032
- Table 41: Japan Pea Flakes Market Revenue (Million) Forecast, by Application 2019 & 2032
- Table 42: Japan Pea Flakes Market Volume (K Tons) Forecast, by Application 2019 & 2032
- Table 43: India Pea Flakes Market Revenue (Million) Forecast, by Application 2019 & 2032
- Table 44: India Pea Flakes Market Volume (K Tons) Forecast, by Application 2019 & 2032
- Table 45: Australia Pea Flakes Market Revenue (Million) Forecast, by Application 2019 & 2032
- Table 46: Australia Pea Flakes Market Volume (K Tons) Forecast, by Application 2019 & 2032
- Table 47: Rest of Asia Pacific Pea Flakes Market Revenue (Million) Forecast, by Application 2019 & 2032
- Table 48: Rest of Asia Pacific Pea Flakes Market Volume (K Tons) Forecast, by Application 2019 & 2032
- Table 49: Global Pea Flakes Market Revenue Million Forecast, by Country 2019 & 2032
- Table 50: Global Pea Flakes Market Volume K Tons Forecast, by Country 2019 & 2032
- Table 51: Brazil Pea Flakes Market Revenue (Million) Forecast, by Application 2019 & 2032
- Table 52: Brazil Pea Flakes Market Volume (K Tons) Forecast, by Application 2019 & 2032
- Table 53: Argentina Pea Flakes Market Revenue (Million) Forecast, by Application 2019 & 2032
- Table 54: Argentina Pea Flakes Market Volume (K Tons) Forecast, by Application 2019 & 2032
- Table 55: Rest of South America Pea Flakes Market Revenue (Million) Forecast, by Application 2019 & 2032
- Table 56: Rest of South America Pea Flakes Market Volume (K Tons) Forecast, by Application 2019 & 2032
- Table 57: Global Pea Flakes Market Revenue Million Forecast, by Country 2019 & 2032
- Table 58: Global Pea Flakes Market Volume K Tons Forecast, by Country 2019 & 2032
- Table 59: South Africa Pea Flakes Market Revenue (Million) Forecast, by Application 2019 & 2032
- Table 60: South Africa Pea Flakes Market Volume (K Tons) Forecast, by Application 2019 & 2032
- Table 61: Saudi Arabia Pea Flakes Market Revenue (Million) Forecast, by Application 2019 & 2032
- Table 62: Saudi Arabia Pea Flakes Market Volume (K Tons) Forecast, by Application 2019 & 2032
- Table 63: Rest of Middle East and Africa Pea Flakes Market Revenue (Million) Forecast, by Application 2019 & 2032
- Table 64: Rest of Middle East and Africa Pea Flakes Market Volume (K Tons) Forecast, by Application 2019 & 2032
- Table 65: Global Pea Flakes Market Revenue Million Forecast, by Type 2019 & 2032
- Table 66: Global Pea Flakes Market Volume K Tons Forecast, by Type 2019 & 2032
- Table 67: Global Pea Flakes Market Revenue Million Forecast, by Application 2019 & 2032
- Table 68: Global Pea Flakes Market Volume K Tons Forecast, by Application 2019 & 2032
- Table 69: Global Pea Flakes Market Revenue Million Forecast, by Distribution Channel 2019 & 2032
- Table 70: Global Pea Flakes Market Volume K Tons Forecast, by Distribution Channel 2019 & 2032
- Table 71: Global Pea Flakes Market Revenue Million Forecast, by Country 2019 & 2032
- Table 72: Global Pea Flakes Market Volume K Tons Forecast, by Country 2019 & 2032
- Table 73: United States Pea Flakes Market Revenue (Million) Forecast, by Application 2019 & 2032
- Table 74: United States Pea Flakes Market Volume (K Tons) Forecast, by Application 2019 & 2032
- Table 75: Canada Pea Flakes Market Revenue (Million) Forecast, by Application 2019 & 2032
- Table 76: Canada Pea Flakes Market Volume (K Tons) Forecast, by Application 2019 & 2032
- Table 77: Mexico Pea Flakes Market Revenue (Million) Forecast, by Application 2019 & 2032
- Table 78: Mexico Pea Flakes Market Volume (K Tons) Forecast, by Application 2019 & 2032
- Table 79: Rest of North America Pea Flakes Market Revenue (Million) Forecast, by Application 2019 & 2032
- Table 80: Rest of North America Pea Flakes Market Volume (K Tons) Forecast, by Application 2019 & 2032
- Table 81: Global Pea Flakes Market Revenue Million Forecast, by Type 2019 & 2032
- Table 82: Global Pea Flakes Market Volume K Tons Forecast, by Type 2019 & 2032
- Table 83: Global Pea Flakes Market Revenue Million Forecast, by Application 2019 & 2032
- Table 84: Global Pea Flakes Market Volume K Tons Forecast, by Application 2019 & 2032
- Table 85: Global Pea Flakes Market Revenue Million Forecast, by Distribution Channel 2019 & 2032
- Table 86: Global Pea Flakes Market Volume K Tons Forecast, by Distribution Channel 2019 & 2032
- Table 87: Global Pea Flakes Market Revenue Million Forecast, by Country 2019 & 2032
- Table 88: Global Pea Flakes Market Volume K Tons Forecast, by Country 2019 & 2032
- Table 89: Spain Pea Flakes Market Revenue (Million) Forecast, by Application 2019 & 2032
- Table 90: Spain Pea Flakes Market Volume (K Tons) Forecast, by Application 2019 & 2032
- Table 91: United Kingdom Pea Flakes Market Revenue (Million) Forecast, by Application 2019 & 2032
- Table 92: United Kingdom Pea Flakes Market Volume (K Tons) Forecast, by Application 2019 & 2032
- Table 93: Germany Pea Flakes Market Revenue (Million) Forecast, by Application 2019 & 2032
- Table 94: Germany Pea Flakes Market Volume (K Tons) Forecast, by Application 2019 & 2032
- Table 95: France Pea Flakes Market Revenue (Million) Forecast, by Application 2019 & 2032
- Table 96: France Pea Flakes Market Volume (K Tons) Forecast, by Application 2019 & 2032
- Table 97: Italy Pea Flakes Market Revenue (Million) Forecast, by Application 2019 & 2032
- Table 98: Italy Pea Flakes Market Volume (K Tons) Forecast, by Application 2019 & 2032
- Table 99: Russia Pea Flakes Market Revenue (Million) Forecast, by Application 2019 & 2032
- Table 100: Russia Pea Flakes Market Volume (K Tons) Forecast, by Application 2019 & 2032
- Table 101: Rest of Europe Pea Flakes Market Revenue (Million) Forecast, by Application 2019 & 2032
- Table 102: Rest of Europe Pea Flakes Market Volume (K Tons) Forecast, by Application 2019 & 2032
- Table 103: Global Pea Flakes Market Revenue Million Forecast, by Type 2019 & 2032
- Table 104: Global Pea Flakes Market Volume K Tons Forecast, by Type 2019 & 2032
- Table 105: Global Pea Flakes Market Revenue Million Forecast, by Application 2019 & 2032
- Table 106: Global Pea Flakes Market Volume K Tons Forecast, by Application 2019 & 2032
- Table 107: Global Pea Flakes Market Revenue Million Forecast, by Distribution Channel 2019 & 2032
- Table 108: Global Pea Flakes Market Volume K Tons Forecast, by Distribution Channel 2019 & 2032
- Table 109: Global Pea Flakes Market Revenue Million Forecast, by Country 2019 & 2032
- Table 110: Global Pea Flakes Market Volume K Tons Forecast, by Country 2019 & 2032
- Table 111: China Pea Flakes Market Revenue (Million) Forecast, by Application 2019 & 2032
- Table 112: China Pea Flakes Market Volume (K Tons) Forecast, by Application 2019 & 2032
- Table 113: Japan Pea Flakes Market Revenue (Million) Forecast, by Application 2019 & 2032
- Table 114: Japan Pea Flakes Market Volume (K Tons) Forecast, by Application 2019 & 2032
- Table 115: India Pea Flakes Market Revenue (Million) Forecast, by Application 2019 & 2032
- Table 116: India Pea Flakes Market Volume (K Tons) Forecast, by Application 2019 & 2032
- Table 117: Australia Pea Flakes Market Revenue (Million) Forecast, by Application 2019 & 2032
- Table 118: Australia Pea Flakes Market Volume (K Tons) Forecast, by Application 2019 & 2032
- Table 119: Rest of Asia Pacific Pea Flakes Market Revenue (Million) Forecast, by Application 2019 & 2032
- Table 120: Rest of Asia Pacific Pea Flakes Market Volume (K Tons) Forecast, by Application 2019 & 2032
- Table 121: Global Pea Flakes Market Revenue Million Forecast, by Type 2019 & 2032
- Table 122: Global Pea Flakes Market Volume K Tons Forecast, by Type 2019 & 2032
- Table 123: Global Pea Flakes Market Revenue Million Forecast, by Application 2019 & 2032
- Table 124: Global Pea Flakes Market Volume K Tons Forecast, by Application 2019 & 2032
- Table 125: Global Pea Flakes Market Revenue Million Forecast, by Distribution Channel 2019 & 2032
- Table 126: Global Pea Flakes Market Volume K Tons Forecast, by Distribution Channel 2019 & 2032
- Table 127: Global Pea Flakes Market Revenue Million Forecast, by Country 2019 & 2032
- Table 128: Global Pea Flakes Market Volume K Tons Forecast, by Country 2019 & 2032
- Table 129: Brazil Pea Flakes Market Revenue (Million) Forecast, by Application 2019 & 2032
- Table 130: Brazil Pea Flakes Market Volume (K Tons) Forecast, by Application 2019 & 2032
- Table 131: Argentina Pea Flakes Market Revenue (Million) Forecast, by Application 2019 & 2032
- Table 132: Argentina Pea Flakes Market Volume (K Tons) Forecast, by Application 2019 & 2032
- Table 133: Rest of South America Pea Flakes Market Revenue (Million) Forecast, by Application 2019 & 2032
- Table 134: Rest of South America Pea Flakes Market Volume (K Tons) Forecast, by Application 2019 & 2032
- Table 135: Global Pea Flakes Market Revenue Million Forecast, by Type 2019 & 2032
- Table 136: Global Pea Flakes Market Volume K Tons Forecast, by Type 2019 & 2032
- Table 137: Global Pea Flakes Market Revenue Million Forecast, by Application 2019 & 2032
- Table 138: Global Pea Flakes Market Volume K Tons Forecast, by Application 2019 & 2032
- Table 139: Global Pea Flakes Market Revenue Million Forecast, by Distribution Channel 2019 & 2032
- Table 140: Global Pea Flakes Market Volume K Tons Forecast, by Distribution Channel 2019 & 2032
- Table 141: Global Pea Flakes Market Revenue Million Forecast, by Country 2019 & 2032
- Table 142: Global Pea Flakes Market Volume K Tons Forecast, by Country 2019 & 2032
- Table 143: South Africa Pea Flakes Market Revenue (Million) Forecast, by Application 2019 & 2032
- Table 144: South Africa Pea Flakes Market Volume (K Tons) Forecast, by Application 2019 & 2032
- Table 145: Saudi Arabia Pea Flakes Market Revenue (Million) Forecast, by Application 2019 & 2032
- Table 146: Saudi Arabia Pea Flakes Market Volume (K Tons) Forecast, by Application 2019 & 2032
- Table 147: Rest of Middle East and Africa Pea Flakes Market Revenue (Million) Forecast, by Application 2019 & 2032
- Table 148: Rest of Middle East and Africa Pea Flakes Market Volume (K Tons) Forecast, by Application 2019 & 2032
Frequently Asked Questions
1. What is the projected Compound Annual Growth Rate (CAGR) of the Pea Flakes Market?
The projected CAGR is approximately 9.51%.
2. Which companies are prominent players in the Pea Flakes Market?
Key companies in the market include BP Milling, Garden Valley Foods, Gemef Industries (Sotexpro), Wheeeky Pets, Dumoulin S A, Om Foods Inc, JR Farm, Inland Empire Foods Inc, Exotic Nutrition*List Not Exhaustive, AGT Foods and Ingredients Inc..
3. What are the main segments of the Pea Flakes Market?
The market segments include Type, Application, Distribution Channel.
4. Can you provide details about the market size?
The market size is estimated to be USD 1,788 Million as of 2022.
5. What are some drivers contributing to market growth?
Increasing application of Gelatin in healthcare and pharmaceutical sector.
6. What are the notable trends driving market growth?
Pea Flakes find Extensive Application in Food Industry.
7. Are there any restraints impacting market growth?
Rising demand for clean label products.
8. Can you provide examples of recent developments in the market?
New pea flake processing lines for increased production capacity
9. What pricing options are available for accessing the report?
Pricing options include single-user, multi-user, and enterprise licenses priced at USD 4750, USD 5250, and USD 8750 respectively.
10. Is the market size provided in terms of value or volume?
The market size is provided in terms of value, measured in Million and volume, measured in K Tons.
11. Are there any specific market keywords associated with the report?
Yes, the market keyword associated with the report is "Pea Flakes Market," which aids in identifying and referencing the specific market segment covered.
12. How do I determine which pricing option suits my needs best?
The pricing options vary based on user requirements and access needs. Individual users may opt for single-user licenses, while businesses requiring broader access may choose multi-user or enterprise licenses for cost-effective access to the report.
13. Are there any additional resources or data provided in the Pea Flakes Market report?
While the report offers comprehensive insights, it's advisable to review the specific contents or supplementary materials provided to ascertain if additional resources or data are available.
14. How can I stay updated on further developments or reports in the Pea Flakes Market?
To stay informed about further developments, trends, and reports in the Pea Flakes Market, consider subscribing to industry newsletters, following relevant companies and organizations, or regularly checking reputable industry news sources and publications.
Methodology
Step 1 - Identification of Relevant Samples Size from Population Database


Step 2 - Approaches for Defining Global Market Size (Value, Volume* & Price*)

Note*: In applicable scenarios
Step 3 - Data Sources
Primary Research
- Web Analytics
- Survey Reports
- Research Institute
- Latest Research Reports
- Opinion Leaders
Secondary Research
- Annual Reports
- White Paper
- Latest Press Release
- Industry Association
- Paid Database
- Investor Presentations

Step 4 - Data Triangulation
Involves using different sources of information in order to increase the validity of a study
These sources are likely to be stakeholders in a program - participants, other researchers, program staff, other community members, and so on.
Then we put all data in single framework & apply various statistical tools to find out the dynamic on the market.
During the analysis stage, feedback from the stakeholder groups would be compared to determine areas of agreement as well as areas of divergence


