
Key Insights
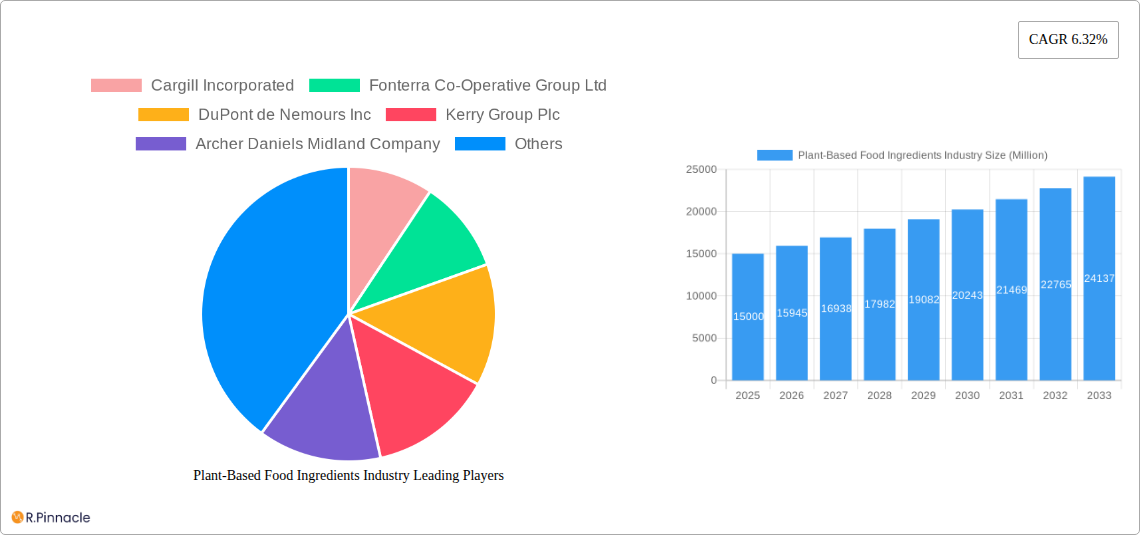
The plant-based food ingredients market is experiencing robust growth, driven by increasing consumer demand for healthier and more sustainable food options. The rising awareness of the environmental impact of animal agriculture and the associated health benefits of plant-based diets are significant factors fueling this expansion. A CAGR of 6.32% indicates a substantial increase in market value over the forecast period (2025-2033). Soy protein, encompassing isolates, concentrates, and textured soy protein, holds a dominant position within the plant-based protein segment, followed by other plant-based sources like pea protein, rice protein, and others. The application areas are diverse, with animal feed exhibiting significant demand due to the growing livestock industry's focus on sustainable and cost-effective protein sources. The food and beverage sector is another substantial contributor, showcasing the increasing integration of plant-based ingredients into a wide range of products, from meat alternatives to dairy-free options. The supplements sector, encompassing infant formulations, cosmetics, and pharmaceuticals, demonstrates the versatility and expanding applications of these ingredients. Major players like Cargill, Fonterra, and DuPont are actively involved in research and development, driving innovation in product development and expanding market reach. While the market faces some restraints, including price fluctuations in raw materials and stringent regulatory frameworks in certain regions, these challenges are outweighed by the substantial growth drivers, promising continued expansion in the coming years.
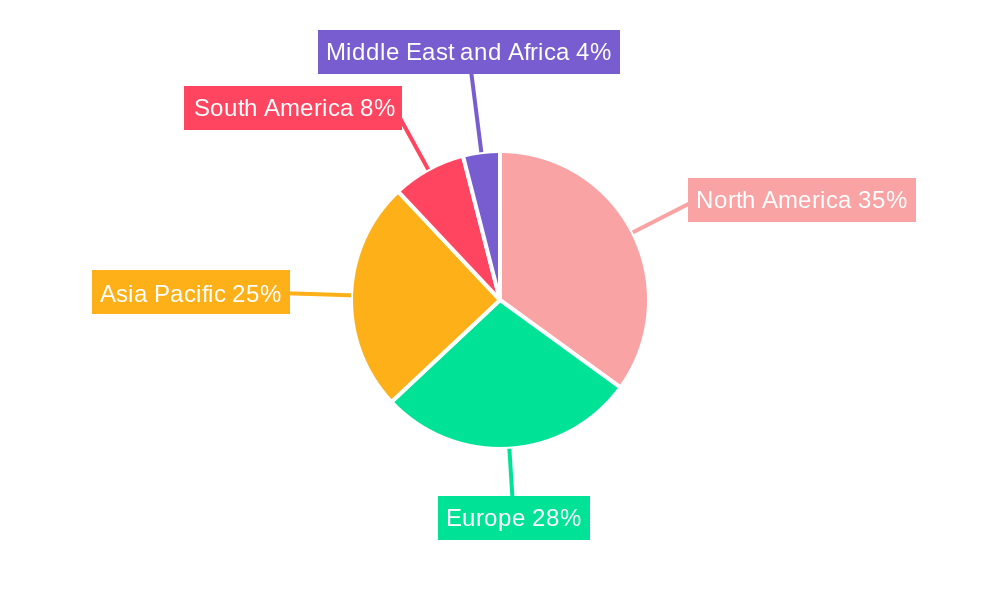
The geographical distribution of the market is quite widespread, with North America and Europe currently holding significant market shares. However, the Asia-Pacific region, particularly China and India, exhibits high growth potential due to rising incomes, changing dietary habits, and a burgeoning population. South America and the Middle East and Africa also present opportunities for expansion, although at a potentially slower pace than the aforementioned regions. This diverse geographical spread presents both challenges and opportunities for companies operating within the plant-based food ingredients sector; adaptation to regional preferences and regulatory landscapes will be crucial for success. Continued innovation in product development, focusing on improved taste, texture, and affordability, will be vital in maintaining the market’s strong growth trajectory.
Plant-Based Food Ingredients Industry: A Comprehensive Market Report (2019-2033)
This in-depth report provides a comprehensive analysis of the Plant-Based Food Ingredients industry, offering invaluable insights for industry professionals, investors, and strategic planners. Covering the period from 2019 to 2033, with a focus on 2025, this report unveils the market's structure, dynamics, and future trajectory. Expect detailed segmentation analysis, key player profiles, and in-depth exploration of growth drivers and challenges. The report projects a market size of xx Million by 2033, fueled by increasing consumer demand and technological advancements.
Plant-Based Food Ingredients Industry Market Structure & Innovation Trends
This section analyzes the competitive landscape, innovation drivers, and regulatory influences shaping the plant-based food ingredients market. The market exhibits a moderately concentrated structure, with key players like Cargill Incorporated, Fonterra Co-Operative Group Ltd, DuPont de Nemours Inc, Kerry Group Plc, Archer Daniels Midland Company, and BASF SE holding significant market share. However, smaller specialized companies like DAR PRO Ingredients, Roquette Freres, Tate & Lyle PLC, and Axiom Foods are also contributing significantly to innovation and market growth. The estimated combined market share of the top 6 players is approximately xx%.
- Market Concentration: Moderate, with key players holding significant but not dominant shares.
- Innovation Drivers: Growing consumer demand for plant-based alternatives, technological advancements in ingredient processing, and increasing focus on sustainability.
- Regulatory Frameworks: Varying regulations across regions influence product development and market access.
- Product Substitutes: Traditional animal-derived ingredients and other plant-based alternatives create competitive pressures.
- End-User Demographics: The primary end-users are food & beverage manufacturers, supplement producers, and animal feed companies, with increasing demand from the cosmetics and personal care sector.
- M&A Activities: The industry has witnessed significant M&A activity in recent years, with deal values totaling xx Million in the period 2019-2024. Examples include the Marfrig and ADM joint venture, Plantplus Foods.
Plant-Based Food Ingredients Industry Market Dynamics & Trends
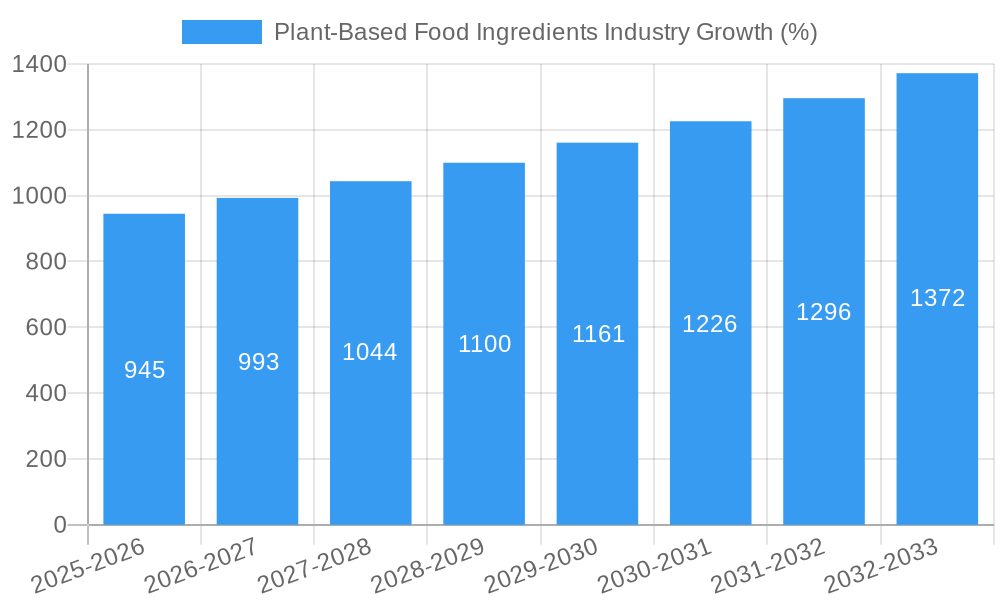
The plant-based food ingredients market is experiencing robust growth, driven by several key factors. The rising global population and increasing awareness of health and environmental benefits are primary drivers. Technological innovations, such as advanced protein extraction techniques and novel ingredient formulations, are significantly improving product quality and expanding applications. Consumer preferences are shifting towards healthier and more sustainable food choices, boosting the demand for plant-based alternatives. Competitive dynamics are characterized by both intense rivalry among established players and the emergence of new entrants, leading to continuous innovation and product diversification. The market is expected to exhibit a CAGR of xx% during the forecast period (2025-2033), with market penetration steadily increasing across various applications.
Dominant Regions & Segments in Plant-Based Food Ingredients Industry
North America currently dominates the plant-based food ingredients market, driven by high consumer demand, strong regulatory support, and the presence of major industry players. However, Asia-Pacific is projected to witness significant growth in the coming years due to rapid economic development and changing dietary habits.
- Leading Region: North America
- Key Drivers (North America): High consumer awareness, strong regulatory support, established supply chains, and large market size.
- Key Drivers (Asia-Pacific): Rapid economic growth, increasing disposable incomes, shifting dietary habits towards plant-based options.
Dominant Segments:
- By Application: The Food & Beverage segment holds the largest market share, followed by Animal Feed. The Supplements segment is also experiencing significant growth due to the rising demand for plant-based dietary supplements.
- By Source: Soy Protein, encompassing isolates, concentrates, and textured soy protein, holds a major market share. Dairy ingredients (whey protein, casein) are also important, but the market is increasingly dominated by plant-based options.
- Others (Plant Source): Pea protein, fava bean protein, and other plant-based proteins are rapidly gaining traction due to their nutritional benefits and sustainability.
Plant-Based Food Ingredients Industry Product Innovations
Recent years have seen significant innovations in plant-based food ingredients. Companies are developing new protein sources and improving extraction techniques to enhance product quality and functionality. There's a strong focus on creating products with improved texture, taste, and nutritional profiles, addressing consumer concerns regarding taste and texture limitations. Technological advancements such as precision fermentation are opening up new avenues for producing sustainable and scalable plant-based ingredients. These innovations are driving market growth and enhancing the competitiveness of plant-based options compared to traditional animal-derived ingredients.
Report Scope & Segmentation Analysis
This report comprehensively analyzes the plant-based food ingredients market across various segments:
- By Source: Animal Source, Dairy Ingredients (Whey Protein Concentrates, Whey Protein Hydrolysates, Whey Protein Isolates, Casein & Caseinates), Soy Protein (Soy Protein Isolates, Soy Protein Concentrates, Textured Soy Protein), Others (Plant Source). Each segment is analyzed for its growth potential, market size, and competitive dynamics.
- By Application: Animal Feed, Food & Beverage, Supplements (Infant Formulations, Cosmetics & Personal Care, Pharmaceuticals). The report details market size projections for each application area, identifying high-growth segments.
Growth projections for each segment are included in the report, based on market research and industry forecasts. Competitive dynamics within each segment are also analyzed, highlighting key players and their strategies.
Key Drivers of Plant-Based Food Ingredients Industry Growth
The plant-based food ingredients industry's growth is propelled by several factors: the increasing demand for healthier and more sustainable food products, driven by growing health consciousness and environmental concerns. Technological advancements in ingredient processing, such as precision fermentation, are leading to improved product quality and affordability. Favorable government regulations and policies promoting plant-based alternatives are further stimulating market growth. The rising popularity of veganism and vegetarianism is fueling this expansion.
Challenges in the Plant-Based Food Ingredients Industry Sector
Despite its positive outlook, the industry faces challenges. Supply chain volatility can lead to price fluctuations and production disruptions, particularly for specific plant-based ingredients. Competition from established animal-derived ingredient producers creates pressure on pricing and market share. Meeting consumer expectations regarding taste, texture, and functionality remains a crucial challenge, requiring continuous product innovation. Furthermore, regulatory hurdles and the need for consistent quality control can also pose barriers to growth. The market is projected to lose xx Million due to these challenges during the forecast period.
Emerging Opportunities in Plant-Based Food Ingredients Industry
The plant-based food ingredients market presents significant opportunities. Expansion into new geographic markets, particularly in developing countries with rising middle classes, offers substantial potential. Innovations in ingredient technology, such as utilizing novel plant sources and developing products with enhanced nutritional and functional properties, can significantly increase market penetration. Targeting specific niche consumer segments, like athletes and individuals with dietary restrictions, opens new avenues for product development and marketing.
Leading Players in the Plant-Based Food Ingredients Industry Market
- Cargill Incorporated
- Fonterra Co-Operative Group Ltd
- DuPont de Nemours Inc
- Kerry Group Plc
- Archer Daniels Midland Company
- BASF SE
- DAR PRO Ingredients
- Roquette Freres
- Tate & Lyle PLC
- Axiom Foods
Key Developments in Plant-Based Food Ingredients Industry Industry
- October 2021: Arla Foods Ingredients launched Lacprodan BLG-100, a pure BLG ingredient with a higher leucine content.
- November 2021: FrieslandCampina Ingredients partnered with AGT Foods to launch pea and fava bean isolates.
- May 2020: Marfrig and ADM announced Plantplus Foods, a joint venture focusing on plant-based products.
Future Outlook for Plant-Based Food Ingredients Industry Market
The future of the plant-based food ingredients market appears bright. The ongoing shift toward plant-based diets, fueled by health and sustainability concerns, will continue to drive market growth. Technological advancements and innovations in ingredient processing will play a crucial role in improving product quality and expanding market applications. Strategic partnerships and collaborations among industry players will be key to accelerating innovation and expanding market reach. The market is poised for significant expansion, with continued growth expected throughout the forecast period.
Plant-Based Food Ingredients Industry Segmentation
-
1. Source
-
1.1. Animal Source
-
1.1.1. Dairy Ingredients
- 1.1.1.1. Whey Protein Concentrates
- 1.1.1.2. Whey Protein Hydrolysates
- 1.1.1.3. Whey Protein Isolates
- 1.1.1.4. Casein & Caseinates
- 1.1.2. Egg Protein
- 1.1.3. Gelatin
- 1.1.4. Others
-
1.1.1. Dairy Ingredients
-
1.2. Plant Source
-
1.2.1. Soy Protein
- 1.2.1.1. Soy Protein Isolates
- 1.2.1.2. Soy Protein Concentrates
- 1.2.1.3. Textured Soy Protein
- 1.2.2. Wheat Protein
- 1.2.3. Vegetable Protein
-
1.2.1. Soy Protein
-
1.1. Animal Source
-
2. Application
- 2.1. Animal Feed
-
2.2. Food & Beverage
- 2.2.1. Supplements
- 2.3. Infant Formulations
- 2.4. Cosmetics & Personal Care
- 2.5. Pharmaceuticals
Plant-Based Food Ingredients Industry Segmentation By Geography
-
1. North America
- 1.1. United States
- 1.2. Canada
- 1.3. Mexico
- 1.4. Rest of North America
-
2. Europe
- 2.1. Spain
- 2.2. United Kingdom
- 2.3. Germany
- 2.4. France
- 2.5. Italy
- 2.6. Russia
- 2.7. Rest of Europe
-
3. Asia Pacific
- 3.1. China
- 3.2. Japan
- 3.3. India
- 3.4. Australia
- 3.5. Rest of Asia Pacific
-
4. South America
- 4.1. Brazil
- 4.2. Argentina
- 4.3. Rest of South America
-
5. Middle East and Africa
- 5.1. South Africa
- 5.2. Saudi Arabia
- 5.3. Rest of Middle East and Africa
Plant-Based Food Ingredients Industry REPORT HIGHLIGHTS
| Aspects | Details |
|---|---|
| Study Period | 2019-2033 |
| Base Year | 2024 |
| Estimated Year | 2025 |
| Forecast Period | 2025-2033 |
| Historical Period | 2019-2024 |
| Growth Rate | CAGR of 6.32% from 2019-2033 |
| Segmentation |
|
Table of Contents
- 1. Introduction
- 1.1. Research Scope
- 1.2. Market Segmentation
- 1.3. Research Methodology
- 1.4. Definitions and Assumptions
- 2. Executive Summary
- 2.1. Introduction
- 3. Market Dynamics
- 3.1. Introduction
- 3.2. Market Drivers
- 3.2.1. Growing Inclination Towards Plant-Based Protein Sources; Rising Application Capabilities of Pea Protein
- 3.3. Market Restrains
- 3.3.1. Rising Popularity and Availability of Other Plant-based Proteins
- 3.4. Market Trends
- 3.4.1. Rising Health Benefits Associated with Protein
- 4. Market Factor Analysis
- 4.1. Porters Five Forces
- 4.2. Supply/Value Chain
- 4.3. PESTEL analysis
- 4.4. Market Entropy
- 4.5. Patent/Trademark Analysis
- 5. Global Plant-Based Food Ingredients Industry Analysis, Insights and Forecast, 2019-2031
- 5.1. Market Analysis, Insights and Forecast - by Source
- 5.1.1. Animal Source
- 5.1.1.1. Dairy Ingredients
- 5.1.1.1.1. Whey Protein Concentrates
- 5.1.1.1.2. Whey Protein Hydrolysates
- 5.1.1.1.3. Whey Protein Isolates
- 5.1.1.1.4. Casein & Caseinates
- 5.1.1.2. Egg Protein
- 5.1.1.3. Gelatin
- 5.1.1.4. Others
- 5.1.1.1. Dairy Ingredients
- 5.1.2. Plant Source
- 5.1.2.1. Soy Protein
- 5.1.2.1.1. Soy Protein Isolates
- 5.1.2.1.2. Soy Protein Concentrates
- 5.1.2.1.3. Textured Soy Protein
- 5.1.2.2. Wheat Protein
- 5.1.2.3. Vegetable Protein
- 5.1.2.1. Soy Protein
- 5.1.1. Animal Source
- 5.2. Market Analysis, Insights and Forecast - by Application
- 5.2.1. Animal Feed
- 5.2.2. Food & Beverage
- 5.2.2.1. Supplements
- 5.2.3. Infant Formulations
- 5.2.4. Cosmetics & Personal Care
- 5.2.5. Pharmaceuticals
- 5.3. Market Analysis, Insights and Forecast - by Region
- 5.3.1. North America
- 5.3.2. Europe
- 5.3.3. Asia Pacific
- 5.3.4. South America
- 5.3.5. Middle East and Africa
- 5.1. Market Analysis, Insights and Forecast - by Source
- 6. North America Plant-Based Food Ingredients Industry Analysis, Insights and Forecast, 2019-2031
- 6.1. Market Analysis, Insights and Forecast - by Source
- 6.1.1. Animal Source
- 6.1.1.1. Dairy Ingredients
- 6.1.1.1.1. Whey Protein Concentrates
- 6.1.1.1.2. Whey Protein Hydrolysates
- 6.1.1.1.3. Whey Protein Isolates
- 6.1.1.1.4. Casein & Caseinates
- 6.1.1.2. Egg Protein
- 6.1.1.3. Gelatin
- 6.1.1.4. Others
- 6.1.1.1. Dairy Ingredients
- 6.1.2. Plant Source
- 6.1.2.1. Soy Protein
- 6.1.2.1.1. Soy Protein Isolates
- 6.1.2.1.2. Soy Protein Concentrates
- 6.1.2.1.3. Textured Soy Protein
- 6.1.2.2. Wheat Protein
- 6.1.2.3. Vegetable Protein
- 6.1.2.1. Soy Protein
- 6.1.1. Animal Source
- 6.2. Market Analysis, Insights and Forecast - by Application
- 6.2.1. Animal Feed
- 6.2.2. Food & Beverage
- 6.2.2.1. Supplements
- 6.2.3. Infant Formulations
- 6.2.4. Cosmetics & Personal Care
- 6.2.5. Pharmaceuticals
- 6.1. Market Analysis, Insights and Forecast - by Source
- 7. Europe Plant-Based Food Ingredients Industry Analysis, Insights and Forecast, 2019-2031
- 7.1. Market Analysis, Insights and Forecast - by Source
- 7.1.1. Animal Source
- 7.1.1.1. Dairy Ingredients
- 7.1.1.1.1. Whey Protein Concentrates
- 7.1.1.1.2. Whey Protein Hydrolysates
- 7.1.1.1.3. Whey Protein Isolates
- 7.1.1.1.4. Casein & Caseinates
- 7.1.1.2. Egg Protein
- 7.1.1.3. Gelatin
- 7.1.1.4. Others
- 7.1.1.1. Dairy Ingredients
- 7.1.2. Plant Source
- 7.1.2.1. Soy Protein
- 7.1.2.1.1. Soy Protein Isolates
- 7.1.2.1.2. Soy Protein Concentrates
- 7.1.2.1.3. Textured Soy Protein
- 7.1.2.2. Wheat Protein
- 7.1.2.3. Vegetable Protein
- 7.1.2.1. Soy Protein
- 7.1.1. Animal Source
- 7.2. Market Analysis, Insights and Forecast - by Application
- 7.2.1. Animal Feed
- 7.2.2. Food & Beverage
- 7.2.2.1. Supplements
- 7.2.3. Infant Formulations
- 7.2.4. Cosmetics & Personal Care
- 7.2.5. Pharmaceuticals
- 7.1. Market Analysis, Insights and Forecast - by Source
- 8. Asia Pacific Plant-Based Food Ingredients Industry Analysis, Insights and Forecast, 2019-2031
- 8.1. Market Analysis, Insights and Forecast - by Source
- 8.1.1. Animal Source
- 8.1.1.1. Dairy Ingredients
- 8.1.1.1.1. Whey Protein Concentrates
- 8.1.1.1.2. Whey Protein Hydrolysates
- 8.1.1.1.3. Whey Protein Isolates
- 8.1.1.1.4. Casein & Caseinates
- 8.1.1.2. Egg Protein
- 8.1.1.3. Gelatin
- 8.1.1.4. Others
- 8.1.1.1. Dairy Ingredients
- 8.1.2. Plant Source
- 8.1.2.1. Soy Protein
- 8.1.2.1.1. Soy Protein Isolates
- 8.1.2.1.2. Soy Protein Concentrates
- 8.1.2.1.3. Textured Soy Protein
- 8.1.2.2. Wheat Protein
- 8.1.2.3. Vegetable Protein
- 8.1.2.1. Soy Protein
- 8.1.1. Animal Source
- 8.2. Market Analysis, Insights and Forecast - by Application
- 8.2.1. Animal Feed
- 8.2.2. Food & Beverage
- 8.2.2.1. Supplements
- 8.2.3. Infant Formulations
- 8.2.4. Cosmetics & Personal Care
- 8.2.5. Pharmaceuticals
- 8.1. Market Analysis, Insights and Forecast - by Source
- 9. South America Plant-Based Food Ingredients Industry Analysis, Insights and Forecast, 2019-2031
- 9.1. Market Analysis, Insights and Forecast - by Source
- 9.1.1. Animal Source
- 9.1.1.1. Dairy Ingredients
- 9.1.1.1.1. Whey Protein Concentrates
- 9.1.1.1.2. Whey Protein Hydrolysates
- 9.1.1.1.3. Whey Protein Isolates
- 9.1.1.1.4. Casein & Caseinates
- 9.1.1.2. Egg Protein
- 9.1.1.3. Gelatin
- 9.1.1.4. Others
- 9.1.1.1. Dairy Ingredients
- 9.1.2. Plant Source
- 9.1.2.1. Soy Protein
- 9.1.2.1.1. Soy Protein Isolates
- 9.1.2.1.2. Soy Protein Concentrates
- 9.1.2.1.3. Textured Soy Protein
- 9.1.2.2. Wheat Protein
- 9.1.2.3. Vegetable Protein
- 9.1.2.1. Soy Protein
- 9.1.1. Animal Source
- 9.2. Market Analysis, Insights and Forecast - by Application
- 9.2.1. Animal Feed
- 9.2.2. Food & Beverage
- 9.2.2.1. Supplements
- 9.2.3. Infant Formulations
- 9.2.4. Cosmetics & Personal Care
- 9.2.5. Pharmaceuticals
- 9.1. Market Analysis, Insights and Forecast - by Source
- 10. Middle East and Africa Plant-Based Food Ingredients Industry Analysis, Insights and Forecast, 2019-2031
- 10.1. Market Analysis, Insights and Forecast - by Source
- 10.1.1. Animal Source
- 10.1.1.1. Dairy Ingredients
- 10.1.1.1.1. Whey Protein Concentrates
- 10.1.1.1.2. Whey Protein Hydrolysates
- 10.1.1.1.3. Whey Protein Isolates
- 10.1.1.1.4. Casein & Caseinates
- 10.1.1.2. Egg Protein
- 10.1.1.3. Gelatin
- 10.1.1.4. Others
- 10.1.1.1. Dairy Ingredients
- 10.1.2. Plant Source
- 10.1.2.1. Soy Protein
- 10.1.2.1.1. Soy Protein Isolates
- 10.1.2.1.2. Soy Protein Concentrates
- 10.1.2.1.3. Textured Soy Protein
- 10.1.2.2. Wheat Protein
- 10.1.2.3. Vegetable Protein
- 10.1.2.1. Soy Protein
- 10.1.1. Animal Source
- 10.2. Market Analysis, Insights and Forecast - by Application
- 10.2.1. Animal Feed
- 10.2.2. Food & Beverage
- 10.2.2.1. Supplements
- 10.2.3. Infant Formulations
- 10.2.4. Cosmetics & Personal Care
- 10.2.5. Pharmaceuticals
- 10.1. Market Analysis, Insights and Forecast - by Source
- 11. North America Plant-Based Food Ingredients Industry Analysis, Insights and Forecast, 2019-2031
- 11.1. Market Analysis, Insights and Forecast - By Country/Sub-region
- 11.1.1 United States
- 11.1.2 Canada
- 11.1.3 Mexico
- 11.1.4 Rest of North America
- 12. Europe Plant-Based Food Ingredients Industry Analysis, Insights and Forecast, 2019-2031
- 12.1. Market Analysis, Insights and Forecast - By Country/Sub-region
- 12.1.1 Spain
- 12.1.2 United Kingdom
- 12.1.3 Germany
- 12.1.4 France
- 12.1.5 Italy
- 12.1.6 Russia
- 12.1.7 Rest of Europe
- 13. Asia Pacific Plant-Based Food Ingredients Industry Analysis, Insights and Forecast, 2019-2031
- 13.1. Market Analysis, Insights and Forecast - By Country/Sub-region
- 13.1.1 China
- 13.1.2 Japan
- 13.1.3 India
- 13.1.4 Australia
- 13.1.5 Rest of Asia Pacific
- 14. South America Plant-Based Food Ingredients Industry Analysis, Insights and Forecast, 2019-2031
- 14.1. Market Analysis, Insights and Forecast - By Country/Sub-region
- 14.1.1 Brazil
- 14.1.2 Argentina
- 14.1.3 Rest of South America
- 15. Middle East and Africa Plant-Based Food Ingredients Industry Analysis, Insights and Forecast, 2019-2031
- 15.1. Market Analysis, Insights and Forecast - By Country/Sub-region
- 15.1.1 South Africa
- 15.1.2 Saudi Arabia
- 15.1.3 Rest of Middle East and Africa
- 16. Competitive Analysis
- 16.1. Global Market Share Analysis 2024
- 16.2. Company Profiles
- 16.2.1 Cargill Incorporated
- 16.2.1.1. Overview
- 16.2.1.2. Products
- 16.2.1.3. SWOT Analysis
- 16.2.1.4. Recent Developments
- 16.2.1.5. Financials (Based on Availability)
- 16.2.2 Fonterra Co-Operative Group Ltd
- 16.2.2.1. Overview
- 16.2.2.2. Products
- 16.2.2.3. SWOT Analysis
- 16.2.2.4. Recent Developments
- 16.2.2.5. Financials (Based on Availability)
- 16.2.3 DuPont de Nemours Inc
- 16.2.3.1. Overview
- 16.2.3.2. Products
- 16.2.3.3. SWOT Analysis
- 16.2.3.4. Recent Developments
- 16.2.3.5. Financials (Based on Availability)
- 16.2.4 Kerry Group Plc
- 16.2.4.1. Overview
- 16.2.4.2. Products
- 16.2.4.3. SWOT Analysis
- 16.2.4.4. Recent Developments
- 16.2.4.5. Financials (Based on Availability)
- 16.2.5 Archer Daniels Midland Company
- 16.2.5.1. Overview
- 16.2.5.2. Products
- 16.2.5.3. SWOT Analysis
- 16.2.5.4. Recent Developments
- 16.2.5.5. Financials (Based on Availability)
- 16.2.6 BASF SE*List Not Exhaustive
- 16.2.6.1. Overview
- 16.2.6.2. Products
- 16.2.6.3. SWOT Analysis
- 16.2.6.4. Recent Developments
- 16.2.6.5. Financials (Based on Availability)
- 16.2.7 DAR PRO Ingredients
- 16.2.7.1. Overview
- 16.2.7.2. Products
- 16.2.7.3. SWOT Analysis
- 16.2.7.4. Recent Developments
- 16.2.7.5. Financials (Based on Availability)
- 16.2.8 Roquette Freres
- 16.2.8.1. Overview
- 16.2.8.2. Products
- 16.2.8.3. SWOT Analysis
- 16.2.8.4. Recent Developments
- 16.2.8.5. Financials (Based on Availability)
- 16.2.9 Tate & Lyle PLC
- 16.2.9.1. Overview
- 16.2.9.2. Products
- 16.2.9.3. SWOT Analysis
- 16.2.9.4. Recent Developments
- 16.2.9.5. Financials (Based on Availability)
- 16.2.10 Axiom Foods
- 16.2.10.1. Overview
- 16.2.10.2. Products
- 16.2.10.3. SWOT Analysis
- 16.2.10.4. Recent Developments
- 16.2.10.5. Financials (Based on Availability)
- 16.2.1 Cargill Incorporated
List of Figures
- Figure 1: Global Plant-Based Food Ingredients Industry Revenue Breakdown (Million, %) by Region 2024 & 2032
- Figure 2: Global Plant-Based Food Ingredients Industry Volume Breakdown (K Tons, %) by Region 2024 & 2032
- Figure 3: North America Plant-Based Food Ingredients Industry Revenue (Million), by Country 2024 & 2032
- Figure 4: North America Plant-Based Food Ingredients Industry Volume (K Tons), by Country 2024 & 2032
- Figure 5: North America Plant-Based Food Ingredients Industry Revenue Share (%), by Country 2024 & 2032
- Figure 6: North America Plant-Based Food Ingredients Industry Volume Share (%), by Country 2024 & 2032
- Figure 7: Europe Plant-Based Food Ingredients Industry Revenue (Million), by Country 2024 & 2032
- Figure 8: Europe Plant-Based Food Ingredients Industry Volume (K Tons), by Country 2024 & 2032
- Figure 9: Europe Plant-Based Food Ingredients Industry Revenue Share (%), by Country 2024 & 2032
- Figure 10: Europe Plant-Based Food Ingredients Industry Volume Share (%), by Country 2024 & 2032
- Figure 11: Asia Pacific Plant-Based Food Ingredients Industry Revenue (Million), by Country 2024 & 2032
- Figure 12: Asia Pacific Plant-Based Food Ingredients Industry Volume (K Tons), by Country 2024 & 2032
- Figure 13: Asia Pacific Plant-Based Food Ingredients Industry Revenue Share (%), by Country 2024 & 2032
- Figure 14: Asia Pacific Plant-Based Food Ingredients Industry Volume Share (%), by Country 2024 & 2032
- Figure 15: South America Plant-Based Food Ingredients Industry Revenue (Million), by Country 2024 & 2032
- Figure 16: South America Plant-Based Food Ingredients Industry Volume (K Tons), by Country 2024 & 2032
- Figure 17: South America Plant-Based Food Ingredients Industry Revenue Share (%), by Country 2024 & 2032
- Figure 18: South America Plant-Based Food Ingredients Industry Volume Share (%), by Country 2024 & 2032
- Figure 19: Middle East and Africa Plant-Based Food Ingredients Industry Revenue (Million), by Country 2024 & 2032
- Figure 20: Middle East and Africa Plant-Based Food Ingredients Industry Volume (K Tons), by Country 2024 & 2032
- Figure 21: Middle East and Africa Plant-Based Food Ingredients Industry Revenue Share (%), by Country 2024 & 2032
- Figure 22: Middle East and Africa Plant-Based Food Ingredients Industry Volume Share (%), by Country 2024 & 2032
- Figure 23: North America Plant-Based Food Ingredients Industry Revenue (Million), by Source 2024 & 2032
- Figure 24: North America Plant-Based Food Ingredients Industry Volume (K Tons), by Source 2024 & 2032
- Figure 25: North America Plant-Based Food Ingredients Industry Revenue Share (%), by Source 2024 & 2032
- Figure 26: North America Plant-Based Food Ingredients Industry Volume Share (%), by Source 2024 & 2032
- Figure 27: North America Plant-Based Food Ingredients Industry Revenue (Million), by Application 2024 & 2032
- Figure 28: North America Plant-Based Food Ingredients Industry Volume (K Tons), by Application 2024 & 2032
- Figure 29: North America Plant-Based Food Ingredients Industry Revenue Share (%), by Application 2024 & 2032
- Figure 30: North America Plant-Based Food Ingredients Industry Volume Share (%), by Application 2024 & 2032
- Figure 31: North America Plant-Based Food Ingredients Industry Revenue (Million), by Country 2024 & 2032
- Figure 32: North America Plant-Based Food Ingredients Industry Volume (K Tons), by Country 2024 & 2032
- Figure 33: North America Plant-Based Food Ingredients Industry Revenue Share (%), by Country 2024 & 2032
- Figure 34: North America Plant-Based Food Ingredients Industry Volume Share (%), by Country 2024 & 2032
- Figure 35: Europe Plant-Based Food Ingredients Industry Revenue (Million), by Source 2024 & 2032
- Figure 36: Europe Plant-Based Food Ingredients Industry Volume (K Tons), by Source 2024 & 2032
- Figure 37: Europe Plant-Based Food Ingredients Industry Revenue Share (%), by Source 2024 & 2032
- Figure 38: Europe Plant-Based Food Ingredients Industry Volume Share (%), by Source 2024 & 2032
- Figure 39: Europe Plant-Based Food Ingredients Industry Revenue (Million), by Application 2024 & 2032
- Figure 40: Europe Plant-Based Food Ingredients Industry Volume (K Tons), by Application 2024 & 2032
- Figure 41: Europe Plant-Based Food Ingredients Industry Revenue Share (%), by Application 2024 & 2032
- Figure 42: Europe Plant-Based Food Ingredients Industry Volume Share (%), by Application 2024 & 2032
- Figure 43: Europe Plant-Based Food Ingredients Industry Revenue (Million), by Country 2024 & 2032
- Figure 44: Europe Plant-Based Food Ingredients Industry Volume (K Tons), by Country 2024 & 2032
- Figure 45: Europe Plant-Based Food Ingredients Industry Revenue Share (%), by Country 2024 & 2032
- Figure 46: Europe Plant-Based Food Ingredients Industry Volume Share (%), by Country 2024 & 2032
- Figure 47: Asia Pacific Plant-Based Food Ingredients Industry Revenue (Million), by Source 2024 & 2032
- Figure 48: Asia Pacific Plant-Based Food Ingredients Industry Volume (K Tons), by Source 2024 & 2032
- Figure 49: Asia Pacific Plant-Based Food Ingredients Industry Revenue Share (%), by Source 2024 & 2032
- Figure 50: Asia Pacific Plant-Based Food Ingredients Industry Volume Share (%), by Source 2024 & 2032
- Figure 51: Asia Pacific Plant-Based Food Ingredients Industry Revenue (Million), by Application 2024 & 2032
- Figure 52: Asia Pacific Plant-Based Food Ingredients Industry Volume (K Tons), by Application 2024 & 2032
- Figure 53: Asia Pacific Plant-Based Food Ingredients Industry Revenue Share (%), by Application 2024 & 2032
- Figure 54: Asia Pacific Plant-Based Food Ingredients Industry Volume Share (%), by Application 2024 & 2032
- Figure 55: Asia Pacific Plant-Based Food Ingredients Industry Revenue (Million), by Country 2024 & 2032
- Figure 56: Asia Pacific Plant-Based Food Ingredients Industry Volume (K Tons), by Country 2024 & 2032
- Figure 57: Asia Pacific Plant-Based Food Ingredients Industry Revenue Share (%), by Country 2024 & 2032
- Figure 58: Asia Pacific Plant-Based Food Ingredients Industry Volume Share (%), by Country 2024 & 2032
- Figure 59: South America Plant-Based Food Ingredients Industry Revenue (Million), by Source 2024 & 2032
- Figure 60: South America Plant-Based Food Ingredients Industry Volume (K Tons), by Source 2024 & 2032
- Figure 61: South America Plant-Based Food Ingredients Industry Revenue Share (%), by Source 2024 & 2032
- Figure 62: South America Plant-Based Food Ingredients Industry Volume Share (%), by Source 2024 & 2032
- Figure 63: South America Plant-Based Food Ingredients Industry Revenue (Million), by Application 2024 & 2032
- Figure 64: South America Plant-Based Food Ingredients Industry Volume (K Tons), by Application 2024 & 2032
- Figure 65: South America Plant-Based Food Ingredients Industry Revenue Share (%), by Application 2024 & 2032
- Figure 66: South America Plant-Based Food Ingredients Industry Volume Share (%), by Application 2024 & 2032
- Figure 67: South America Plant-Based Food Ingredients Industry Revenue (Million), by Country 2024 & 2032
- Figure 68: South America Plant-Based Food Ingredients Industry Volume (K Tons), by Country 2024 & 2032
- Figure 69: South America Plant-Based Food Ingredients Industry Revenue Share (%), by Country 2024 & 2032
- Figure 70: South America Plant-Based Food Ingredients Industry Volume Share (%), by Country 2024 & 2032
- Figure 71: Middle East and Africa Plant-Based Food Ingredients Industry Revenue (Million), by Source 2024 & 2032
- Figure 72: Middle East and Africa Plant-Based Food Ingredients Industry Volume (K Tons), by Source 2024 & 2032
- Figure 73: Middle East and Africa Plant-Based Food Ingredients Industry Revenue Share (%), by Source 2024 & 2032
- Figure 74: Middle East and Africa Plant-Based Food Ingredients Industry Volume Share (%), by Source 2024 & 2032
- Figure 75: Middle East and Africa Plant-Based Food Ingredients Industry Revenue (Million), by Application 2024 & 2032
- Figure 76: Middle East and Africa Plant-Based Food Ingredients Industry Volume (K Tons), by Application 2024 & 2032
- Figure 77: Middle East and Africa Plant-Based Food Ingredients Industry Revenue Share (%), by Application 2024 & 2032
- Figure 78: Middle East and Africa Plant-Based Food Ingredients Industry Volume Share (%), by Application 2024 & 2032
- Figure 79: Middle East and Africa Plant-Based Food Ingredients Industry Revenue (Million), by Country 2024 & 2032
- Figure 80: Middle East and Africa Plant-Based Food Ingredients Industry Volume (K Tons), by Country 2024 & 2032
- Figure 81: Middle East and Africa Plant-Based Food Ingredients Industry Revenue Share (%), by Country 2024 & 2032
- Figure 82: Middle East and Africa Plant-Based Food Ingredients Industry Volume Share (%), by Country 2024 & 2032
List of Tables
- Table 1: Global Plant-Based Food Ingredients Industry Revenue Million Forecast, by Region 2019 & 2032
- Table 2: Global Plant-Based Food Ingredients Industry Volume K Tons Forecast, by Region 2019 & 2032
- Table 3: Global Plant-Based Food Ingredients Industry Revenue Million Forecast, by Source 2019 & 2032
- Table 4: Global Plant-Based Food Ingredients Industry Volume K Tons Forecast, by Source 2019 & 2032
- Table 5: Global Plant-Based Food Ingredients Industry Revenue Million Forecast, by Application 2019 & 2032
- Table 6: Global Plant-Based Food Ingredients Industry Volume K Tons Forecast, by Application 2019 & 2032
- Table 7: Global Plant-Based Food Ingredients Industry Revenue Million Forecast, by Region 2019 & 2032
- Table 8: Global Plant-Based Food Ingredients Industry Volume K Tons Forecast, by Region 2019 & 2032
- Table 9: Global Plant-Based Food Ingredients Industry Revenue Million Forecast, by Country 2019 & 2032
- Table 10: Global Plant-Based Food Ingredients Industry Volume K Tons Forecast, by Country 2019 & 2032
- Table 11: United States Plant-Based Food Ingredients Industry Revenue (Million) Forecast, by Application 2019 & 2032
- Table 12: United States Plant-Based Food Ingredients Industry Volume (K Tons) Forecast, by Application 2019 & 2032
- Table 13: Canada Plant-Based Food Ingredients Industry Revenue (Million) Forecast, by Application 2019 & 2032
- Table 14: Canada Plant-Based Food Ingredients Industry Volume (K Tons) Forecast, by Application 2019 & 2032
- Table 15: Mexico Plant-Based Food Ingredients Industry Revenue (Million) Forecast, by Application 2019 & 2032
- Table 16: Mexico Plant-Based Food Ingredients Industry Volume (K Tons) Forecast, by Application 2019 & 2032
- Table 17: Rest of North America Plant-Based Food Ingredients Industry Revenue (Million) Forecast, by Application 2019 & 2032
- Table 18: Rest of North America Plant-Based Food Ingredients Industry Volume (K Tons) Forecast, by Application 2019 & 2032
- Table 19: Global Plant-Based Food Ingredients Industry Revenue Million Forecast, by Country 2019 & 2032
- Table 20: Global Plant-Based Food Ingredients Industry Volume K Tons Forecast, by Country 2019 & 2032
- Table 21: Spain Plant-Based Food Ingredients Industry Revenue (Million) Forecast, by Application 2019 & 2032
- Table 22: Spain Plant-Based Food Ingredients Industry Volume (K Tons) Forecast, by Application 2019 & 2032
- Table 23: United Kingdom Plant-Based Food Ingredients Industry Revenue (Million) Forecast, by Application 2019 & 2032
- Table 24: United Kingdom Plant-Based Food Ingredients Industry Volume (K Tons) Forecast, by Application 2019 & 2032
- Table 25: Germany Plant-Based Food Ingredients Industry Revenue (Million) Forecast, by Application 2019 & 2032
- Table 26: Germany Plant-Based Food Ingredients Industry Volume (K Tons) Forecast, by Application 2019 & 2032
- Table 27: France Plant-Based Food Ingredients Industry Revenue (Million) Forecast, by Application 2019 & 2032
- Table 28: France Plant-Based Food Ingredients Industry Volume (K Tons) Forecast, by Application 2019 & 2032
- Table 29: Italy Plant-Based Food Ingredients Industry Revenue (Million) Forecast, by Application 2019 & 2032
- Table 30: Italy Plant-Based Food Ingredients Industry Volume (K Tons) Forecast, by Application 2019 & 2032
- Table 31: Russia Plant-Based Food Ingredients Industry Revenue (Million) Forecast, by Application 2019 & 2032
- Table 32: Russia Plant-Based Food Ingredients Industry Volume (K Tons) Forecast, by Application 2019 & 2032
- Table 33: Rest of Europe Plant-Based Food Ingredients Industry Revenue (Million) Forecast, by Application 2019 & 2032
- Table 34: Rest of Europe Plant-Based Food Ingredients Industry Volume (K Tons) Forecast, by Application 2019 & 2032
- Table 35: Global Plant-Based Food Ingredients Industry Revenue Million Forecast, by Country 2019 & 2032
- Table 36: Global Plant-Based Food Ingredients Industry Volume K Tons Forecast, by Country 2019 & 2032
- Table 37: China Plant-Based Food Ingredients Industry Revenue (Million) Forecast, by Application 2019 & 2032
- Table 38: China Plant-Based Food Ingredients Industry Volume (K Tons) Forecast, by Application 2019 & 2032
- Table 39: Japan Plant-Based Food Ingredients Industry Revenue (Million) Forecast, by Application 2019 & 2032
- Table 40: Japan Plant-Based Food Ingredients Industry Volume (K Tons) Forecast, by Application 2019 & 2032
- Table 41: India Plant-Based Food Ingredients Industry Revenue (Million) Forecast, by Application 2019 & 2032
- Table 42: India Plant-Based Food Ingredients Industry Volume (K Tons) Forecast, by Application 2019 & 2032
- Table 43: Australia Plant-Based Food Ingredients Industry Revenue (Million) Forecast, by Application 2019 & 2032
- Table 44: Australia Plant-Based Food Ingredients Industry Volume (K Tons) Forecast, by Application 2019 & 2032
- Table 45: Rest of Asia Pacific Plant-Based Food Ingredients Industry Revenue (Million) Forecast, by Application 2019 & 2032
- Table 46: Rest of Asia Pacific Plant-Based Food Ingredients Industry Volume (K Tons) Forecast, by Application 2019 & 2032
- Table 47: Global Plant-Based Food Ingredients Industry Revenue Million Forecast, by Country 2019 & 2032
- Table 48: Global Plant-Based Food Ingredients Industry Volume K Tons Forecast, by Country 2019 & 2032
- Table 49: Brazil Plant-Based Food Ingredients Industry Revenue (Million) Forecast, by Application 2019 & 2032
- Table 50: Brazil Plant-Based Food Ingredients Industry Volume (K Tons) Forecast, by Application 2019 & 2032
- Table 51: Argentina Plant-Based Food Ingredients Industry Revenue (Million) Forecast, by Application 2019 & 2032
- Table 52: Argentina Plant-Based Food Ingredients Industry Volume (K Tons) Forecast, by Application 2019 & 2032
- Table 53: Rest of South America Plant-Based Food Ingredients Industry Revenue (Million) Forecast, by Application 2019 & 2032
- Table 54: Rest of South America Plant-Based Food Ingredients Industry Volume (K Tons) Forecast, by Application 2019 & 2032
- Table 55: Global Plant-Based Food Ingredients Industry Revenue Million Forecast, by Country 2019 & 2032
- Table 56: Global Plant-Based Food Ingredients Industry Volume K Tons Forecast, by Country 2019 & 2032
- Table 57: South Africa Plant-Based Food Ingredients Industry Revenue (Million) Forecast, by Application 2019 & 2032
- Table 58: South Africa Plant-Based Food Ingredients Industry Volume (K Tons) Forecast, by Application 2019 & 2032
- Table 59: Saudi Arabia Plant-Based Food Ingredients Industry Revenue (Million) Forecast, by Application 2019 & 2032
- Table 60: Saudi Arabia Plant-Based Food Ingredients Industry Volume (K Tons) Forecast, by Application 2019 & 2032
- Table 61: Rest of Middle East and Africa Plant-Based Food Ingredients Industry Revenue (Million) Forecast, by Application 2019 & 2032
- Table 62: Rest of Middle East and Africa Plant-Based Food Ingredients Industry Volume (K Tons) Forecast, by Application 2019 & 2032
- Table 63: Global Plant-Based Food Ingredients Industry Revenue Million Forecast, by Source 2019 & 2032
- Table 64: Global Plant-Based Food Ingredients Industry Volume K Tons Forecast, by Source 2019 & 2032
- Table 65: Global Plant-Based Food Ingredients Industry Revenue Million Forecast, by Application 2019 & 2032
- Table 66: Global Plant-Based Food Ingredients Industry Volume K Tons Forecast, by Application 2019 & 2032
- Table 67: Global Plant-Based Food Ingredients Industry Revenue Million Forecast, by Country 2019 & 2032
- Table 68: Global Plant-Based Food Ingredients Industry Volume K Tons Forecast, by Country 2019 & 2032
- Table 69: United States Plant-Based Food Ingredients Industry Revenue (Million) Forecast, by Application 2019 & 2032
- Table 70: United States Plant-Based Food Ingredients Industry Volume (K Tons) Forecast, by Application 2019 & 2032
- Table 71: Canada Plant-Based Food Ingredients Industry Revenue (Million) Forecast, by Application 2019 & 2032
- Table 72: Canada Plant-Based Food Ingredients Industry Volume (K Tons) Forecast, by Application 2019 & 2032
- Table 73: Mexico Plant-Based Food Ingredients Industry Revenue (Million) Forecast, by Application 2019 & 2032
- Table 74: Mexico Plant-Based Food Ingredients Industry Volume (K Tons) Forecast, by Application 2019 & 2032
- Table 75: Rest of North America Plant-Based Food Ingredients Industry Revenue (Million) Forecast, by Application 2019 & 2032
- Table 76: Rest of North America Plant-Based Food Ingredients Industry Volume (K Tons) Forecast, by Application 2019 & 2032
- Table 77: Global Plant-Based Food Ingredients Industry Revenue Million Forecast, by Source 2019 & 2032
- Table 78: Global Plant-Based Food Ingredients Industry Volume K Tons Forecast, by Source 2019 & 2032
- Table 79: Global Plant-Based Food Ingredients Industry Revenue Million Forecast, by Application 2019 & 2032
- Table 80: Global Plant-Based Food Ingredients Industry Volume K Tons Forecast, by Application 2019 & 2032
- Table 81: Global Plant-Based Food Ingredients Industry Revenue Million Forecast, by Country 2019 & 2032
- Table 82: Global Plant-Based Food Ingredients Industry Volume K Tons Forecast, by Country 2019 & 2032
- Table 83: Spain Plant-Based Food Ingredients Industry Revenue (Million) Forecast, by Application 2019 & 2032
- Table 84: Spain Plant-Based Food Ingredients Industry Volume (K Tons) Forecast, by Application 2019 & 2032
- Table 85: United Kingdom Plant-Based Food Ingredients Industry Revenue (Million) Forecast, by Application 2019 & 2032
- Table 86: United Kingdom Plant-Based Food Ingredients Industry Volume (K Tons) Forecast, by Application 2019 & 2032
- Table 87: Germany Plant-Based Food Ingredients Industry Revenue (Million) Forecast, by Application 2019 & 2032
- Table 88: Germany Plant-Based Food Ingredients Industry Volume (K Tons) Forecast, by Application 2019 & 2032
- Table 89: France Plant-Based Food Ingredients Industry Revenue (Million) Forecast, by Application 2019 & 2032
- Table 90: France Plant-Based Food Ingredients Industry Volume (K Tons) Forecast, by Application 2019 & 2032
- Table 91: Italy Plant-Based Food Ingredients Industry Revenue (Million) Forecast, by Application 2019 & 2032
- Table 92: Italy Plant-Based Food Ingredients Industry Volume (K Tons) Forecast, by Application 2019 & 2032
- Table 93: Russia Plant-Based Food Ingredients Industry Revenue (Million) Forecast, by Application 2019 & 2032
- Table 94: Russia Plant-Based Food Ingredients Industry Volume (K Tons) Forecast, by Application 2019 & 2032
- Table 95: Rest of Europe Plant-Based Food Ingredients Industry Revenue (Million) Forecast, by Application 2019 & 2032
- Table 96: Rest of Europe Plant-Based Food Ingredients Industry Volume (K Tons) Forecast, by Application 2019 & 2032
- Table 97: Global Plant-Based Food Ingredients Industry Revenue Million Forecast, by Source 2019 & 2032
- Table 98: Global Plant-Based Food Ingredients Industry Volume K Tons Forecast, by Source 2019 & 2032
- Table 99: Global Plant-Based Food Ingredients Industry Revenue Million Forecast, by Application 2019 & 2032
- Table 100: Global Plant-Based Food Ingredients Industry Volume K Tons Forecast, by Application 2019 & 2032
- Table 101: Global Plant-Based Food Ingredients Industry Revenue Million Forecast, by Country 2019 & 2032
- Table 102: Global Plant-Based Food Ingredients Industry Volume K Tons Forecast, by Country 2019 & 2032
- Table 103: China Plant-Based Food Ingredients Industry Revenue (Million) Forecast, by Application 2019 & 2032
- Table 104: China Plant-Based Food Ingredients Industry Volume (K Tons) Forecast, by Application 2019 & 2032
- Table 105: Japan Plant-Based Food Ingredients Industry Revenue (Million) Forecast, by Application 2019 & 2032
- Table 106: Japan Plant-Based Food Ingredients Industry Volume (K Tons) Forecast, by Application 2019 & 2032
- Table 107: India Plant-Based Food Ingredients Industry Revenue (Million) Forecast, by Application 2019 & 2032
- Table 108: India Plant-Based Food Ingredients Industry Volume (K Tons) Forecast, by Application 2019 & 2032
- Table 109: Australia Plant-Based Food Ingredients Industry Revenue (Million) Forecast, by Application 2019 & 2032
- Table 110: Australia Plant-Based Food Ingredients Industry Volume (K Tons) Forecast, by Application 2019 & 2032
- Table 111: Rest of Asia Pacific Plant-Based Food Ingredients Industry Revenue (Million) Forecast, by Application 2019 & 2032
- Table 112: Rest of Asia Pacific Plant-Based Food Ingredients Industry Volume (K Tons) Forecast, by Application 2019 & 2032
- Table 113: Global Plant-Based Food Ingredients Industry Revenue Million Forecast, by Source 2019 & 2032
- Table 114: Global Plant-Based Food Ingredients Industry Volume K Tons Forecast, by Source 2019 & 2032
- Table 115: Global Plant-Based Food Ingredients Industry Revenue Million Forecast, by Application 2019 & 2032
- Table 116: Global Plant-Based Food Ingredients Industry Volume K Tons Forecast, by Application 2019 & 2032
- Table 117: Global Plant-Based Food Ingredients Industry Revenue Million Forecast, by Country 2019 & 2032
- Table 118: Global Plant-Based Food Ingredients Industry Volume K Tons Forecast, by Country 2019 & 2032
- Table 119: Brazil Plant-Based Food Ingredients Industry Revenue (Million) Forecast, by Application 2019 & 2032
- Table 120: Brazil Plant-Based Food Ingredients Industry Volume (K Tons) Forecast, by Application 2019 & 2032
- Table 121: Argentina Plant-Based Food Ingredients Industry Revenue (Million) Forecast, by Application 2019 & 2032
- Table 122: Argentina Plant-Based Food Ingredients Industry Volume (K Tons) Forecast, by Application 2019 & 2032
- Table 123: Rest of South America Plant-Based Food Ingredients Industry Revenue (Million) Forecast, by Application 2019 & 2032
- Table 124: Rest of South America Plant-Based Food Ingredients Industry Volume (K Tons) Forecast, by Application 2019 & 2032
- Table 125: Global Plant-Based Food Ingredients Industry Revenue Million Forecast, by Source 2019 & 2032
- Table 126: Global Plant-Based Food Ingredients Industry Volume K Tons Forecast, by Source 2019 & 2032
- Table 127: Global Plant-Based Food Ingredients Industry Revenue Million Forecast, by Application 2019 & 2032
- Table 128: Global Plant-Based Food Ingredients Industry Volume K Tons Forecast, by Application 2019 & 2032
- Table 129: Global Plant-Based Food Ingredients Industry Revenue Million Forecast, by Country 2019 & 2032
- Table 130: Global Plant-Based Food Ingredients Industry Volume K Tons Forecast, by Country 2019 & 2032
- Table 131: South Africa Plant-Based Food Ingredients Industry Revenue (Million) Forecast, by Application 2019 & 2032
- Table 132: South Africa Plant-Based Food Ingredients Industry Volume (K Tons) Forecast, by Application 2019 & 2032
- Table 133: Saudi Arabia Plant-Based Food Ingredients Industry Revenue (Million) Forecast, by Application 2019 & 2032
- Table 134: Saudi Arabia Plant-Based Food Ingredients Industry Volume (K Tons) Forecast, by Application 2019 & 2032
- Table 135: Rest of Middle East and Africa Plant-Based Food Ingredients Industry Revenue (Million) Forecast, by Application 2019 & 2032
- Table 136: Rest of Middle East and Africa Plant-Based Food Ingredients Industry Volume (K Tons) Forecast, by Application 2019 & 2032
Frequently Asked Questions
1. What is the projected Compound Annual Growth Rate (CAGR) of the Plant-Based Food Ingredients Industry?
The projected CAGR is approximately 6.32%.
2. Which companies are prominent players in the Plant-Based Food Ingredients Industry?
Key companies in the market include Cargill Incorporated, Fonterra Co-Operative Group Ltd, DuPont de Nemours Inc, Kerry Group Plc, Archer Daniels Midland Company, BASF SE*List Not Exhaustive, DAR PRO Ingredients, Roquette Freres, Tate & Lyle PLC , Axiom Foods.
3. What are the main segments of the Plant-Based Food Ingredients Industry?
The market segments include Source, Application.
4. Can you provide details about the market size?
The market size is estimated to be USD XX Million as of 2022.
5. What are some drivers contributing to market growth?
Growing Inclination Towards Plant-Based Protein Sources; Rising Application Capabilities of Pea Protein.
6. What are the notable trends driving market growth?
Rising Health Benefits Associated with Protein.
7. Are there any restraints impacting market growth?
Rising Popularity and Availability of Other Plant-based Proteins.
8. Can you provide examples of recent developments in the market?
In October 2021, Arla Foods Ingredients has launched a new protein ingredient called Lacprodan BLG-100, which is a pure BLG ingredient with a unique nutritional profile. Produced using a patented new separation technology, it contains 45% more leucine, the main muscle-building amino acid, than commercially available whey protein isolates.
9. What pricing options are available for accessing the report?
Pricing options include single-user, multi-user, and enterprise licenses priced at USD 4750, USD 5250, and USD 8750 respectively.
10. Is the market size provided in terms of value or volume?
The market size is provided in terms of value, measured in Million and volume, measured in K Tons.
11. Are there any specific market keywords associated with the report?
Yes, the market keyword associated with the report is "Plant-Based Food Ingredients Industry," which aids in identifying and referencing the specific market segment covered.
12. How do I determine which pricing option suits my needs best?
The pricing options vary based on user requirements and access needs. Individual users may opt for single-user licenses, while businesses requiring broader access may choose multi-user or enterprise licenses for cost-effective access to the report.
13. Are there any additional resources or data provided in the Plant-Based Food Ingredients Industry report?
While the report offers comprehensive insights, it's advisable to review the specific contents or supplementary materials provided to ascertain if additional resources or data are available.
14. How can I stay updated on further developments or reports in the Plant-Based Food Ingredients Industry?
To stay informed about further developments, trends, and reports in the Plant-Based Food Ingredients Industry, consider subscribing to industry newsletters, following relevant companies and organizations, or regularly checking reputable industry news sources and publications.
Methodology
Step 1 - Identification of Relevant Samples Size from Population Database


Step 2 - Approaches for Defining Global Market Size (Value, Volume* & Price*)

Note*: In applicable scenarios
Step 3 - Data Sources
Primary Research
- Web Analytics
- Survey Reports
- Research Institute
- Latest Research Reports
- Opinion Leaders
Secondary Research
- Annual Reports
- White Paper
- Latest Press Release
- Industry Association
- Paid Database
- Investor Presentations

Step 4 - Data Triangulation
Involves using different sources of information in order to increase the validity of a study
These sources are likely to be stakeholders in a program - participants, other researchers, program staff, other community members, and so on.
Then we put all data in single framework & apply various statistical tools to find out the dynamic on the market.
During the analysis stage, feedback from the stakeholder groups would be compared to determine areas of agreement as well as areas of divergence


