
Key Insights
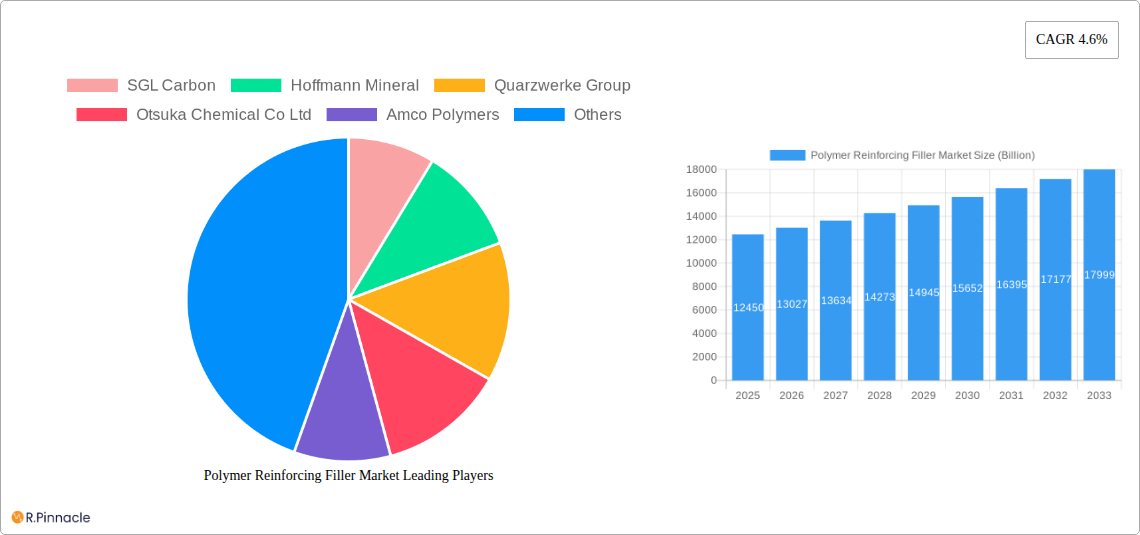
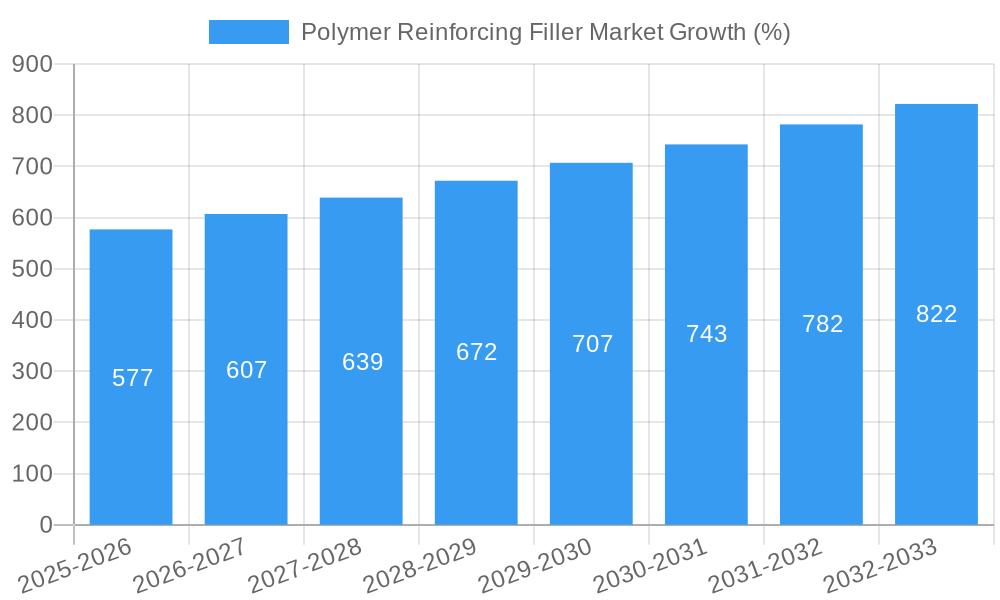
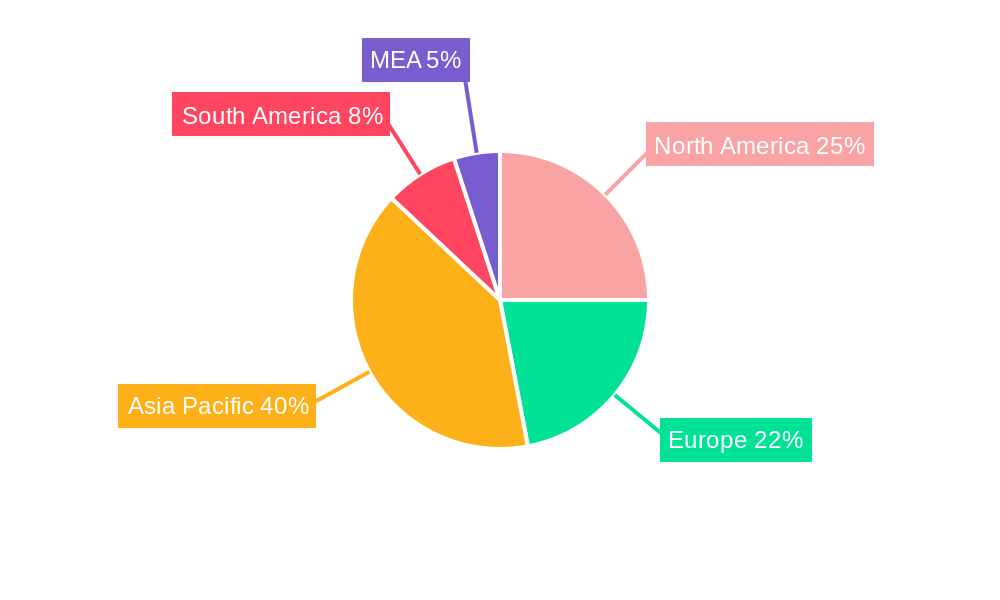
The polymer reinforcing filler market, valued at $12.45 billion in 2025, is projected to experience robust growth, driven by a compound annual growth rate (CAGR) of 4.6% from 2025 to 2033. This expansion is fueled by several key factors. The burgeoning construction industry, particularly in developing economies, significantly boosts demand for lightweight, high-strength composite materials incorporating polymer reinforcing fillers. The automotive sector's increasing adoption of fuel-efficient vehicles and the growing trend towards lightweighting further contribute to market growth. Furthermore, the expanding consumer goods and packaging industries, seeking materials with improved durability and cost-effectiveness, are significant drivers. Organic fillers, like cellulose and wood flour, are gaining traction due to their sustainability and renewability, while inorganic fillers, such as silica and calcium carbonate, maintain dominance owing to their superior performance properties in specific applications. Segment-wise, the building and construction sector holds a substantial market share, followed by the automotive and consumer goods industries. Geographically, Asia-Pacific, led by China and India, is expected to witness the fastest growth, driven by rapid industrialization and infrastructure development. North America and Europe are also expected to contribute significantly, with sustained demand across various end-use sectors.
However, certain challenges exist. Fluctuations in raw material prices, especially for inorganic fillers, can impact profitability. Stringent environmental regulations regarding the use of certain fillers could also pose a constraint. Moreover, competition from alternative reinforcing materials, and the potential for substitution with advanced materials, remains a factor influencing market dynamics. Nevertheless, ongoing research and development in material science, focused on enhancing the performance and sustainability of polymer reinforcing fillers, are expected to mitigate these challenges and drive future growth in the market. The industry is witnessing innovation in filler modification techniques, leading to improved dispersion, interfacial adhesion, and overall composite performance. This innovation, coupled with sustained demand from key end-use sectors, positions the polymer reinforcing filler market for continued expansion throughout the forecast period.
Polymer Reinforcing Filler Market: A Comprehensive Analysis (2019-2033)
This in-depth report provides a comprehensive analysis of the Polymer Reinforcing Filler market, projecting a market value exceeding $XX Billion by 2033. The study covers the period from 2019 to 2033, with a base year of 2025 and a forecast period spanning 2025-2033. This report is essential for industry professionals, investors, and stakeholders seeking actionable insights into this dynamic market.
Polymer Reinforcing Filler Market Market Structure & Innovation Trends
The Polymer Reinforcing Filler market exhibits a moderately concentrated structure, with key players like SGL Carbon, Hoffmann Mineral, and Quarzwerke Group holding significant market share. The exact market share for each company is unavailable, but we estimate a combined share of approximately XX%. Innovation is driven by the need for lightweight, high-strength materials in various applications, particularly in the automotive and construction sectors. Regulatory frameworks, focusing on sustainability and material performance, significantly influence market dynamics. Product substitutes, such as carbon fiber and other reinforcing agents, pose competitive challenges. Mergers and acquisitions (M&A) activity has been moderate in recent years, with deal values averaging approximately $XX Billion annually (2019-2024). The demographics of end-users are shifting towards environmentally conscious consumers, demanding sustainable and high-performance materials. Future M&A activities are predicted to focus on expanding geographical reach and technological capabilities.
Polymer Reinforcing Filler Market Market Dynamics & Trends
The Polymer Reinforcing Filler market is expected to witness robust growth, with a Compound Annual Growth Rate (CAGR) of XX% during the forecast period (2025-2033). This growth is primarily fueled by the increasing demand for high-performance polymers across diverse industries. Technological advancements, such as nanotechnology-enabled fillers, are driving innovation and improving material properties. Consumer preferences are shifting towards lighter, stronger, and more sustainable products, further boosting demand. The competitive landscape is dynamic, with companies focusing on product differentiation and technological advancements to gain market share. Market penetration is expected to increase significantly in emerging economies due to rapid infrastructure development and industrialization. The global market size in 2025 is estimated at $XX Billion, and it is expected to reach $XX Billion by 2033.
Dominant Regions & Segments in Polymer Reinforcing Filler Market
The Asia-Pacific region is currently the dominant market for Polymer Reinforcing Fillers, driven by rapid industrialization, particularly in countries like China and India. Key drivers in this region include robust infrastructure development, expanding automotive and construction sectors, and supportive government policies promoting sustainable materials.
- Key Drivers in Asia-Pacific:
- Strong economic growth fueling infrastructure projects.
- Rapid expansion of the automotive industry.
- Growing consumer demand for durable goods.
In terms of segments:
- Type: Inorganic fillers currently dominate the market due to their cost-effectiveness and wide availability. However, the organic filler segment is expected to witness faster growth due to superior performance characteristics.
- End-user Industry: The building and construction sector is the largest end-user, followed by the automotive industry. Growth in these sectors directly correlates with the demand for polymer reinforcing fillers. The packaging industry is also a significant contributor, showing steady growth driven by the need for lighter and more durable packaging solutions.
Polymer Reinforcing Filler Market Product Innovations
Recent product innovations focus on developing high-performance fillers with enhanced properties, including improved strength, lightweight, and sustainability. Nanotechnology plays a crucial role in achieving these advancements. These innovations are designed to meet the growing demand for advanced materials in high-growth sectors like electric vehicles and renewable energy infrastructure. The competitive advantage lies in developing fillers with superior performance, cost-effectiveness, and environmental friendliness.
Report Scope & Segmentation Analysis
This report provides a detailed segmentation analysis of the Polymer Reinforcing Filler market across various parameters:
Type: Organic Fillers and Inorganic Fillers, each with its own growth projections and market size. Inorganic fillers currently hold a larger market share but organic fillers are showing higher growth potential due to improved properties.
End-user Industry: Building and Construction, Automotive, Consumer Goods, Packaging, and Others. Each segment is analyzed based on market size, growth rate, and competitive dynamics. The building and construction segment is the largest, while the automotive industry exhibits higher growth potential.
Key Drivers of Polymer Reinforcing Filler Market Growth
The Polymer Reinforcing Filler market's growth is primarily driven by several factors: rising demand for lightweight materials in the automotive and aerospace industries, increasing construction activity globally, and growing emphasis on sustainability. The development of innovative filler materials with enhanced properties further propels market expansion. Favorable government policies supporting infrastructure development and green building initiatives also contribute significantly.
Challenges in the Polymer Reinforcing Filler Market Sector
Challenges include fluctuating raw material prices, stringent environmental regulations, and intense competition among manufacturers. Supply chain disruptions can significantly impact production and availability. The need for continuous innovation to meet evolving customer demands and the need for robust quality control to ensure consistent product performance are also key challenges.
Emerging Opportunities in Polymer Reinforcing Filler Market
Emerging opportunities lie in the development of bio-based fillers, advanced nanomaterials, and tailored fillers for specific applications. The expanding renewable energy sector presents a significant market opportunity, demanding high-performance and sustainable materials. Growing demand for lightweight and durable materials in various sectors also creates promising opportunities for growth.
Leading Players in the Polymer Reinforcing Filler Market Market
- SGL Carbon
- Hoffmann Mineral
- Quarzwerke Group
- Otsuka Chemical Co Ltd
- Amco Polymers
- Imerys Group
- Deep Polymer
- Orkila
- RTP Company
- Zeus Industrial Products Inc
- Polymer Products (Phil) Inc
- Omya AG
- LKAB Minerals
- Minerals Technologies Inc
- GLC Minerals
Key Developments in Polymer Reinforcing Filler Market Industry
- 2022-Q4: Imerys Group announced a significant investment in expanding its production capacity for calcium carbonate fillers.
- 2023-Q1: SGL Carbon launched a new line of high-performance carbon fiber reinforced polymers targeting the automotive industry.
- 2023-Q3: A strategic partnership between Omya AG and a major polymer manufacturer resulted in the development of a novel bio-based filler. (Further developments need to be added as they occur)
Future Outlook for Polymer Reinforcing Filler Market Market
The Polymer Reinforcing Filler market is poised for continued growth, driven by technological advancements, increasing demand from various end-user industries, and a focus on sustainable solutions. Strategic partnerships, investments in research and development, and expansion into new geographical markets will be crucial for players to capitalize on the market's vast potential. The shift towards lighter, stronger, and eco-friendly materials will define the future of this dynamic market.
Polymer Reinforcing Filler Market Segmentation
-
1. Type
-
1.1. Organic Fillers
- 1.1.1. Carbon Fibers
- 1.1.2. Cellulose Fibers
- 1.1.3. Wood Fibers
- 1.1.4. Others
-
1.2. Inorganic Fillers
- 1.2.1. Glass Fibers
- 1.2.2. Calcium Carbonate,
- 1.2.3. Precipitated Silica
-
1.1. Organic Fillers
-
2. End-user Industry
- 2.1. Building and Construction
- 2.2. Automotive
- 2.3. Consumer Goods
- 2.4. Packaging
- 2.5. Others
Polymer Reinforcing Filler Market Segmentation By Geography
-
1. Asia Pacific
- 1.1. China
- 1.2. India
- 1.3. Japan
- 1.4. South Korea
- 1.5. Rest of Asia Pacific
-
2. North America
- 2.1. United States
- 2.2. Canada
- 2.3. Mexico
-
3. Europe
- 3.1. Germany
- 3.2. United Kingdom
- 3.3. France
- 3.4. Italy
- 3.5. Rest of Europe
-
4. South America
- 4.1. Brazil
- 4.2. Argentina
- 4.3. Rest of South America
-
5. Middle East and Africa
- 5.1. Saudi Arabia
- 5.2. South Africa
- 5.3. Rest of Middle East and Africa
Polymer Reinforcing Filler Market REPORT HIGHLIGHTS
| Aspects | Details |
|---|---|
| Study Period | 2019-2033 |
| Base Year | 2024 |
| Estimated Year | 2025 |
| Forecast Period | 2025-2033 |
| Historical Period | 2019-2024 |
| Growth Rate | CAGR of 4.6% from 2019-2033 |
| Segmentation |
|
Table of Contents
- 1. Introduction
- 1.1. Research Scope
- 1.2. Market Segmentation
- 1.3. Research Methodology
- 1.4. Definitions and Assumptions
- 2. Executive Summary
- 2.1. Introduction
- 3. Market Dynamics
- 3.1. Introduction
- 3.2. Market Drivers
- 3.2.1. ; Growing Demand from Building and Construction Industry; Other Drivers
- 3.3. Market Restrains
- 3.3.1. ; Unfavorable Conditions Arising Due to COVID-19 Outbreak; Other Restraints
- 3.4. Market Trends
- 3.4.1. Building and Construction Segment to Dominate the Market
- 4. Market Factor Analysis
- 4.1. Porters Five Forces
- 4.2. Supply/Value Chain
- 4.3. PESTEL analysis
- 4.4. Market Entropy
- 4.5. Patent/Trademark Analysis
- 5. Global Polymer Reinforcing Filler Market Analysis, Insights and Forecast, 2019-2031
- 5.1. Market Analysis, Insights and Forecast - by Type
- 5.1.1. Organic Fillers
- 5.1.1.1. Carbon Fibers
- 5.1.1.2. Cellulose Fibers
- 5.1.1.3. Wood Fibers
- 5.1.1.4. Others
- 5.1.2. Inorganic Fillers
- 5.1.2.1. Glass Fibers
- 5.1.2.2. Calcium Carbonate,
- 5.1.2.3. Precipitated Silica
- 5.1.1. Organic Fillers
- 5.2. Market Analysis, Insights and Forecast - by End-user Industry
- 5.2.1. Building and Construction
- 5.2.2. Automotive
- 5.2.3. Consumer Goods
- 5.2.4. Packaging
- 5.2.5. Others
- 5.3. Market Analysis, Insights and Forecast - by Region
- 5.3.1. Asia Pacific
- 5.3.2. North America
- 5.3.3. Europe
- 5.3.4. South America
- 5.3.5. Middle East and Africa
- 5.1. Market Analysis, Insights and Forecast - by Type
- 6. Asia Pacific Polymer Reinforcing Filler Market Analysis, Insights and Forecast, 2019-2031
- 6.1. Market Analysis, Insights and Forecast - by Type
- 6.1.1. Organic Fillers
- 6.1.1.1. Carbon Fibers
- 6.1.1.2. Cellulose Fibers
- 6.1.1.3. Wood Fibers
- 6.1.1.4. Others
- 6.1.2. Inorganic Fillers
- 6.1.2.1. Glass Fibers
- 6.1.2.2. Calcium Carbonate,
- 6.1.2.3. Precipitated Silica
- 6.1.1. Organic Fillers
- 6.2. Market Analysis, Insights and Forecast - by End-user Industry
- 6.2.1. Building and Construction
- 6.2.2. Automotive
- 6.2.3. Consumer Goods
- 6.2.4. Packaging
- 6.2.5. Others
- 6.1. Market Analysis, Insights and Forecast - by Type
- 7. North America Polymer Reinforcing Filler Market Analysis, Insights and Forecast, 2019-2031
- 7.1. Market Analysis, Insights and Forecast - by Type
- 7.1.1. Organic Fillers
- 7.1.1.1. Carbon Fibers
- 7.1.1.2. Cellulose Fibers
- 7.1.1.3. Wood Fibers
- 7.1.1.4. Others
- 7.1.2. Inorganic Fillers
- 7.1.2.1. Glass Fibers
- 7.1.2.2. Calcium Carbonate,
- 7.1.2.3. Precipitated Silica
- 7.1.1. Organic Fillers
- 7.2. Market Analysis, Insights and Forecast - by End-user Industry
- 7.2.1. Building and Construction
- 7.2.2. Automotive
- 7.2.3. Consumer Goods
- 7.2.4. Packaging
- 7.2.5. Others
- 7.1. Market Analysis, Insights and Forecast - by Type
- 8. Europe Polymer Reinforcing Filler Market Analysis, Insights and Forecast, 2019-2031
- 8.1. Market Analysis, Insights and Forecast - by Type
- 8.1.1. Organic Fillers
- 8.1.1.1. Carbon Fibers
- 8.1.1.2. Cellulose Fibers
- 8.1.1.3. Wood Fibers
- 8.1.1.4. Others
- 8.1.2. Inorganic Fillers
- 8.1.2.1. Glass Fibers
- 8.1.2.2. Calcium Carbonate,
- 8.1.2.3. Precipitated Silica
- 8.1.1. Organic Fillers
- 8.2. Market Analysis, Insights and Forecast - by End-user Industry
- 8.2.1. Building and Construction
- 8.2.2. Automotive
- 8.2.3. Consumer Goods
- 8.2.4. Packaging
- 8.2.5. Others
- 8.1. Market Analysis, Insights and Forecast - by Type
- 9. South America Polymer Reinforcing Filler Market Analysis, Insights and Forecast, 2019-2031
- 9.1. Market Analysis, Insights and Forecast - by Type
- 9.1.1. Organic Fillers
- 9.1.1.1. Carbon Fibers
- 9.1.1.2. Cellulose Fibers
- 9.1.1.3. Wood Fibers
- 9.1.1.4. Others
- 9.1.2. Inorganic Fillers
- 9.1.2.1. Glass Fibers
- 9.1.2.2. Calcium Carbonate,
- 9.1.2.3. Precipitated Silica
- 9.1.1. Organic Fillers
- 9.2. Market Analysis, Insights and Forecast - by End-user Industry
- 9.2.1. Building and Construction
- 9.2.2. Automotive
- 9.2.3. Consumer Goods
- 9.2.4. Packaging
- 9.2.5. Others
- 9.1. Market Analysis, Insights and Forecast - by Type
- 10. Middle East and Africa Polymer Reinforcing Filler Market Analysis, Insights and Forecast, 2019-2031
- 10.1. Market Analysis, Insights and Forecast - by Type
- 10.1.1. Organic Fillers
- 10.1.1.1. Carbon Fibers
- 10.1.1.2. Cellulose Fibers
- 10.1.1.3. Wood Fibers
- 10.1.1.4. Others
- 10.1.2. Inorganic Fillers
- 10.1.2.1. Glass Fibers
- 10.1.2.2. Calcium Carbonate,
- 10.1.2.3. Precipitated Silica
- 10.1.1. Organic Fillers
- 10.2. Market Analysis, Insights and Forecast - by End-user Industry
- 10.2.1. Building and Construction
- 10.2.2. Automotive
- 10.2.3. Consumer Goods
- 10.2.4. Packaging
- 10.2.5. Others
- 10.1. Market Analysis, Insights and Forecast - by Type
- 11. North America Polymer Reinforcing Filler Market Analysis, Insights and Forecast, 2019-2031
- 11.1. Market Analysis, Insights and Forecast - By Country/Sub-region
- 11.1.1 United States
- 11.1.2 Canada
- 11.1.3 Mexico
- 12. Europe Polymer Reinforcing Filler Market Analysis, Insights and Forecast, 2019-2031
- 12.1. Market Analysis, Insights and Forecast - By Country/Sub-region
- 12.1.1 Germany
- 12.1.2 France
- 12.1.3 Italy
- 12.1.4 United Kingdom
- 12.1.5 Netherlands
- 12.1.6 Rest of Europe
- 13. Asia Pacific Polymer Reinforcing Filler Market Analysis, Insights and Forecast, 2019-2031
- 13.1. Market Analysis, Insights and Forecast - By Country/Sub-region
- 13.1.1 China
- 13.1.2 Japan
- 13.1.3 India
- 13.1.4 South Korea
- 13.1.5 Taiwan
- 13.1.6 Australia
- 13.1.7 Rest of Asia-Pacific
- 14. South America Polymer Reinforcing Filler Market Analysis, Insights and Forecast, 2019-2031
- 14.1. Market Analysis, Insights and Forecast - By Country/Sub-region
- 14.1.1 Brazil
- 14.1.2 Argentina
- 14.1.3 Rest of South America
- 15. MEA Polymer Reinforcing Filler Market Analysis, Insights and Forecast, 2019-2031
- 15.1. Market Analysis, Insights and Forecast - By Country/Sub-region
- 15.1.1 Middle East
- 15.1.2 Africa
- 16. Competitive Analysis
- 16.1. Global Market Share Analysis 2024
- 16.2. Company Profiles
- 16.2.1 SGL Carbon
- 16.2.1.1. Overview
- 16.2.1.2. Products
- 16.2.1.3. SWOT Analysis
- 16.2.1.4. Recent Developments
- 16.2.1.5. Financials (Based on Availability)
- 16.2.2 Hoffmann Mineral
- 16.2.2.1. Overview
- 16.2.2.2. Products
- 16.2.2.3. SWOT Analysis
- 16.2.2.4. Recent Developments
- 16.2.2.5. Financials (Based on Availability)
- 16.2.3 Quarzwerke Group
- 16.2.3.1. Overview
- 16.2.3.2. Products
- 16.2.3.3. SWOT Analysis
- 16.2.3.4. Recent Developments
- 16.2.3.5. Financials (Based on Availability)
- 16.2.4 Otsuka Chemical Co Ltd
- 16.2.4.1. Overview
- 16.2.4.2. Products
- 16.2.4.3. SWOT Analysis
- 16.2.4.4. Recent Developments
- 16.2.4.5. Financials (Based on Availability)
- 16.2.5 Amco Polymers
- 16.2.5.1. Overview
- 16.2.5.2. Products
- 16.2.5.3. SWOT Analysis
- 16.2.5.4. Recent Developments
- 16.2.5.5. Financials (Based on Availability)
- 16.2.6 Imerys Group
- 16.2.6.1. Overview
- 16.2.6.2. Products
- 16.2.6.3. SWOT Analysis
- 16.2.6.4. Recent Developments
- 16.2.6.5. Financials (Based on Availability)
- 16.2.7 Deep Polymer
- 16.2.7.1. Overview
- 16.2.7.2. Products
- 16.2.7.3. SWOT Analysis
- 16.2.7.4. Recent Developments
- 16.2.7.5. Financials (Based on Availability)
- 16.2.8 Orkila
- 16.2.8.1. Overview
- 16.2.8.2. Products
- 16.2.8.3. SWOT Analysis
- 16.2.8.4. Recent Developments
- 16.2.8.5. Financials (Based on Availability)
- 16.2.9 RTP Company
- 16.2.9.1. Overview
- 16.2.9.2. Products
- 16.2.9.3. SWOT Analysis
- 16.2.9.4. Recent Developments
- 16.2.9.5. Financials (Based on Availability)
- 16.2.10 Zeus Industrial Products Inc
- 16.2.10.1. Overview
- 16.2.10.2. Products
- 16.2.10.3. SWOT Analysis
- 16.2.10.4. Recent Developments
- 16.2.10.5. Financials (Based on Availability)
- 16.2.11 Polymer Products (Phil) Inc
- 16.2.11.1. Overview
- 16.2.11.2. Products
- 16.2.11.3. SWOT Analysis
- 16.2.11.4. Recent Developments
- 16.2.11.5. Financials (Based on Availability)
- 16.2.12 Omya AG
- 16.2.12.1. Overview
- 16.2.12.2. Products
- 16.2.12.3. SWOT Analysis
- 16.2.12.4. Recent Developments
- 16.2.12.5. Financials (Based on Availability)
- 16.2.13 LKAB Minerals
- 16.2.13.1. Overview
- 16.2.13.2. Products
- 16.2.13.3. SWOT Analysis
- 16.2.13.4. Recent Developments
- 16.2.13.5. Financials (Based on Availability)
- 16.2.14 Minerals Technologies Inc
- 16.2.14.1. Overview
- 16.2.14.2. Products
- 16.2.14.3. SWOT Analysis
- 16.2.14.4. Recent Developments
- 16.2.14.5. Financials (Based on Availability)
- 16.2.15 GLC Minerals
- 16.2.15.1. Overview
- 16.2.15.2. Products
- 16.2.15.3. SWOT Analysis
- 16.2.15.4. Recent Developments
- 16.2.15.5. Financials (Based on Availability)
- 16.2.1 SGL Carbon
List of Figures
- Figure 1: Global Polymer Reinforcing Filler Market Revenue Breakdown (Billion, %) by Region 2024 & 2032
- Figure 2: Global Polymer Reinforcing Filler Market Volume Breakdown (K Tons, %) by Region 2024 & 2032
- Figure 3: North America Polymer Reinforcing Filler Market Revenue (Billion), by Country 2024 & 2032
- Figure 4: North America Polymer Reinforcing Filler Market Volume (K Tons), by Country 2024 & 2032
- Figure 5: North America Polymer Reinforcing Filler Market Revenue Share (%), by Country 2024 & 2032
- Figure 6: North America Polymer Reinforcing Filler Market Volume Share (%), by Country 2024 & 2032
- Figure 7: Europe Polymer Reinforcing Filler Market Revenue (Billion), by Country 2024 & 2032
- Figure 8: Europe Polymer Reinforcing Filler Market Volume (K Tons), by Country 2024 & 2032
- Figure 9: Europe Polymer Reinforcing Filler Market Revenue Share (%), by Country 2024 & 2032
- Figure 10: Europe Polymer Reinforcing Filler Market Volume Share (%), by Country 2024 & 2032
- Figure 11: Asia Pacific Polymer Reinforcing Filler Market Revenue (Billion), by Country 2024 & 2032
- Figure 12: Asia Pacific Polymer Reinforcing Filler Market Volume (K Tons), by Country 2024 & 2032
- Figure 13: Asia Pacific Polymer Reinforcing Filler Market Revenue Share (%), by Country 2024 & 2032
- Figure 14: Asia Pacific Polymer Reinforcing Filler Market Volume Share (%), by Country 2024 & 2032
- Figure 15: South America Polymer Reinforcing Filler Market Revenue (Billion), by Country 2024 & 2032
- Figure 16: South America Polymer Reinforcing Filler Market Volume (K Tons), by Country 2024 & 2032
- Figure 17: South America Polymer Reinforcing Filler Market Revenue Share (%), by Country 2024 & 2032
- Figure 18: South America Polymer Reinforcing Filler Market Volume Share (%), by Country 2024 & 2032
- Figure 19: MEA Polymer Reinforcing Filler Market Revenue (Billion), by Country 2024 & 2032
- Figure 20: MEA Polymer Reinforcing Filler Market Volume (K Tons), by Country 2024 & 2032
- Figure 21: MEA Polymer Reinforcing Filler Market Revenue Share (%), by Country 2024 & 2032
- Figure 22: MEA Polymer Reinforcing Filler Market Volume Share (%), by Country 2024 & 2032
- Figure 23: Asia Pacific Polymer Reinforcing Filler Market Revenue (Billion), by Type 2024 & 2032
- Figure 24: Asia Pacific Polymer Reinforcing Filler Market Volume (K Tons), by Type 2024 & 2032
- Figure 25: Asia Pacific Polymer Reinforcing Filler Market Revenue Share (%), by Type 2024 & 2032
- Figure 26: Asia Pacific Polymer Reinforcing Filler Market Volume Share (%), by Type 2024 & 2032
- Figure 27: Asia Pacific Polymer Reinforcing Filler Market Revenue (Billion), by End-user Industry 2024 & 2032
- Figure 28: Asia Pacific Polymer Reinforcing Filler Market Volume (K Tons), by End-user Industry 2024 & 2032
- Figure 29: Asia Pacific Polymer Reinforcing Filler Market Revenue Share (%), by End-user Industry 2024 & 2032
- Figure 30: Asia Pacific Polymer Reinforcing Filler Market Volume Share (%), by End-user Industry 2024 & 2032
- Figure 31: Asia Pacific Polymer Reinforcing Filler Market Revenue (Billion), by Country 2024 & 2032
- Figure 32: Asia Pacific Polymer Reinforcing Filler Market Volume (K Tons), by Country 2024 & 2032
- Figure 33: Asia Pacific Polymer Reinforcing Filler Market Revenue Share (%), by Country 2024 & 2032
- Figure 34: Asia Pacific Polymer Reinforcing Filler Market Volume Share (%), by Country 2024 & 2032
- Figure 35: North America Polymer Reinforcing Filler Market Revenue (Billion), by Type 2024 & 2032
- Figure 36: North America Polymer Reinforcing Filler Market Volume (K Tons), by Type 2024 & 2032
- Figure 37: North America Polymer Reinforcing Filler Market Revenue Share (%), by Type 2024 & 2032
- Figure 38: North America Polymer Reinforcing Filler Market Volume Share (%), by Type 2024 & 2032
- Figure 39: North America Polymer Reinforcing Filler Market Revenue (Billion), by End-user Industry 2024 & 2032
- Figure 40: North America Polymer Reinforcing Filler Market Volume (K Tons), by End-user Industry 2024 & 2032
- Figure 41: North America Polymer Reinforcing Filler Market Revenue Share (%), by End-user Industry 2024 & 2032
- Figure 42: North America Polymer Reinforcing Filler Market Volume Share (%), by End-user Industry 2024 & 2032
- Figure 43: North America Polymer Reinforcing Filler Market Revenue (Billion), by Country 2024 & 2032
- Figure 44: North America Polymer Reinforcing Filler Market Volume (K Tons), by Country 2024 & 2032
- Figure 45: North America Polymer Reinforcing Filler Market Revenue Share (%), by Country 2024 & 2032
- Figure 46: North America Polymer Reinforcing Filler Market Volume Share (%), by Country 2024 & 2032
- Figure 47: Europe Polymer Reinforcing Filler Market Revenue (Billion), by Type 2024 & 2032
- Figure 48: Europe Polymer Reinforcing Filler Market Volume (K Tons), by Type 2024 & 2032
- Figure 49: Europe Polymer Reinforcing Filler Market Revenue Share (%), by Type 2024 & 2032
- Figure 50: Europe Polymer Reinforcing Filler Market Volume Share (%), by Type 2024 & 2032
- Figure 51: Europe Polymer Reinforcing Filler Market Revenue (Billion), by End-user Industry 2024 & 2032
- Figure 52: Europe Polymer Reinforcing Filler Market Volume (K Tons), by End-user Industry 2024 & 2032
- Figure 53: Europe Polymer Reinforcing Filler Market Revenue Share (%), by End-user Industry 2024 & 2032
- Figure 54: Europe Polymer Reinforcing Filler Market Volume Share (%), by End-user Industry 2024 & 2032
- Figure 55: Europe Polymer Reinforcing Filler Market Revenue (Billion), by Country 2024 & 2032
- Figure 56: Europe Polymer Reinforcing Filler Market Volume (K Tons), by Country 2024 & 2032
- Figure 57: Europe Polymer Reinforcing Filler Market Revenue Share (%), by Country 2024 & 2032
- Figure 58: Europe Polymer Reinforcing Filler Market Volume Share (%), by Country 2024 & 2032
- Figure 59: South America Polymer Reinforcing Filler Market Revenue (Billion), by Type 2024 & 2032
- Figure 60: South America Polymer Reinforcing Filler Market Volume (K Tons), by Type 2024 & 2032
- Figure 61: South America Polymer Reinforcing Filler Market Revenue Share (%), by Type 2024 & 2032
- Figure 62: South America Polymer Reinforcing Filler Market Volume Share (%), by Type 2024 & 2032
- Figure 63: South America Polymer Reinforcing Filler Market Revenue (Billion), by End-user Industry 2024 & 2032
- Figure 64: South America Polymer Reinforcing Filler Market Volume (K Tons), by End-user Industry 2024 & 2032
- Figure 65: South America Polymer Reinforcing Filler Market Revenue Share (%), by End-user Industry 2024 & 2032
- Figure 66: South America Polymer Reinforcing Filler Market Volume Share (%), by End-user Industry 2024 & 2032
- Figure 67: South America Polymer Reinforcing Filler Market Revenue (Billion), by Country 2024 & 2032
- Figure 68: South America Polymer Reinforcing Filler Market Volume (K Tons), by Country 2024 & 2032
- Figure 69: South America Polymer Reinforcing Filler Market Revenue Share (%), by Country 2024 & 2032
- Figure 70: South America Polymer Reinforcing Filler Market Volume Share (%), by Country 2024 & 2032
- Figure 71: Middle East and Africa Polymer Reinforcing Filler Market Revenue (Billion), by Type 2024 & 2032
- Figure 72: Middle East and Africa Polymer Reinforcing Filler Market Volume (K Tons), by Type 2024 & 2032
- Figure 73: Middle East and Africa Polymer Reinforcing Filler Market Revenue Share (%), by Type 2024 & 2032
- Figure 74: Middle East and Africa Polymer Reinforcing Filler Market Volume Share (%), by Type 2024 & 2032
- Figure 75: Middle East and Africa Polymer Reinforcing Filler Market Revenue (Billion), by End-user Industry 2024 & 2032
- Figure 76: Middle East and Africa Polymer Reinforcing Filler Market Volume (K Tons), by End-user Industry 2024 & 2032
- Figure 77: Middle East and Africa Polymer Reinforcing Filler Market Revenue Share (%), by End-user Industry 2024 & 2032
- Figure 78: Middle East and Africa Polymer Reinforcing Filler Market Volume Share (%), by End-user Industry 2024 & 2032
- Figure 79: Middle East and Africa Polymer Reinforcing Filler Market Revenue (Billion), by Country 2024 & 2032
- Figure 80: Middle East and Africa Polymer Reinforcing Filler Market Volume (K Tons), by Country 2024 & 2032
- Figure 81: Middle East and Africa Polymer Reinforcing Filler Market Revenue Share (%), by Country 2024 & 2032
- Figure 82: Middle East and Africa Polymer Reinforcing Filler Market Volume Share (%), by Country 2024 & 2032
List of Tables
- Table 1: Global Polymer Reinforcing Filler Market Revenue Billion Forecast, by Region 2019 & 2032
- Table 2: Global Polymer Reinforcing Filler Market Volume K Tons Forecast, by Region 2019 & 2032
- Table 3: Global Polymer Reinforcing Filler Market Revenue Billion Forecast, by Type 2019 & 2032
- Table 4: Global Polymer Reinforcing Filler Market Volume K Tons Forecast, by Type 2019 & 2032
- Table 5: Global Polymer Reinforcing Filler Market Revenue Billion Forecast, by End-user Industry 2019 & 2032
- Table 6: Global Polymer Reinforcing Filler Market Volume K Tons Forecast, by End-user Industry 2019 & 2032
- Table 7: Global Polymer Reinforcing Filler Market Revenue Billion Forecast, by Region 2019 & 2032
- Table 8: Global Polymer Reinforcing Filler Market Volume K Tons Forecast, by Region 2019 & 2032
- Table 9: Global Polymer Reinforcing Filler Market Revenue Billion Forecast, by Country 2019 & 2032
- Table 10: Global Polymer Reinforcing Filler Market Volume K Tons Forecast, by Country 2019 & 2032
- Table 11: United States Polymer Reinforcing Filler Market Revenue (Billion) Forecast, by Application 2019 & 2032
- Table 12: United States Polymer Reinforcing Filler Market Volume (K Tons) Forecast, by Application 2019 & 2032
- Table 13: Canada Polymer Reinforcing Filler Market Revenue (Billion) Forecast, by Application 2019 & 2032
- Table 14: Canada Polymer Reinforcing Filler Market Volume (K Tons) Forecast, by Application 2019 & 2032
- Table 15: Mexico Polymer Reinforcing Filler Market Revenue (Billion) Forecast, by Application 2019 & 2032
- Table 16: Mexico Polymer Reinforcing Filler Market Volume (K Tons) Forecast, by Application 2019 & 2032
- Table 17: Global Polymer Reinforcing Filler Market Revenue Billion Forecast, by Country 2019 & 2032
- Table 18: Global Polymer Reinforcing Filler Market Volume K Tons Forecast, by Country 2019 & 2032
- Table 19: Germany Polymer Reinforcing Filler Market Revenue (Billion) Forecast, by Application 2019 & 2032
- Table 20: Germany Polymer Reinforcing Filler Market Volume (K Tons) Forecast, by Application 2019 & 2032
- Table 21: France Polymer Reinforcing Filler Market Revenue (Billion) Forecast, by Application 2019 & 2032
- Table 22: France Polymer Reinforcing Filler Market Volume (K Tons) Forecast, by Application 2019 & 2032
- Table 23: Italy Polymer Reinforcing Filler Market Revenue (Billion) Forecast, by Application 2019 & 2032
- Table 24: Italy Polymer Reinforcing Filler Market Volume (K Tons) Forecast, by Application 2019 & 2032
- Table 25: United Kingdom Polymer Reinforcing Filler Market Revenue (Billion) Forecast, by Application 2019 & 2032
- Table 26: United Kingdom Polymer Reinforcing Filler Market Volume (K Tons) Forecast, by Application 2019 & 2032
- Table 27: Netherlands Polymer Reinforcing Filler Market Revenue (Billion) Forecast, by Application 2019 & 2032
- Table 28: Netherlands Polymer Reinforcing Filler Market Volume (K Tons) Forecast, by Application 2019 & 2032
- Table 29: Rest of Europe Polymer Reinforcing Filler Market Revenue (Billion) Forecast, by Application 2019 & 2032
- Table 30: Rest of Europe Polymer Reinforcing Filler Market Volume (K Tons) Forecast, by Application 2019 & 2032
- Table 31: Global Polymer Reinforcing Filler Market Revenue Billion Forecast, by Country 2019 & 2032
- Table 32: Global Polymer Reinforcing Filler Market Volume K Tons Forecast, by Country 2019 & 2032
- Table 33: China Polymer Reinforcing Filler Market Revenue (Billion) Forecast, by Application 2019 & 2032
- Table 34: China Polymer Reinforcing Filler Market Volume (K Tons) Forecast, by Application 2019 & 2032
- Table 35: Japan Polymer Reinforcing Filler Market Revenue (Billion) Forecast, by Application 2019 & 2032
- Table 36: Japan Polymer Reinforcing Filler Market Volume (K Tons) Forecast, by Application 2019 & 2032
- Table 37: India Polymer Reinforcing Filler Market Revenue (Billion) Forecast, by Application 2019 & 2032
- Table 38: India Polymer Reinforcing Filler Market Volume (K Tons) Forecast, by Application 2019 & 2032
- Table 39: South Korea Polymer Reinforcing Filler Market Revenue (Billion) Forecast, by Application 2019 & 2032
- Table 40: South Korea Polymer Reinforcing Filler Market Volume (K Tons) Forecast, by Application 2019 & 2032
- Table 41: Taiwan Polymer Reinforcing Filler Market Revenue (Billion) Forecast, by Application 2019 & 2032
- Table 42: Taiwan Polymer Reinforcing Filler Market Volume (K Tons) Forecast, by Application 2019 & 2032
- Table 43: Australia Polymer Reinforcing Filler Market Revenue (Billion) Forecast, by Application 2019 & 2032
- Table 44: Australia Polymer Reinforcing Filler Market Volume (K Tons) Forecast, by Application 2019 & 2032
- Table 45: Rest of Asia-Pacific Polymer Reinforcing Filler Market Revenue (Billion) Forecast, by Application 2019 & 2032
- Table 46: Rest of Asia-Pacific Polymer Reinforcing Filler Market Volume (K Tons) Forecast, by Application 2019 & 2032
- Table 47: Global Polymer Reinforcing Filler Market Revenue Billion Forecast, by Country 2019 & 2032
- Table 48: Global Polymer Reinforcing Filler Market Volume K Tons Forecast, by Country 2019 & 2032
- Table 49: Brazil Polymer Reinforcing Filler Market Revenue (Billion) Forecast, by Application 2019 & 2032
- Table 50: Brazil Polymer Reinforcing Filler Market Volume (K Tons) Forecast, by Application 2019 & 2032
- Table 51: Argentina Polymer Reinforcing Filler Market Revenue (Billion) Forecast, by Application 2019 & 2032
- Table 52: Argentina Polymer Reinforcing Filler Market Volume (K Tons) Forecast, by Application 2019 & 2032
- Table 53: Rest of South America Polymer Reinforcing Filler Market Revenue (Billion) Forecast, by Application 2019 & 2032
- Table 54: Rest of South America Polymer Reinforcing Filler Market Volume (K Tons) Forecast, by Application 2019 & 2032
- Table 55: Global Polymer Reinforcing Filler Market Revenue Billion Forecast, by Country 2019 & 2032
- Table 56: Global Polymer Reinforcing Filler Market Volume K Tons Forecast, by Country 2019 & 2032
- Table 57: Middle East Polymer Reinforcing Filler Market Revenue (Billion) Forecast, by Application 2019 & 2032
- Table 58: Middle East Polymer Reinforcing Filler Market Volume (K Tons) Forecast, by Application 2019 & 2032
- Table 59: Africa Polymer Reinforcing Filler Market Revenue (Billion) Forecast, by Application 2019 & 2032
- Table 60: Africa Polymer Reinforcing Filler Market Volume (K Tons) Forecast, by Application 2019 & 2032
- Table 61: Global Polymer Reinforcing Filler Market Revenue Billion Forecast, by Type 2019 & 2032
- Table 62: Global Polymer Reinforcing Filler Market Volume K Tons Forecast, by Type 2019 & 2032
- Table 63: Global Polymer Reinforcing Filler Market Revenue Billion Forecast, by End-user Industry 2019 & 2032
- Table 64: Global Polymer Reinforcing Filler Market Volume K Tons Forecast, by End-user Industry 2019 & 2032
- Table 65: Global Polymer Reinforcing Filler Market Revenue Billion Forecast, by Country 2019 & 2032
- Table 66: Global Polymer Reinforcing Filler Market Volume K Tons Forecast, by Country 2019 & 2032
- Table 67: China Polymer Reinforcing Filler Market Revenue (Billion) Forecast, by Application 2019 & 2032
- Table 68: China Polymer Reinforcing Filler Market Volume (K Tons) Forecast, by Application 2019 & 2032
- Table 69: India Polymer Reinforcing Filler Market Revenue (Billion) Forecast, by Application 2019 & 2032
- Table 70: India Polymer Reinforcing Filler Market Volume (K Tons) Forecast, by Application 2019 & 2032
- Table 71: Japan Polymer Reinforcing Filler Market Revenue (Billion) Forecast, by Application 2019 & 2032
- Table 72: Japan Polymer Reinforcing Filler Market Volume (K Tons) Forecast, by Application 2019 & 2032
- Table 73: South Korea Polymer Reinforcing Filler Market Revenue (Billion) Forecast, by Application 2019 & 2032
- Table 74: South Korea Polymer Reinforcing Filler Market Volume (K Tons) Forecast, by Application 2019 & 2032
- Table 75: Rest of Asia Pacific Polymer Reinforcing Filler Market Revenue (Billion) Forecast, by Application 2019 & 2032
- Table 76: Rest of Asia Pacific Polymer Reinforcing Filler Market Volume (K Tons) Forecast, by Application 2019 & 2032
- Table 77: Global Polymer Reinforcing Filler Market Revenue Billion Forecast, by Type 2019 & 2032
- Table 78: Global Polymer Reinforcing Filler Market Volume K Tons Forecast, by Type 2019 & 2032
- Table 79: Global Polymer Reinforcing Filler Market Revenue Billion Forecast, by End-user Industry 2019 & 2032
- Table 80: Global Polymer Reinforcing Filler Market Volume K Tons Forecast, by End-user Industry 2019 & 2032
- Table 81: Global Polymer Reinforcing Filler Market Revenue Billion Forecast, by Country 2019 & 2032
- Table 82: Global Polymer Reinforcing Filler Market Volume K Tons Forecast, by Country 2019 & 2032
- Table 83: United States Polymer Reinforcing Filler Market Revenue (Billion) Forecast, by Application 2019 & 2032
- Table 84: United States Polymer Reinforcing Filler Market Volume (K Tons) Forecast, by Application 2019 & 2032
- Table 85: Canada Polymer Reinforcing Filler Market Revenue (Billion) Forecast, by Application 2019 & 2032
- Table 86: Canada Polymer Reinforcing Filler Market Volume (K Tons) Forecast, by Application 2019 & 2032
- Table 87: Mexico Polymer Reinforcing Filler Market Revenue (Billion) Forecast, by Application 2019 & 2032
- Table 88: Mexico Polymer Reinforcing Filler Market Volume (K Tons) Forecast, by Application 2019 & 2032
- Table 89: Global Polymer Reinforcing Filler Market Revenue Billion Forecast, by Type 2019 & 2032
- Table 90: Global Polymer Reinforcing Filler Market Volume K Tons Forecast, by Type 2019 & 2032
- Table 91: Global Polymer Reinforcing Filler Market Revenue Billion Forecast, by End-user Industry 2019 & 2032
- Table 92: Global Polymer Reinforcing Filler Market Volume K Tons Forecast, by End-user Industry 2019 & 2032
- Table 93: Global Polymer Reinforcing Filler Market Revenue Billion Forecast, by Country 2019 & 2032
- Table 94: Global Polymer Reinforcing Filler Market Volume K Tons Forecast, by Country 2019 & 2032
- Table 95: Germany Polymer Reinforcing Filler Market Revenue (Billion) Forecast, by Application 2019 & 2032
- Table 96: Germany Polymer Reinforcing Filler Market Volume (K Tons) Forecast, by Application 2019 & 2032
- Table 97: United Kingdom Polymer Reinforcing Filler Market Revenue (Billion) Forecast, by Application 2019 & 2032
- Table 98: United Kingdom Polymer Reinforcing Filler Market Volume (K Tons) Forecast, by Application 2019 & 2032
- Table 99: France Polymer Reinforcing Filler Market Revenue (Billion) Forecast, by Application 2019 & 2032
- Table 100: France Polymer Reinforcing Filler Market Volume (K Tons) Forecast, by Application 2019 & 2032
- Table 101: Italy Polymer Reinforcing Filler Market Revenue (Billion) Forecast, by Application 2019 & 2032
- Table 102: Italy Polymer Reinforcing Filler Market Volume (K Tons) Forecast, by Application 2019 & 2032
- Table 103: Rest of Europe Polymer Reinforcing Filler Market Revenue (Billion) Forecast, by Application 2019 & 2032
- Table 104: Rest of Europe Polymer Reinforcing Filler Market Volume (K Tons) Forecast, by Application 2019 & 2032
- Table 105: Global Polymer Reinforcing Filler Market Revenue Billion Forecast, by Type 2019 & 2032
- Table 106: Global Polymer Reinforcing Filler Market Volume K Tons Forecast, by Type 2019 & 2032
- Table 107: Global Polymer Reinforcing Filler Market Revenue Billion Forecast, by End-user Industry 2019 & 2032
- Table 108: Global Polymer Reinforcing Filler Market Volume K Tons Forecast, by End-user Industry 2019 & 2032
- Table 109: Global Polymer Reinforcing Filler Market Revenue Billion Forecast, by Country 2019 & 2032
- Table 110: Global Polymer Reinforcing Filler Market Volume K Tons Forecast, by Country 2019 & 2032
- Table 111: Brazil Polymer Reinforcing Filler Market Revenue (Billion) Forecast, by Application 2019 & 2032
- Table 112: Brazil Polymer Reinforcing Filler Market Volume (K Tons) Forecast, by Application 2019 & 2032
- Table 113: Argentina Polymer Reinforcing Filler Market Revenue (Billion) Forecast, by Application 2019 & 2032
- Table 114: Argentina Polymer Reinforcing Filler Market Volume (K Tons) Forecast, by Application 2019 & 2032
- Table 115: Rest of South America Polymer Reinforcing Filler Market Revenue (Billion) Forecast, by Application 2019 & 2032
- Table 116: Rest of South America Polymer Reinforcing Filler Market Volume (K Tons) Forecast, by Application 2019 & 2032
- Table 117: Global Polymer Reinforcing Filler Market Revenue Billion Forecast, by Type 2019 & 2032
- Table 118: Global Polymer Reinforcing Filler Market Volume K Tons Forecast, by Type 2019 & 2032
- Table 119: Global Polymer Reinforcing Filler Market Revenue Billion Forecast, by End-user Industry 2019 & 2032
- Table 120: Global Polymer Reinforcing Filler Market Volume K Tons Forecast, by End-user Industry 2019 & 2032
- Table 121: Global Polymer Reinforcing Filler Market Revenue Billion Forecast, by Country 2019 & 2032
- Table 122: Global Polymer Reinforcing Filler Market Volume K Tons Forecast, by Country 2019 & 2032
- Table 123: Saudi Arabia Polymer Reinforcing Filler Market Revenue (Billion) Forecast, by Application 2019 & 2032
- Table 124: Saudi Arabia Polymer Reinforcing Filler Market Volume (K Tons) Forecast, by Application 2019 & 2032
- Table 125: South Africa Polymer Reinforcing Filler Market Revenue (Billion) Forecast, by Application 2019 & 2032
- Table 126: South Africa Polymer Reinforcing Filler Market Volume (K Tons) Forecast, by Application 2019 & 2032
- Table 127: Rest of Middle East and Africa Polymer Reinforcing Filler Market Revenue (Billion) Forecast, by Application 2019 & 2032
- Table 128: Rest of Middle East and Africa Polymer Reinforcing Filler Market Volume (K Tons) Forecast, by Application 2019 & 2032
Frequently Asked Questions
1. What is the projected Compound Annual Growth Rate (CAGR) of the Polymer Reinforcing Filler Market?
The projected CAGR is approximately 4.6%.
2. Which companies are prominent players in the Polymer Reinforcing Filler Market?
Key companies in the market include SGL Carbon, Hoffmann Mineral, Quarzwerke Group, Otsuka Chemical Co Ltd, Amco Polymers, Imerys Group, Deep Polymer, Orkila, RTP Company, Zeus Industrial Products Inc, Polymer Products (Phil) Inc, Omya AG, LKAB Minerals, Minerals Technologies Inc, GLC Minerals.
3. What are the main segments of the Polymer Reinforcing Filler Market?
The market segments include Type, End-user Industry.
4. Can you provide details about the market size?
The market size is estimated to be USD 12.45 Billion as of 2022.
5. What are some drivers contributing to market growth?
; Growing Demand from Building and Construction Industry; Other Drivers.
6. What are the notable trends driving market growth?
Building and Construction Segment to Dominate the Market.
7. Are there any restraints impacting market growth?
; Unfavorable Conditions Arising Due to COVID-19 Outbreak; Other Restraints.
8. Can you provide examples of recent developments in the market?
N/A
9. What pricing options are available for accessing the report?
Pricing options include single-user, multi-user, and enterprise licenses priced at USD 4750, USD 5250, and USD 8750 respectively.
10. Is the market size provided in terms of value or volume?
The market size is provided in terms of value, measured in Billion and volume, measured in K Tons.
11. Are there any specific market keywords associated with the report?
Yes, the market keyword associated with the report is "Polymer Reinforcing Filler Market," which aids in identifying and referencing the specific market segment covered.
12. How do I determine which pricing option suits my needs best?
The pricing options vary based on user requirements and access needs. Individual users may opt for single-user licenses, while businesses requiring broader access may choose multi-user or enterprise licenses for cost-effective access to the report.
13. Are there any additional resources or data provided in the Polymer Reinforcing Filler Market report?
While the report offers comprehensive insights, it's advisable to review the specific contents or supplementary materials provided to ascertain if additional resources or data are available.
14. How can I stay updated on further developments or reports in the Polymer Reinforcing Filler Market?
To stay informed about further developments, trends, and reports in the Polymer Reinforcing Filler Market, consider subscribing to industry newsletters, following relevant companies and organizations, or regularly checking reputable industry news sources and publications.
Methodology
Step 1 - Identification of Relevant Samples Size from Population Database


Step 2 - Approaches for Defining Global Market Size (Value, Volume* & Price*)

Note*: In applicable scenarios
Step 3 - Data Sources
Primary Research
- Web Analytics
- Survey Reports
- Research Institute
- Latest Research Reports
- Opinion Leaders
Secondary Research
- Annual Reports
- White Paper
- Latest Press Release
- Industry Association
- Paid Database
- Investor Presentations

Step 4 - Data Triangulation
Involves using different sources of information in order to increase the validity of a study
These sources are likely to be stakeholders in a program - participants, other researchers, program staff, other community members, and so on.
Then we put all data in single framework & apply various statistical tools to find out the dynamic on the market.
During the analysis stage, feedback from the stakeholder groups would be compared to determine areas of agreement as well as areas of divergence


