
Key Insights
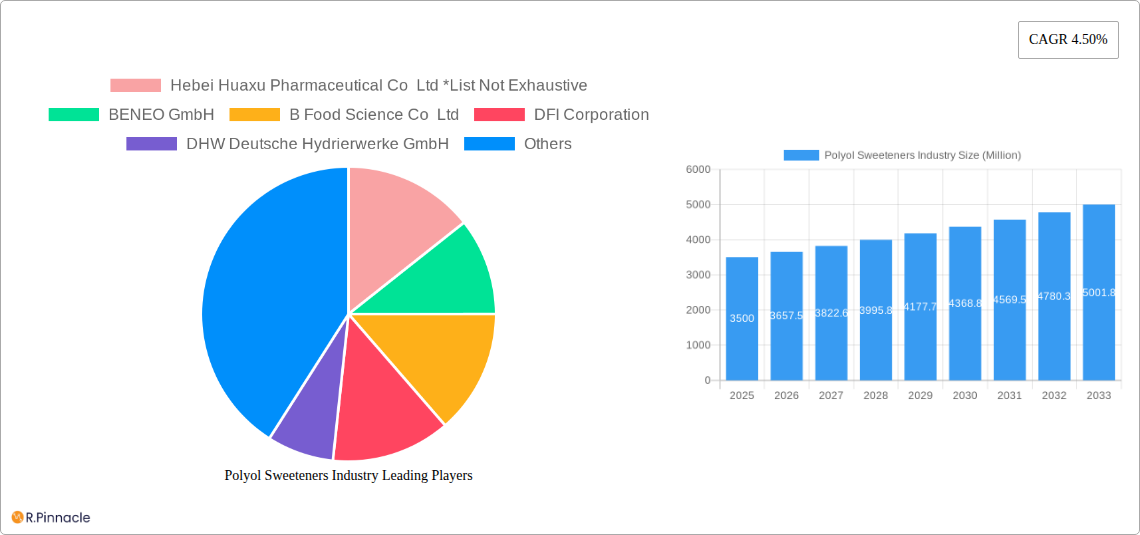
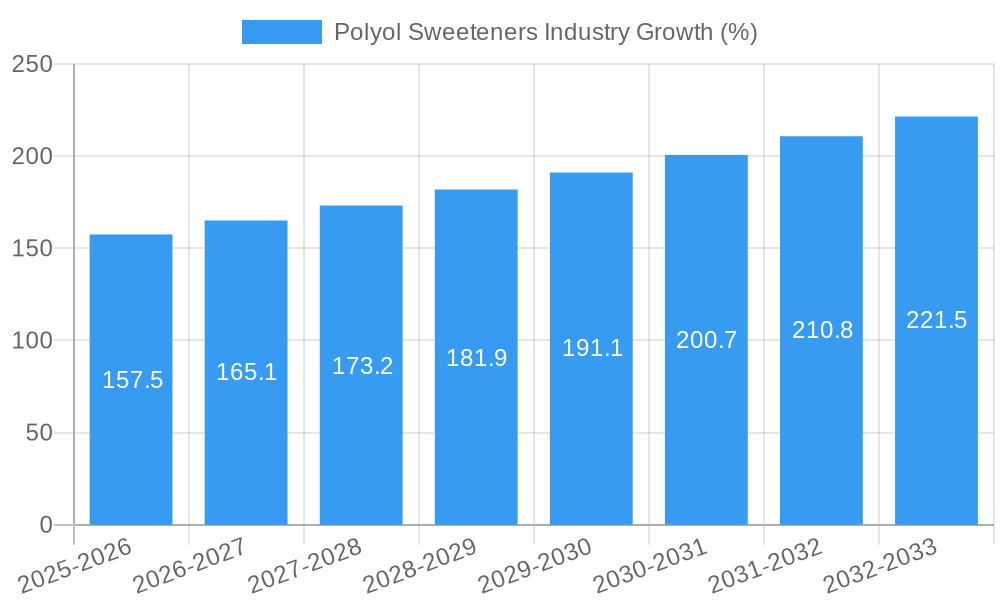
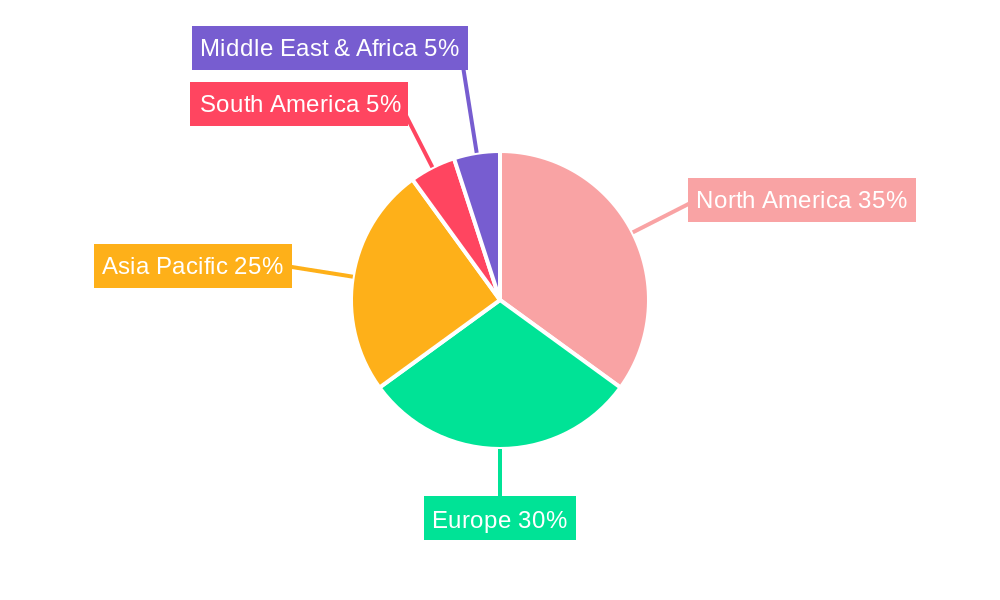
The global polyol sweeteners market, valued at $3.5 billion in 2025, is projected to experience steady growth, driven by increasing demand for healthier, low-calorie alternatives to traditional sugar. A compound annual growth rate (CAGR) of 4.5% from 2025 to 2033 indicates a substantial market expansion. Key drivers include the rising prevalence of diabetes and obesity globally, fueling consumer preference for sugar substitutes in food and beverages. Furthermore, the expanding pharmaceutical and personal care industries, which utilize polyols for their functional and textural properties, contribute significantly to market growth. The market is segmented by type, with erythritol, sorbitol, maltitol, and isomalt being major contributors. Application-wise, food and beverages dominate, followed by pharmaceuticals and personal care. North America and Europe currently hold significant market shares, but the Asia-Pacific region is expected to witness substantial growth due to increasing disposable incomes and changing dietary habits. While the industry faces constraints like potential digestive issues associated with some polyols and price fluctuations in raw materials, the overall market outlook remains positive, driven by innovation in product development and expanding application areas.
The competitive landscape is characterized by both large multinational corporations and regional players. Companies such as Cargill, Ingredion, and Roquette Frères, along with regional players like Hebei Huaxu Pharmaceutical, are key market participants, constantly striving for innovation in product offerings and expanding their global footprint. Future growth will depend on continued research and development in areas like improved taste and texture profiles, as well as the exploration of new applications in emerging markets. The industry's sustainability practices and ethical sourcing of raw materials will also play a crucial role in shaping future market dynamics. A focus on transparent labeling and educating consumers about the benefits and limitations of different polyol sweeteners will be instrumental in sustaining market growth and building consumer trust.
Polyol Sweeteners Industry Market Report: 2019-2033
This comprehensive report provides an in-depth analysis of the global polyol sweeteners industry, covering market size, growth drivers, competitive landscape, and future outlook from 2019 to 2033. The report is essential for industry professionals, investors, and researchers seeking actionable insights into this dynamic market. The study period spans 2019-2033, with 2025 as the base and estimated year. The forecast period is 2025-2033, and the historical period covers 2019-2024. Expected market values are presented in Millions.
Polyol Sweeteners Industry Market Structure & Innovation Trends
This section analyzes the competitive landscape, innovation drivers, and regulatory aspects influencing the polyol sweeteners market. Market concentration is assessed, revealing the market share held by key players such as Cargill Inc, Ingredion Incorporated, and Roquette Frères. The report explores the impact of mergers and acquisitions (M&A) activities, with analysis of deal values reaching xx Million. Innovation is examined through the lens of product development, technological advancements, and regulatory changes. The report also considers the influence of substitute products and evolving end-user demographics.
- Market Concentration: High, with top 5 players holding xx% market share (2024).
- Innovation Drivers: Growing demand for healthier sweeteners, technological advancements in production, stricter regulations on sugar.
- Regulatory Frameworks: Vary by region, impacting product approvals and labeling requirements.
- Product Substitutes: Stevia, monk fruit, and other natural sweeteners pose a competitive threat.
- M&A Activities: Several significant M&A deals have been observed, valued at a total of xx Million in the past five years.
Polyol Sweeteners Industry Market Dynamics & Trends
This section delves into the key factors driving market growth, including technological advancements, shifting consumer preferences, and evolving competitive dynamics. The Compound Annual Growth Rate (CAGR) during the forecast period (2025-2033) is projected to be xx%, indicating substantial market expansion. Market penetration is also examined for various polyol types and applications across different regions. The analysis considers the impact of technological disruptions on production efficiency and product innovation.
The global polyol sweeteners market is experiencing robust growth driven by the rising demand for healthier alternatives to traditional sugars in food and beverage applications. Increased health consciousness and the prevalence of diet-related diseases are fueling the adoption of polyol sweeteners. Technological advancements in production processes are leading to improved product quality and cost-effectiveness, further stimulating market expansion. However, competitive dynamics are intense, with established players and new entrants vying for market share through product innovation and strategic partnerships. The market also faces challenges such as fluctuating raw material prices and varying regulatory landscapes across different regions.
Dominant Regions & Segments in Polyol Sweeteners Industry
This section identifies the leading regions and segments within the polyol sweeteners market. Analysis focuses on both "By Type" (Erythritol, Sorbitol, Maltitol, Isomalt, Other Types) and "By Application" (Food and Beverages, Pharmaceuticals, Personal Care) segments. Key drivers of dominance are explored, including economic factors, infrastructure development, and consumer behavior.
By Type:
- Sorbitol: Remains the dominant segment due to its wide applications and established market presence.
- Erythritol: Shows strong growth potential due to its low-calorie nature and favorable consumer perception.
- Maltitol & Isomalt: Occupy significant market share driven by specific applications in confectionery and pharmaceuticals.
By Application:
Food and Beverages: The largest application segment, fueled by increasing demand for healthier food and beverage options.
Pharmaceuticals: A substantial segment, utilizing polyols as excipients in various pharmaceutical formulations.
Personal Care: A smaller but steadily growing segment, with polyols used as humectants and sweeteners in personal care products.
Key Drivers: Rising disposable incomes, changing lifestyles, and increased health awareness are driving segment growth.
Polyol Sweeteners Industry Product Innovations
This section highlights recent product developments, focusing on technological trends and their alignment with market needs. Innovations include the development of novel polyol blends with improved functionalities and the introduction of sustainable production processes. These developments aim to meet growing consumer demand for healthier, more natural, and sustainably sourced sweeteners. The competitive landscape is marked by ongoing efforts to enhance product quality, expand application areas, and create unique value propositions.
Report Scope & Segmentation Analysis
This report comprehensively segments the polyol sweeteners market by type (Erythritol, Sorbitol, Maltitol, Isomalt, Other Types) and application (Food and Beverages, Pharmaceuticals, Personal Care). Each segment's growth projections, market size (in Millions), and competitive dynamics are analyzed. The report provides a detailed overview of the market landscape, including market share distribution among key players, and future growth opportunities.
Key Drivers of Polyol Sweeteners Industry Growth
The polyol sweeteners market is propelled by several key factors: rising health consciousness, increasing demand for low-calorie sweeteners, technological advancements in production processes leading to cost reduction and improved quality, expanding applications in various sectors like food and beverage, pharmaceuticals, and personal care. Favorable government regulations promoting the use of natural sweeteners are further augmenting market growth.
Challenges in the Polyol Sweeteners Industry Sector
The polyol sweeteners industry faces challenges including stringent regulatory requirements for food additives, fluctuations in raw material prices impacting production costs, and intense competition from other natural and artificial sweeteners. Supply chain disruptions and sustainability concerns also pose significant hurdles to industry growth. The estimated impact of these challenges on market growth is xx% reduction in CAGR.
Emerging Opportunities in Polyol Sweeteners Industry
Emerging opportunities lie in the development of novel polyol blends with improved functionalities, expansion into new geographic markets with growing health awareness, and the exploration of sustainable and eco-friendly production methods. The growing demand for plant-based ingredients and increasing focus on clean label products present significant growth avenues.
Leading Players in the Polyol Sweeteners Industry Market
- Hebei Huaxu Pharmaceutical Co Ltd
- BENEO GmbH
- B Food Science Co Ltd
- DFI Corporation
- DHW Deutsche Hydrierwerke GmbH
- Dupont Nutrition & Health (Danisco)
- Archer Daniels Midland Company
- Roquette Frères
- Cargill Inc
- Ingredion Incorporated
Key Developments in Polyol Sweeteners Industry Industry
- March 2023: Archer Daniels Midland Company launched the Knwble Grwn brand, focusing on sustainably sourced plant-based ingredients. This signifies a shift towards sustainable and ethical sourcing within the industry.
- March 2022: Roquette invested USD 27.6 Million in liquid and powder sugar polyol production, strengthening its market position. This investment underscores the ongoing growth and competition in the polyol sweeteners market.
Future Outlook for Polyol Sweeteners Industry Market
The future of the polyol sweeteners market is bright, driven by sustained growth in health consciousness, expanding applications in diverse sectors, and continuous innovation in product development and production processes. Strategic partnerships, technological advancements, and a focus on sustainability will shape the industry's future trajectory. The market is expected to witness significant expansion in the coming years, presenting lucrative opportunities for existing players and new entrants alike.
Polyol Sweeteners Industry Segmentation
-
1. Type
- 1.1. Erythritol
- 1.2. Sorbitol
- 1.3. Maltitol
- 1.4. Isomalt
- 1.5. Other Types
-
2. Application
- 2.1. Food and Beverages
- 2.2. Pharmaceuticals
- 2.3. Personal Care
Polyol Sweeteners Industry Segmentation By Geography
-
1. North America
- 1.1. United States
- 1.2. Canada
- 1.3. Mexico
- 1.4. Rest of North America
-
2. Europe
- 2.1. United Kingdom
- 2.2. Germany
- 2.3. France
- 2.4. Russia
- 2.5. Italy
- 2.6. Spain
- 2.7. Rest of Europe
-
3. Asia Pacific
- 3.1. India
- 3.2. China
- 3.3. Japan
- 3.4. Australia
- 3.5. Rest of Asia Pacific
-
4. South America
- 4.1. Brazil
- 4.2. Argentina
- 4.3. Rest of South America
- 5. Middle East
-
6. South Africa
- 6.1. Saudi Arabia
- 6.2. Rest of MEA
Polyol Sweeteners Industry REPORT HIGHLIGHTS
| Aspects | Details |
|---|---|
| Study Period | 2019-2033 |
| Base Year | 2024 |
| Estimated Year | 2025 |
| Forecast Period | 2025-2033 |
| Historical Period | 2019-2024 |
| Growth Rate | CAGR of 4.50% from 2019-2033 |
| Segmentation |
|
Table of Contents
- 1. Introduction
- 1.1. Research Scope
- 1.2. Market Segmentation
- 1.3. Research Methodology
- 1.4. Definitions and Assumptions
- 2. Executive Summary
- 2.1. Introduction
- 3. Market Dynamics
- 3.1. Introduction
- 3.2. Market Drivers
- 3.2.1. Increasing Demand for Organic Plant Proteins; Increasing Application of Pea Protein in Food and Beverages
- 3.3. Market Restrains
- 3.3.1. Presence of Alternative protein sources
- 3.4. Market Trends
- 3.4.1. Rising Preference Towards Low-Calorie Sweetener
- 4. Market Factor Analysis
- 4.1. Porters Five Forces
- 4.2. Supply/Value Chain
- 4.3. PESTEL analysis
- 4.4. Market Entropy
- 4.5. Patent/Trademark Analysis
- 5. Global Polyol Sweeteners Industry Analysis, Insights and Forecast, 2019-2031
- 5.1. Market Analysis, Insights and Forecast - by Type
- 5.1.1. Erythritol
- 5.1.2. Sorbitol
- 5.1.3. Maltitol
- 5.1.4. Isomalt
- 5.1.5. Other Types
- 5.2. Market Analysis, Insights and Forecast - by Application
- 5.2.1. Food and Beverages
- 5.2.2. Pharmaceuticals
- 5.2.3. Personal Care
- 5.3. Market Analysis, Insights and Forecast - by Region
- 5.3.1. North America
- 5.3.2. Europe
- 5.3.3. Asia Pacific
- 5.3.4. South America
- 5.3.5. Middle East
- 5.3.6. South Africa
- 5.1. Market Analysis, Insights and Forecast - by Type
- 6. North America Polyol Sweeteners Industry Analysis, Insights and Forecast, 2019-2031
- 6.1. Market Analysis, Insights and Forecast - by Type
- 6.1.1. Erythritol
- 6.1.2. Sorbitol
- 6.1.3. Maltitol
- 6.1.4. Isomalt
- 6.1.5. Other Types
- 6.2. Market Analysis, Insights and Forecast - by Application
- 6.2.1. Food and Beverages
- 6.2.2. Pharmaceuticals
- 6.2.3. Personal Care
- 6.1. Market Analysis, Insights and Forecast - by Type
- 7. Europe Polyol Sweeteners Industry Analysis, Insights and Forecast, 2019-2031
- 7.1. Market Analysis, Insights and Forecast - by Type
- 7.1.1. Erythritol
- 7.1.2. Sorbitol
- 7.1.3. Maltitol
- 7.1.4. Isomalt
- 7.1.5. Other Types
- 7.2. Market Analysis, Insights and Forecast - by Application
- 7.2.1. Food and Beverages
- 7.2.2. Pharmaceuticals
- 7.2.3. Personal Care
- 7.1. Market Analysis, Insights and Forecast - by Type
- 8. Asia Pacific Polyol Sweeteners Industry Analysis, Insights and Forecast, 2019-2031
- 8.1. Market Analysis, Insights and Forecast - by Type
- 8.1.1. Erythritol
- 8.1.2. Sorbitol
- 8.1.3. Maltitol
- 8.1.4. Isomalt
- 8.1.5. Other Types
- 8.2. Market Analysis, Insights and Forecast - by Application
- 8.2.1. Food and Beverages
- 8.2.2. Pharmaceuticals
- 8.2.3. Personal Care
- 8.1. Market Analysis, Insights and Forecast - by Type
- 9. South America Polyol Sweeteners Industry Analysis, Insights and Forecast, 2019-2031
- 9.1. Market Analysis, Insights and Forecast - by Type
- 9.1.1. Erythritol
- 9.1.2. Sorbitol
- 9.1.3. Maltitol
- 9.1.4. Isomalt
- 9.1.5. Other Types
- 9.2. Market Analysis, Insights and Forecast - by Application
- 9.2.1. Food and Beverages
- 9.2.2. Pharmaceuticals
- 9.2.3. Personal Care
- 9.1. Market Analysis, Insights and Forecast - by Type
- 10. Middle East Polyol Sweeteners Industry Analysis, Insights and Forecast, 2019-2031
- 10.1. Market Analysis, Insights and Forecast - by Type
- 10.1.1. Erythritol
- 10.1.2. Sorbitol
- 10.1.3. Maltitol
- 10.1.4. Isomalt
- 10.1.5. Other Types
- 10.2. Market Analysis, Insights and Forecast - by Application
- 10.2.1. Food and Beverages
- 10.2.2. Pharmaceuticals
- 10.2.3. Personal Care
- 10.1. Market Analysis, Insights and Forecast - by Type
- 11. South Africa Polyol Sweeteners Industry Analysis, Insights and Forecast, 2019-2031
- 11.1. Market Analysis, Insights and Forecast - by Type
- 11.1.1. Erythritol
- 11.1.2. Sorbitol
- 11.1.3. Maltitol
- 11.1.4. Isomalt
- 11.1.5. Other Types
- 11.2. Market Analysis, Insights and Forecast - by Application
- 11.2.1. Food and Beverages
- 11.2.2. Pharmaceuticals
- 11.2.3. Personal Care
- 11.1. Market Analysis, Insights and Forecast - by Type
- 12. North America Polyol Sweeteners Industry Analysis, Insights and Forecast, 2019-2031
- 12.1. Market Analysis, Insights and Forecast - By Country/Sub-region
- 12.1.1 United States
- 12.1.2 Canada
- 12.1.3 Mexico
- 12.1.4 Rest of North America
- 13. Europe Polyol Sweeteners Industry Analysis, Insights and Forecast, 2019-2031
- 13.1. Market Analysis, Insights and Forecast - By Country/Sub-region
- 13.1.1 United Kingdom
- 13.1.2 Germany
- 13.1.3 France
- 13.1.4 Russia
- 13.1.5 Italy
- 13.1.6 Spain
- 13.1.7 Rest of Europe
- 14. Asia Pacific Polyol Sweeteners Industry Analysis, Insights and Forecast, 2019-2031
- 14.1. Market Analysis, Insights and Forecast - By Country/Sub-region
- 14.1.1 India
- 14.1.2 China
- 14.1.3 Japan
- 14.1.4 Australia
- 14.1.5 Rest of Asia Pacific
- 15. South America Polyol Sweeteners Industry Analysis, Insights and Forecast, 2019-2031
- 15.1. Market Analysis, Insights and Forecast - By Country/Sub-region
- 15.1.1 Brazil
- 15.1.2 Argentina
- 15.1.3 Rest of South America
- 16. Middle East Polyol Sweeteners Industry Analysis, Insights and Forecast, 2019-2031
- 16.1. Market Analysis, Insights and Forecast - By Country/Sub-region
- 16.1.1.
- 17. South Africa Polyol Sweeteners Industry Analysis, Insights and Forecast, 2019-2031
- 17.1. Market Analysis, Insights and Forecast - By Country/Sub-region
- 17.1.1 Saudi Arabia
- 17.1.2 Rest of MEA
- 18. Competitive Analysis
- 18.1. Global Market Share Analysis 2024
- 18.2. Company Profiles
- 18.2.1 Hebei Huaxu Pharmaceutical Co Ltd *List Not Exhaustive
- 18.2.1.1. Overview
- 18.2.1.2. Products
- 18.2.1.3. SWOT Analysis
- 18.2.1.4. Recent Developments
- 18.2.1.5. Financials (Based on Availability)
- 18.2.2 BENEO GmbH
- 18.2.2.1. Overview
- 18.2.2.2. Products
- 18.2.2.3. SWOT Analysis
- 18.2.2.4. Recent Developments
- 18.2.2.5. Financials (Based on Availability)
- 18.2.3 B Food Science Co Ltd
- 18.2.3.1. Overview
- 18.2.3.2. Products
- 18.2.3.3. SWOT Analysis
- 18.2.3.4. Recent Developments
- 18.2.3.5. Financials (Based on Availability)
- 18.2.4 DFI Corporation
- 18.2.4.1. Overview
- 18.2.4.2. Products
- 18.2.4.3. SWOT Analysis
- 18.2.4.4. Recent Developments
- 18.2.4.5. Financials (Based on Availability)
- 18.2.5 DHW Deutsche Hydrierwerke GmbH
- 18.2.5.1. Overview
- 18.2.5.2. Products
- 18.2.5.3. SWOT Analysis
- 18.2.5.4. Recent Developments
- 18.2.5.5. Financials (Based on Availability)
- 18.2.6 Dupont Nutrition & Health (Danisco)
- 18.2.6.1. Overview
- 18.2.6.2. Products
- 18.2.6.3. SWOT Analysis
- 18.2.6.4. Recent Developments
- 18.2.6.5. Financials (Based on Availability)
- 18.2.7 Archer Daniels Midland Company
- 18.2.7.1. Overview
- 18.2.7.2. Products
- 18.2.7.3. SWOT Analysis
- 18.2.7.4. Recent Developments
- 18.2.7.5. Financials (Based on Availability)
- 18.2.8 Roquette Frères
- 18.2.8.1. Overview
- 18.2.8.2. Products
- 18.2.8.3. SWOT Analysis
- 18.2.8.4. Recent Developments
- 18.2.8.5. Financials (Based on Availability)
- 18.2.9 Cargill Inc
- 18.2.9.1. Overview
- 18.2.9.2. Products
- 18.2.9.3. SWOT Analysis
- 18.2.9.4. Recent Developments
- 18.2.9.5. Financials (Based on Availability)
- 18.2.10 Ingredion Incorporated
- 18.2.10.1. Overview
- 18.2.10.2. Products
- 18.2.10.3. SWOT Analysis
- 18.2.10.4. Recent Developments
- 18.2.10.5. Financials (Based on Availability)
- 18.2.1 Hebei Huaxu Pharmaceutical Co Ltd *List Not Exhaustive
List of Figures
- Figure 1: Global Polyol Sweeteners Industry Revenue Breakdown (Million, %) by Region 2024 & 2032
- Figure 2: Global Polyol Sweeteners Industry Volume Breakdown (K Tons, %) by Region 2024 & 2032
- Figure 3: North America Polyol Sweeteners Industry Revenue (Million), by Country 2024 & 2032
- Figure 4: North America Polyol Sweeteners Industry Volume (K Tons), by Country 2024 & 2032
- Figure 5: North America Polyol Sweeteners Industry Revenue Share (%), by Country 2024 & 2032
- Figure 6: North America Polyol Sweeteners Industry Volume Share (%), by Country 2024 & 2032
- Figure 7: Europe Polyol Sweeteners Industry Revenue (Million), by Country 2024 & 2032
- Figure 8: Europe Polyol Sweeteners Industry Volume (K Tons), by Country 2024 & 2032
- Figure 9: Europe Polyol Sweeteners Industry Revenue Share (%), by Country 2024 & 2032
- Figure 10: Europe Polyol Sweeteners Industry Volume Share (%), by Country 2024 & 2032
- Figure 11: Asia Pacific Polyol Sweeteners Industry Revenue (Million), by Country 2024 & 2032
- Figure 12: Asia Pacific Polyol Sweeteners Industry Volume (K Tons), by Country 2024 & 2032
- Figure 13: Asia Pacific Polyol Sweeteners Industry Revenue Share (%), by Country 2024 & 2032
- Figure 14: Asia Pacific Polyol Sweeteners Industry Volume Share (%), by Country 2024 & 2032
- Figure 15: South America Polyol Sweeteners Industry Revenue (Million), by Country 2024 & 2032
- Figure 16: South America Polyol Sweeteners Industry Volume (K Tons), by Country 2024 & 2032
- Figure 17: South America Polyol Sweeteners Industry Revenue Share (%), by Country 2024 & 2032
- Figure 18: South America Polyol Sweeteners Industry Volume Share (%), by Country 2024 & 2032
- Figure 19: Middle East Polyol Sweeteners Industry Revenue (Million), by Country 2024 & 2032
- Figure 20: Middle East Polyol Sweeteners Industry Volume (K Tons), by Country 2024 & 2032
- Figure 21: Middle East Polyol Sweeteners Industry Revenue Share (%), by Country 2024 & 2032
- Figure 22: Middle East Polyol Sweeteners Industry Volume Share (%), by Country 2024 & 2032
- Figure 23: South Africa Polyol Sweeteners Industry Revenue (Million), by Country 2024 & 2032
- Figure 24: South Africa Polyol Sweeteners Industry Volume (K Tons), by Country 2024 & 2032
- Figure 25: South Africa Polyol Sweeteners Industry Revenue Share (%), by Country 2024 & 2032
- Figure 26: South Africa Polyol Sweeteners Industry Volume Share (%), by Country 2024 & 2032
- Figure 27: North America Polyol Sweeteners Industry Revenue (Million), by Type 2024 & 2032
- Figure 28: North America Polyol Sweeteners Industry Volume (K Tons), by Type 2024 & 2032
- Figure 29: North America Polyol Sweeteners Industry Revenue Share (%), by Type 2024 & 2032
- Figure 30: North America Polyol Sweeteners Industry Volume Share (%), by Type 2024 & 2032
- Figure 31: North America Polyol Sweeteners Industry Revenue (Million), by Application 2024 & 2032
- Figure 32: North America Polyol Sweeteners Industry Volume (K Tons), by Application 2024 & 2032
- Figure 33: North America Polyol Sweeteners Industry Revenue Share (%), by Application 2024 & 2032
- Figure 34: North America Polyol Sweeteners Industry Volume Share (%), by Application 2024 & 2032
- Figure 35: North America Polyol Sweeteners Industry Revenue (Million), by Country 2024 & 2032
- Figure 36: North America Polyol Sweeteners Industry Volume (K Tons), by Country 2024 & 2032
- Figure 37: North America Polyol Sweeteners Industry Revenue Share (%), by Country 2024 & 2032
- Figure 38: North America Polyol Sweeteners Industry Volume Share (%), by Country 2024 & 2032
- Figure 39: Europe Polyol Sweeteners Industry Revenue (Million), by Type 2024 & 2032
- Figure 40: Europe Polyol Sweeteners Industry Volume (K Tons), by Type 2024 & 2032
- Figure 41: Europe Polyol Sweeteners Industry Revenue Share (%), by Type 2024 & 2032
- Figure 42: Europe Polyol Sweeteners Industry Volume Share (%), by Type 2024 & 2032
- Figure 43: Europe Polyol Sweeteners Industry Revenue (Million), by Application 2024 & 2032
- Figure 44: Europe Polyol Sweeteners Industry Volume (K Tons), by Application 2024 & 2032
- Figure 45: Europe Polyol Sweeteners Industry Revenue Share (%), by Application 2024 & 2032
- Figure 46: Europe Polyol Sweeteners Industry Volume Share (%), by Application 2024 & 2032
- Figure 47: Europe Polyol Sweeteners Industry Revenue (Million), by Country 2024 & 2032
- Figure 48: Europe Polyol Sweeteners Industry Volume (K Tons), by Country 2024 & 2032
- Figure 49: Europe Polyol Sweeteners Industry Revenue Share (%), by Country 2024 & 2032
- Figure 50: Europe Polyol Sweeteners Industry Volume Share (%), by Country 2024 & 2032
- Figure 51: Asia Pacific Polyol Sweeteners Industry Revenue (Million), by Type 2024 & 2032
- Figure 52: Asia Pacific Polyol Sweeteners Industry Volume (K Tons), by Type 2024 & 2032
- Figure 53: Asia Pacific Polyol Sweeteners Industry Revenue Share (%), by Type 2024 & 2032
- Figure 54: Asia Pacific Polyol Sweeteners Industry Volume Share (%), by Type 2024 & 2032
- Figure 55: Asia Pacific Polyol Sweeteners Industry Revenue (Million), by Application 2024 & 2032
- Figure 56: Asia Pacific Polyol Sweeteners Industry Volume (K Tons), by Application 2024 & 2032
- Figure 57: Asia Pacific Polyol Sweeteners Industry Revenue Share (%), by Application 2024 & 2032
- Figure 58: Asia Pacific Polyol Sweeteners Industry Volume Share (%), by Application 2024 & 2032
- Figure 59: Asia Pacific Polyol Sweeteners Industry Revenue (Million), by Country 2024 & 2032
- Figure 60: Asia Pacific Polyol Sweeteners Industry Volume (K Tons), by Country 2024 & 2032
- Figure 61: Asia Pacific Polyol Sweeteners Industry Revenue Share (%), by Country 2024 & 2032
- Figure 62: Asia Pacific Polyol Sweeteners Industry Volume Share (%), by Country 2024 & 2032
- Figure 63: South America Polyol Sweeteners Industry Revenue (Million), by Type 2024 & 2032
- Figure 64: South America Polyol Sweeteners Industry Volume (K Tons), by Type 2024 & 2032
- Figure 65: South America Polyol Sweeteners Industry Revenue Share (%), by Type 2024 & 2032
- Figure 66: South America Polyol Sweeteners Industry Volume Share (%), by Type 2024 & 2032
- Figure 67: South America Polyol Sweeteners Industry Revenue (Million), by Application 2024 & 2032
- Figure 68: South America Polyol Sweeteners Industry Volume (K Tons), by Application 2024 & 2032
- Figure 69: South America Polyol Sweeteners Industry Revenue Share (%), by Application 2024 & 2032
- Figure 70: South America Polyol Sweeteners Industry Volume Share (%), by Application 2024 & 2032
- Figure 71: South America Polyol Sweeteners Industry Revenue (Million), by Country 2024 & 2032
- Figure 72: South America Polyol Sweeteners Industry Volume (K Tons), by Country 2024 & 2032
- Figure 73: South America Polyol Sweeteners Industry Revenue Share (%), by Country 2024 & 2032
- Figure 74: South America Polyol Sweeteners Industry Volume Share (%), by Country 2024 & 2032
- Figure 75: Middle East Polyol Sweeteners Industry Revenue (Million), by Type 2024 & 2032
- Figure 76: Middle East Polyol Sweeteners Industry Volume (K Tons), by Type 2024 & 2032
- Figure 77: Middle East Polyol Sweeteners Industry Revenue Share (%), by Type 2024 & 2032
- Figure 78: Middle East Polyol Sweeteners Industry Volume Share (%), by Type 2024 & 2032
- Figure 79: Middle East Polyol Sweeteners Industry Revenue (Million), by Application 2024 & 2032
- Figure 80: Middle East Polyol Sweeteners Industry Volume (K Tons), by Application 2024 & 2032
- Figure 81: Middle East Polyol Sweeteners Industry Revenue Share (%), by Application 2024 & 2032
- Figure 82: Middle East Polyol Sweeteners Industry Volume Share (%), by Application 2024 & 2032
- Figure 83: Middle East Polyol Sweeteners Industry Revenue (Million), by Country 2024 & 2032
- Figure 84: Middle East Polyol Sweeteners Industry Volume (K Tons), by Country 2024 & 2032
- Figure 85: Middle East Polyol Sweeteners Industry Revenue Share (%), by Country 2024 & 2032
- Figure 86: Middle East Polyol Sweeteners Industry Volume Share (%), by Country 2024 & 2032
- Figure 87: South Africa Polyol Sweeteners Industry Revenue (Million), by Type 2024 & 2032
- Figure 88: South Africa Polyol Sweeteners Industry Volume (K Tons), by Type 2024 & 2032
- Figure 89: South Africa Polyol Sweeteners Industry Revenue Share (%), by Type 2024 & 2032
- Figure 90: South Africa Polyol Sweeteners Industry Volume Share (%), by Type 2024 & 2032
- Figure 91: South Africa Polyol Sweeteners Industry Revenue (Million), by Application 2024 & 2032
- Figure 92: South Africa Polyol Sweeteners Industry Volume (K Tons), by Application 2024 & 2032
- Figure 93: South Africa Polyol Sweeteners Industry Revenue Share (%), by Application 2024 & 2032
- Figure 94: South Africa Polyol Sweeteners Industry Volume Share (%), by Application 2024 & 2032
- Figure 95: South Africa Polyol Sweeteners Industry Revenue (Million), by Country 2024 & 2032
- Figure 96: South Africa Polyol Sweeteners Industry Volume (K Tons), by Country 2024 & 2032
- Figure 97: South Africa Polyol Sweeteners Industry Revenue Share (%), by Country 2024 & 2032
- Figure 98: South Africa Polyol Sweeteners Industry Volume Share (%), by Country 2024 & 2032
List of Tables
- Table 1: Global Polyol Sweeteners Industry Revenue Million Forecast, by Region 2019 & 2032
- Table 2: Global Polyol Sweeteners Industry Volume K Tons Forecast, by Region 2019 & 2032
- Table 3: Global Polyol Sweeteners Industry Revenue Million Forecast, by Type 2019 & 2032
- Table 4: Global Polyol Sweeteners Industry Volume K Tons Forecast, by Type 2019 & 2032
- Table 5: Global Polyol Sweeteners Industry Revenue Million Forecast, by Application 2019 & 2032
- Table 6: Global Polyol Sweeteners Industry Volume K Tons Forecast, by Application 2019 & 2032
- Table 7: Global Polyol Sweeteners Industry Revenue Million Forecast, by Region 2019 & 2032
- Table 8: Global Polyol Sweeteners Industry Volume K Tons Forecast, by Region 2019 & 2032
- Table 9: Global Polyol Sweeteners Industry Revenue Million Forecast, by Country 2019 & 2032
- Table 10: Global Polyol Sweeteners Industry Volume K Tons Forecast, by Country 2019 & 2032
- Table 11: United States Polyol Sweeteners Industry Revenue (Million) Forecast, by Application 2019 & 2032
- Table 12: United States Polyol Sweeteners Industry Volume (K Tons) Forecast, by Application 2019 & 2032
- Table 13: Canada Polyol Sweeteners Industry Revenue (Million) Forecast, by Application 2019 & 2032
- Table 14: Canada Polyol Sweeteners Industry Volume (K Tons) Forecast, by Application 2019 & 2032
- Table 15: Mexico Polyol Sweeteners Industry Revenue (Million) Forecast, by Application 2019 & 2032
- Table 16: Mexico Polyol Sweeteners Industry Volume (K Tons) Forecast, by Application 2019 & 2032
- Table 17: Rest of North America Polyol Sweeteners Industry Revenue (Million) Forecast, by Application 2019 & 2032
- Table 18: Rest of North America Polyol Sweeteners Industry Volume (K Tons) Forecast, by Application 2019 & 2032
- Table 19: Global Polyol Sweeteners Industry Revenue Million Forecast, by Country 2019 & 2032
- Table 20: Global Polyol Sweeteners Industry Volume K Tons Forecast, by Country 2019 & 2032
- Table 21: United Kingdom Polyol Sweeteners Industry Revenue (Million) Forecast, by Application 2019 & 2032
- Table 22: United Kingdom Polyol Sweeteners Industry Volume (K Tons) Forecast, by Application 2019 & 2032
- Table 23: Germany Polyol Sweeteners Industry Revenue (Million) Forecast, by Application 2019 & 2032
- Table 24: Germany Polyol Sweeteners Industry Volume (K Tons) Forecast, by Application 2019 & 2032
- Table 25: France Polyol Sweeteners Industry Revenue (Million) Forecast, by Application 2019 & 2032
- Table 26: France Polyol Sweeteners Industry Volume (K Tons) Forecast, by Application 2019 & 2032
- Table 27: Russia Polyol Sweeteners Industry Revenue (Million) Forecast, by Application 2019 & 2032
- Table 28: Russia Polyol Sweeteners Industry Volume (K Tons) Forecast, by Application 2019 & 2032
- Table 29: Italy Polyol Sweeteners Industry Revenue (Million) Forecast, by Application 2019 & 2032
- Table 30: Italy Polyol Sweeteners Industry Volume (K Tons) Forecast, by Application 2019 & 2032
- Table 31: Spain Polyol Sweeteners Industry Revenue (Million) Forecast, by Application 2019 & 2032
- Table 32: Spain Polyol Sweeteners Industry Volume (K Tons) Forecast, by Application 2019 & 2032
- Table 33: Rest of Europe Polyol Sweeteners Industry Revenue (Million) Forecast, by Application 2019 & 2032
- Table 34: Rest of Europe Polyol Sweeteners Industry Volume (K Tons) Forecast, by Application 2019 & 2032
- Table 35: Global Polyol Sweeteners Industry Revenue Million Forecast, by Country 2019 & 2032
- Table 36: Global Polyol Sweeteners Industry Volume K Tons Forecast, by Country 2019 & 2032
- Table 37: India Polyol Sweeteners Industry Revenue (Million) Forecast, by Application 2019 & 2032
- Table 38: India Polyol Sweeteners Industry Volume (K Tons) Forecast, by Application 2019 & 2032
- Table 39: China Polyol Sweeteners Industry Revenue (Million) Forecast, by Application 2019 & 2032
- Table 40: China Polyol Sweeteners Industry Volume (K Tons) Forecast, by Application 2019 & 2032
- Table 41: Japan Polyol Sweeteners Industry Revenue (Million) Forecast, by Application 2019 & 2032
- Table 42: Japan Polyol Sweeteners Industry Volume (K Tons) Forecast, by Application 2019 & 2032
- Table 43: Australia Polyol Sweeteners Industry Revenue (Million) Forecast, by Application 2019 & 2032
- Table 44: Australia Polyol Sweeteners Industry Volume (K Tons) Forecast, by Application 2019 & 2032
- Table 45: Rest of Asia Pacific Polyol Sweeteners Industry Revenue (Million) Forecast, by Application 2019 & 2032
- Table 46: Rest of Asia Pacific Polyol Sweeteners Industry Volume (K Tons) Forecast, by Application 2019 & 2032
- Table 47: Global Polyol Sweeteners Industry Revenue Million Forecast, by Country 2019 & 2032
- Table 48: Global Polyol Sweeteners Industry Volume K Tons Forecast, by Country 2019 & 2032
- Table 49: Brazil Polyol Sweeteners Industry Revenue (Million) Forecast, by Application 2019 & 2032
- Table 50: Brazil Polyol Sweeteners Industry Volume (K Tons) Forecast, by Application 2019 & 2032
- Table 51: Argentina Polyol Sweeteners Industry Revenue (Million) Forecast, by Application 2019 & 2032
- Table 52: Argentina Polyol Sweeteners Industry Volume (K Tons) Forecast, by Application 2019 & 2032
- Table 53: Rest of South America Polyol Sweeteners Industry Revenue (Million) Forecast, by Application 2019 & 2032
- Table 54: Rest of South America Polyol Sweeteners Industry Volume (K Tons) Forecast, by Application 2019 & 2032
- Table 55: Global Polyol Sweeteners Industry Revenue Million Forecast, by Country 2019 & 2032
- Table 56: Global Polyol Sweeteners Industry Volume K Tons Forecast, by Country 2019 & 2032
- Table 57: Polyol Sweeteners Industry Revenue (Million) Forecast, by Application 2019 & 2032
- Table 58: Polyol Sweeteners Industry Volume (K Tons) Forecast, by Application 2019 & 2032
- Table 59: Global Polyol Sweeteners Industry Revenue Million Forecast, by Country 2019 & 2032
- Table 60: Global Polyol Sweeteners Industry Volume K Tons Forecast, by Country 2019 & 2032
- Table 61: Saudi Arabia Polyol Sweeteners Industry Revenue (Million) Forecast, by Application 2019 & 2032
- Table 62: Saudi Arabia Polyol Sweeteners Industry Volume (K Tons) Forecast, by Application 2019 & 2032
- Table 63: Rest of MEA Polyol Sweeteners Industry Revenue (Million) Forecast, by Application 2019 & 2032
- Table 64: Rest of MEA Polyol Sweeteners Industry Volume (K Tons) Forecast, by Application 2019 & 2032
- Table 65: Global Polyol Sweeteners Industry Revenue Million Forecast, by Type 2019 & 2032
- Table 66: Global Polyol Sweeteners Industry Volume K Tons Forecast, by Type 2019 & 2032
- Table 67: Global Polyol Sweeteners Industry Revenue Million Forecast, by Application 2019 & 2032
- Table 68: Global Polyol Sweeteners Industry Volume K Tons Forecast, by Application 2019 & 2032
- Table 69: Global Polyol Sweeteners Industry Revenue Million Forecast, by Country 2019 & 2032
- Table 70: Global Polyol Sweeteners Industry Volume K Tons Forecast, by Country 2019 & 2032
- Table 71: United States Polyol Sweeteners Industry Revenue (Million) Forecast, by Application 2019 & 2032
- Table 72: United States Polyol Sweeteners Industry Volume (K Tons) Forecast, by Application 2019 & 2032
- Table 73: Canada Polyol Sweeteners Industry Revenue (Million) Forecast, by Application 2019 & 2032
- Table 74: Canada Polyol Sweeteners Industry Volume (K Tons) Forecast, by Application 2019 & 2032
- Table 75: Mexico Polyol Sweeteners Industry Revenue (Million) Forecast, by Application 2019 & 2032
- Table 76: Mexico Polyol Sweeteners Industry Volume (K Tons) Forecast, by Application 2019 & 2032
- Table 77: Rest of North America Polyol Sweeteners Industry Revenue (Million) Forecast, by Application 2019 & 2032
- Table 78: Rest of North America Polyol Sweeteners Industry Volume (K Tons) Forecast, by Application 2019 & 2032
- Table 79: Global Polyol Sweeteners Industry Revenue Million Forecast, by Type 2019 & 2032
- Table 80: Global Polyol Sweeteners Industry Volume K Tons Forecast, by Type 2019 & 2032
- Table 81: Global Polyol Sweeteners Industry Revenue Million Forecast, by Application 2019 & 2032
- Table 82: Global Polyol Sweeteners Industry Volume K Tons Forecast, by Application 2019 & 2032
- Table 83: Global Polyol Sweeteners Industry Revenue Million Forecast, by Country 2019 & 2032
- Table 84: Global Polyol Sweeteners Industry Volume K Tons Forecast, by Country 2019 & 2032
- Table 85: United Kingdom Polyol Sweeteners Industry Revenue (Million) Forecast, by Application 2019 & 2032
- Table 86: United Kingdom Polyol Sweeteners Industry Volume (K Tons) Forecast, by Application 2019 & 2032
- Table 87: Germany Polyol Sweeteners Industry Revenue (Million) Forecast, by Application 2019 & 2032
- Table 88: Germany Polyol Sweeteners Industry Volume (K Tons) Forecast, by Application 2019 & 2032
- Table 89: France Polyol Sweeteners Industry Revenue (Million) Forecast, by Application 2019 & 2032
- Table 90: France Polyol Sweeteners Industry Volume (K Tons) Forecast, by Application 2019 & 2032
- Table 91: Russia Polyol Sweeteners Industry Revenue (Million) Forecast, by Application 2019 & 2032
- Table 92: Russia Polyol Sweeteners Industry Volume (K Tons) Forecast, by Application 2019 & 2032
- Table 93: Italy Polyol Sweeteners Industry Revenue (Million) Forecast, by Application 2019 & 2032
- Table 94: Italy Polyol Sweeteners Industry Volume (K Tons) Forecast, by Application 2019 & 2032
- Table 95: Spain Polyol Sweeteners Industry Revenue (Million) Forecast, by Application 2019 & 2032
- Table 96: Spain Polyol Sweeteners Industry Volume (K Tons) Forecast, by Application 2019 & 2032
- Table 97: Rest of Europe Polyol Sweeteners Industry Revenue (Million) Forecast, by Application 2019 & 2032
- Table 98: Rest of Europe Polyol Sweeteners Industry Volume (K Tons) Forecast, by Application 2019 & 2032
- Table 99: Global Polyol Sweeteners Industry Revenue Million Forecast, by Type 2019 & 2032
- Table 100: Global Polyol Sweeteners Industry Volume K Tons Forecast, by Type 2019 & 2032
- Table 101: Global Polyol Sweeteners Industry Revenue Million Forecast, by Application 2019 & 2032
- Table 102: Global Polyol Sweeteners Industry Volume K Tons Forecast, by Application 2019 & 2032
- Table 103: Global Polyol Sweeteners Industry Revenue Million Forecast, by Country 2019 & 2032
- Table 104: Global Polyol Sweeteners Industry Volume K Tons Forecast, by Country 2019 & 2032
- Table 105: India Polyol Sweeteners Industry Revenue (Million) Forecast, by Application 2019 & 2032
- Table 106: India Polyol Sweeteners Industry Volume (K Tons) Forecast, by Application 2019 & 2032
- Table 107: China Polyol Sweeteners Industry Revenue (Million) Forecast, by Application 2019 & 2032
- Table 108: China Polyol Sweeteners Industry Volume (K Tons) Forecast, by Application 2019 & 2032
- Table 109: Japan Polyol Sweeteners Industry Revenue (Million) Forecast, by Application 2019 & 2032
- Table 110: Japan Polyol Sweeteners Industry Volume (K Tons) Forecast, by Application 2019 & 2032
- Table 111: Australia Polyol Sweeteners Industry Revenue (Million) Forecast, by Application 2019 & 2032
- Table 112: Australia Polyol Sweeteners Industry Volume (K Tons) Forecast, by Application 2019 & 2032
- Table 113: Rest of Asia Pacific Polyol Sweeteners Industry Revenue (Million) Forecast, by Application 2019 & 2032
- Table 114: Rest of Asia Pacific Polyol Sweeteners Industry Volume (K Tons) Forecast, by Application 2019 & 2032
- Table 115: Global Polyol Sweeteners Industry Revenue Million Forecast, by Type 2019 & 2032
- Table 116: Global Polyol Sweeteners Industry Volume K Tons Forecast, by Type 2019 & 2032
- Table 117: Global Polyol Sweeteners Industry Revenue Million Forecast, by Application 2019 & 2032
- Table 118: Global Polyol Sweeteners Industry Volume K Tons Forecast, by Application 2019 & 2032
- Table 119: Global Polyol Sweeteners Industry Revenue Million Forecast, by Country 2019 & 2032
- Table 120: Global Polyol Sweeteners Industry Volume K Tons Forecast, by Country 2019 & 2032
- Table 121: Brazil Polyol Sweeteners Industry Revenue (Million) Forecast, by Application 2019 & 2032
- Table 122: Brazil Polyol Sweeteners Industry Volume (K Tons) Forecast, by Application 2019 & 2032
- Table 123: Argentina Polyol Sweeteners Industry Revenue (Million) Forecast, by Application 2019 & 2032
- Table 124: Argentina Polyol Sweeteners Industry Volume (K Tons) Forecast, by Application 2019 & 2032
- Table 125: Rest of South America Polyol Sweeteners Industry Revenue (Million) Forecast, by Application 2019 & 2032
- Table 126: Rest of South America Polyol Sweeteners Industry Volume (K Tons) Forecast, by Application 2019 & 2032
- Table 127: Global Polyol Sweeteners Industry Revenue Million Forecast, by Type 2019 & 2032
- Table 128: Global Polyol Sweeteners Industry Volume K Tons Forecast, by Type 2019 & 2032
- Table 129: Global Polyol Sweeteners Industry Revenue Million Forecast, by Application 2019 & 2032
- Table 130: Global Polyol Sweeteners Industry Volume K Tons Forecast, by Application 2019 & 2032
- Table 131: Global Polyol Sweeteners Industry Revenue Million Forecast, by Country 2019 & 2032
- Table 132: Global Polyol Sweeteners Industry Volume K Tons Forecast, by Country 2019 & 2032
- Table 133: Global Polyol Sweeteners Industry Revenue Million Forecast, by Type 2019 & 2032
- Table 134: Global Polyol Sweeteners Industry Volume K Tons Forecast, by Type 2019 & 2032
- Table 135: Global Polyol Sweeteners Industry Revenue Million Forecast, by Application 2019 & 2032
- Table 136: Global Polyol Sweeteners Industry Volume K Tons Forecast, by Application 2019 & 2032
- Table 137: Global Polyol Sweeteners Industry Revenue Million Forecast, by Country 2019 & 2032
- Table 138: Global Polyol Sweeteners Industry Volume K Tons Forecast, by Country 2019 & 2032
- Table 139: Saudi Arabia Polyol Sweeteners Industry Revenue (Million) Forecast, by Application 2019 & 2032
- Table 140: Saudi Arabia Polyol Sweeteners Industry Volume (K Tons) Forecast, by Application 2019 & 2032
- Table 141: Rest of MEA Polyol Sweeteners Industry Revenue (Million) Forecast, by Application 2019 & 2032
- Table 142: Rest of MEA Polyol Sweeteners Industry Volume (K Tons) Forecast, by Application 2019 & 2032
Frequently Asked Questions
1. What is the projected Compound Annual Growth Rate (CAGR) of the Polyol Sweeteners Industry?
The projected CAGR is approximately 4.50%.
2. Which companies are prominent players in the Polyol Sweeteners Industry?
Key companies in the market include Hebei Huaxu Pharmaceutical Co Ltd *List Not Exhaustive, BENEO GmbH, B Food Science Co Ltd, DFI Corporation, DHW Deutsche Hydrierwerke GmbH, Dupont Nutrition & Health (Danisco), Archer Daniels Midland Company, Roquette Frères, Cargill Inc, Ingredion Incorporated.
3. What are the main segments of the Polyol Sweeteners Industry?
The market segments include Type, Application.
4. Can you provide details about the market size?
The market size is estimated to be USD 3500 Million as of 2022.
5. What are some drivers contributing to market growth?
Increasing Demand for Organic Plant Proteins; Increasing Application of Pea Protein in Food and Beverages.
6. What are the notable trends driving market growth?
Rising Preference Towards Low-Calorie Sweetener.
7. Are there any restraints impacting market growth?
Presence of Alternative protein sources.
8. Can you provide examples of recent developments in the market?
March 2023: Archer Daniels Midland Company announced the launch of the Knwble Grwn brand to provide consumers with wholesome, plant-based food ingredients that are sustainably sourced.
9. What pricing options are available for accessing the report?
Pricing options include single-user, multi-user, and enterprise licenses priced at USD 4750, USD 5250, and USD 8750 respectively.
10. Is the market size provided in terms of value or volume?
The market size is provided in terms of value, measured in Million and volume, measured in K Tons.
11. Are there any specific market keywords associated with the report?
Yes, the market keyword associated with the report is "Polyol Sweeteners Industry," which aids in identifying and referencing the specific market segment covered.
12. How do I determine which pricing option suits my needs best?
The pricing options vary based on user requirements and access needs. Individual users may opt for single-user licenses, while businesses requiring broader access may choose multi-user or enterprise licenses for cost-effective access to the report.
13. Are there any additional resources or data provided in the Polyol Sweeteners Industry report?
While the report offers comprehensive insights, it's advisable to review the specific contents or supplementary materials provided to ascertain if additional resources or data are available.
14. How can I stay updated on further developments or reports in the Polyol Sweeteners Industry?
To stay informed about further developments, trends, and reports in the Polyol Sweeteners Industry, consider subscribing to industry newsletters, following relevant companies and organizations, or regularly checking reputable industry news sources and publications.
Methodology
Step 1 - Identification of Relevant Samples Size from Population Database


Step 2 - Approaches for Defining Global Market Size (Value, Volume* & Price*)

Note*: In applicable scenarios
Step 3 - Data Sources
Primary Research
- Web Analytics
- Survey Reports
- Research Institute
- Latest Research Reports
- Opinion Leaders
Secondary Research
- Annual Reports
- White Paper
- Latest Press Release
- Industry Association
- Paid Database
- Investor Presentations

Step 4 - Data Triangulation
Involves using different sources of information in order to increase the validity of a study
These sources are likely to be stakeholders in a program - participants, other researchers, program staff, other community members, and so on.
Then we put all data in single framework & apply various statistical tools to find out the dynamic on the market.
During the analysis stage, feedback from the stakeholder groups would be compared to determine areas of agreement as well as areas of divergence


