
Key Insights
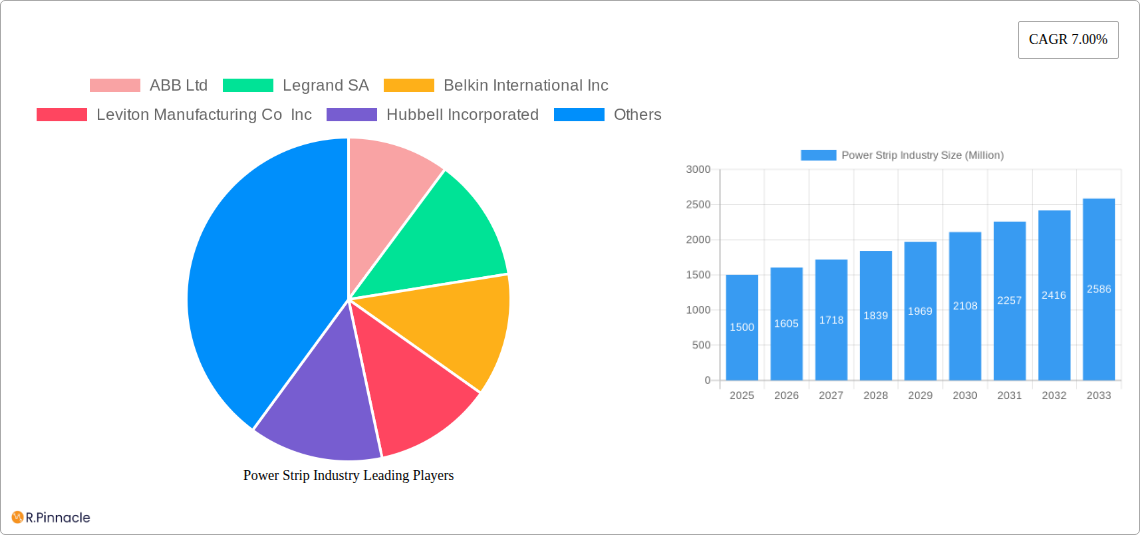
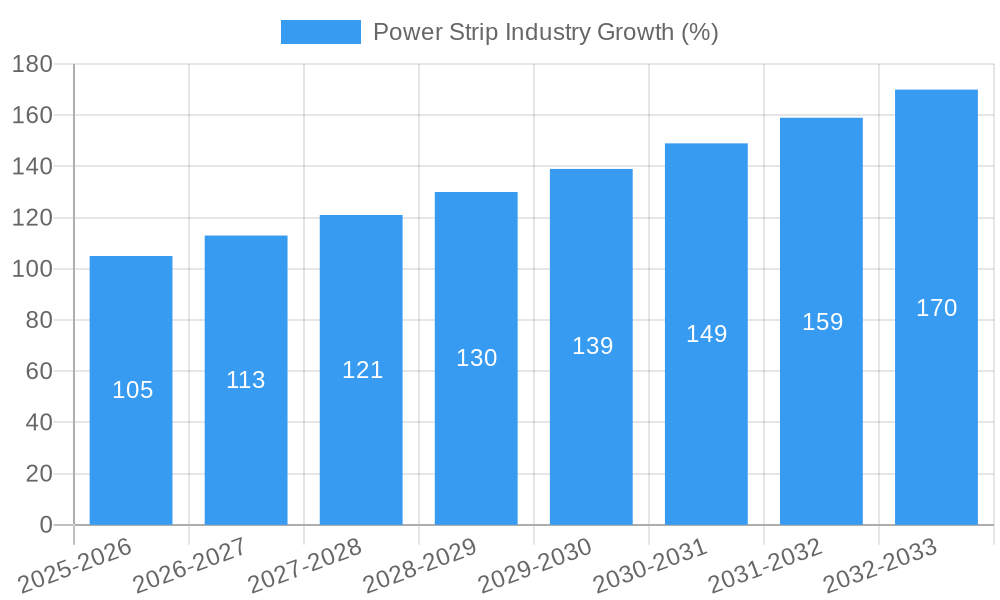
The global power strip market, valued at approximately $XX million in 2025, is experiencing robust growth, projected to expand at a compound annual growth rate (CAGR) of 7.00% from 2025 to 2033. This expansion is driven by several key factors. The increasing adoption of electronic devices in both residential and commercial settings fuels demand for power strips, particularly those offering advanced features like surge protection and USB charging capabilities. Furthermore, the growing industrial sector, with its reliance on sophisticated machinery and equipment, contributes significantly to market growth. Smart power strips, incorporating WiFi and other intelligent features, are emerging as a significant trend, enabling remote control and energy monitoring. However, market growth faces certain restraints, including concerns about safety hazards related to overloading and potential fire risks if not used correctly, and increasing competition from integrated power solutions within furniture and appliances. Segmentation reveals a diversified market: Furniture Power Distribution Units (FPDUs) are likely to hold a significant share due to their integration into modern office and workspace designs, while smart power strips are expected to witness the fastest growth due to rising consumer demand for convenient and energy-efficient solutions. Major players like ABB, Legrand, Belkin, and others are actively shaping the market through innovation and strategic partnerships. Regional analysis indicates that North America and Europe currently hold substantial market share, but the Asia-Pacific region is poised for significant growth due to rapid economic development and rising consumer spending on electronics.
The competitive landscape is characterized by established players alongside emerging companies. Established brands leverage their extensive distribution networks and brand recognition to maintain their market position. However, smaller companies are innovating with feature-rich and cost-effective products, creating a dynamic market. Future growth will depend on technological advancements, increased awareness of safety regulations, and the continuous integration of smart features into power strips. The market is expected to see increased consolidation as larger companies acquire smaller players to expand their product portfolios and market reach. The focus on energy efficiency and sustainability will further drive innovation in power strip technology, leading to the development of environmentally friendly and energy-saving products. This will contribute to the overall growth and evolution of the power strip market in the coming years.
Power Strip Industry Market Report: 2019-2033
This comprehensive report provides a detailed analysis of the global power strip industry, offering invaluable insights for industry professionals, investors, and stakeholders. Covering the period from 2019 to 2033, with a focus on 2025, this report unravels market dynamics, growth drivers, and future trends. The report projects a market value of xx Million by 2033.
Power Strip Industry Market Structure & Innovation Trends
The global power strip market is moderately concentrated, with key players like ABB Ltd, Legrand SA, Belkin International Inc, and Schneider Electric holding significant market share. The combined market share of the top five players is estimated at xx%. Innovation is driven by increasing demand for smart power strips with integrated USB charging and Wi-Fi connectivity, along with enhanced safety features like surge protection. Regulatory frameworks, particularly concerning energy efficiency and safety standards, significantly influence product design and market entry. Product substitutes, such as wireless charging solutions, pose a moderate threat, particularly in the residential segment. End-user demographics, with a growing emphasis on home automation and smart home technology, fuel the demand for sophisticated power strips. M&A activity in the sector has been moderate in recent years, with deal values totaling approximately xx Million in the last five years. Notable acquisitions include [Insert details of any significant M&A activities, if available, otherwise, use "No significant M&A activities reported during the historical period"].
- Market Concentration: Moderately concentrated, top 5 players holding xx% market share.
- Innovation Drivers: Smart features, enhanced safety, energy efficiency standards.
- Regulatory Frameworks: Impacting product design and market access.
- Product Substitutes: Wireless charging technologies pose a moderate threat.
- M&A Activity: xx Million in deal values over the last five years.
Power Strip Industry Market Dynamics & Trends
The global power strip market exhibits a steady growth trajectory, driven by increasing electricity consumption, rising adoption of electronic devices, and expanding urbanization. The CAGR for the period 2025-2033 is projected to be xx%. This growth is fueled by technological advancements, particularly the integration of smart features and USB charging capabilities. Consumer preferences are shifting towards multifunctional and aesthetically pleasing power strips, impacting product design and features. Competitive dynamics are characterized by both price competition and innovation-driven differentiation. Market penetration of smart power strips is increasing rapidly, with an estimated xx% penetration in 2025. Several factors contribute to the market’s dynamic nature, including fluctuating raw material prices and evolving consumer electronics trends.
Dominant Regions & Segments in Power Strip Industry
The North American region currently holds the largest market share in the power strip industry, driven by high electricity consumption, a robust economy, and high adoption rates of electronic devices.
- By Installation Type: Multioutlet assemblies dominate due to their versatility and affordability. Furniture power distribution units (FPDUs) are experiencing growth in commercial and office settings. Relocatable power taps (RPTs) cater to specific niche markets.
- By Application: General-purpose power strips hold the largest segment, followed by surge protection, smart power strips, and specialized power strips for industrial applications.
- By End-User: The commercial sector accounts for the largest share, driven by high demand in offices, retail spaces, and other commercial establishments. Residential and industrial applications represent substantial segments, exhibiting steady growth.
- Key Drivers: Strong economic growth in North America, high electronic device ownership, and developed infrastructure contribute to this regional dominance. In other regions, factors such as increasing infrastructure development and government initiatives promoting energy efficiency are influencing growth.
Power Strip Industry Product Innovations
Recent innovations in the power strip industry are focused on enhancing functionality, safety, and energy efficiency. The integration of smart features such as USB charging, Wi-Fi connectivity, and surge protection are key differentiators. The market sees a growing demand for compact and portable power strips, suitable for travel and mobile use. These innovations address the evolving needs of consumers and businesses, particularly in the context of increased device usage and growing concerns about energy consumption and safety.
Report Scope & Segmentation Analysis
This report segments the power strip market by installation type (FPDUs, multioutlet assemblies, RPTs), application (general purpose, special protection, smart power strips), and end-user (industrial, commercial, residential). Each segment is analyzed in detail, including growth projections, market size estimations, and competitive dynamics. The market size for each segment is projected to expand significantly over the forecast period.
- By Installation Type: The market size for Multioutlet Assemblies is estimated at xx Million in 2025, with a projected CAGR of xx% during the forecast period. FPDUs and RPTs show promising growth potential driven by rising adoption in specialized settings.
- By Application: The smart power strips segment is expected to demonstrate the highest growth rate, fueled by increasing demand for smart home solutions. General purpose power strips maintain a significant market share.
- By End-User: The commercial segment dominates the market, followed by residential and industrial applications. However, all segments are expected to show growth during the forecast period.
Key Drivers of Power Strip Industry Growth
The power strip industry's growth is propelled by several factors: the increasing proliferation of electronic devices in homes and offices, the expansion of the global infrastructure, and rising demand for energy-efficient power solutions. Technological advancements leading to the integration of smart features and USB charging capabilities also contribute significantly. Government regulations promoting energy efficiency and safety standards further influence the market. The growing adoption of smart home technology, and the increasing need for reliable power distribution in various settings are other key growth drivers.
Challenges in the Power Strip Industry Sector
The power strip industry faces challenges such as increasing raw material costs, intense competition, and stringent safety regulations. Supply chain disruptions can significantly impact production and availability. The emergence of substitute technologies, like wireless charging, also poses a competitive threat. These challenges require manufacturers to implement cost-effective strategies, adopt innovative manufacturing techniques, and ensure compliance with evolving regulatory norms. The overall impact of these challenges is estimated to restrain market growth by approximately xx% annually.
Emerging Opportunities in Power Strip Industry
Emerging opportunities lie in the development and adoption of smart power strips with advanced features and improved energy efficiency. Expanding into new markets, particularly in developing economies experiencing rapid urbanization and technological advancement, presents significant potential. The integration of power strips with smart home ecosystems and IoT devices opens further avenues for growth. Moreover, the development of sustainable and eco-friendly power strip solutions can attract environmentally conscious consumers and businesses.
Leading Players in the Power Strip Industry Market
- ABB Ltd
- Legrand SA
- Belkin International Inc
- Leviton Manufacturing Co Inc
- Hubbell Incorporated
- Tripp Lite (Eaton Corporation)
- Koninklijke Philips N V
- Delixi Electric
- Falconer Electronics Inc
- Schneider Electric
- Cyber Power Systems Inc
- Panasonic Corporation
Key Developments in Power Strip Industry
- June 2022: Anker launches the 521 Power Strip, featuring six simultaneous charging ports, ActiveShield temperature monitoring, and an eight-point safety system. This launch expands Anker's product portfolio into the higher-end smart power strip market and strengthens their position in the consumer electronics segment.
- December 2021: Baseus introduces the PowerCombo, a portable power strip with four USB ports and two AC sockets, designed for travelers and consumers seeking improved desk organization. This product addresses a niche market need, offering a compact and highly versatile power solution.
Future Outlook for Power Strip Industry Market
The future of the power strip industry is promising, with continued growth expected driven by technological innovations, increasing electronic device usage, and expanding infrastructure development. Strategic partnerships and collaborations among manufacturers and technology providers can further accelerate market expansion. The focus on energy efficiency, smart features, and robust safety standards will be key determinants of future success in this evolving market. The market is projected to reach xx Million by 2033, demonstrating substantial growth potential.
Power Strip Industry Segmentation
-
1. Installation Type (Qualitative Analysis)
- 1.1. Furniture Power Distribution Units (FPDUs)
- 1.2. Multioutlet Assemblies
- 1.3. Relocatable Power Taps (RPTs)
-
2. Application
- 2.1. Common Type (General Purpose)
- 2.2. Special
- 2.3. Smart Power Strips (USB, WiFi, etc.)
-
3. End-User
- 3.1. Industrial
- 3.2. Commercial
- 3.3. Residential
Power Strip Industry Segmentation By Geography
- 1. North America
- 2. Europe
- 3. Asia Pacific
- 4. Rest of the World

Power Strip Industry REPORT HIGHLIGHTS
| Aspects | Details |
|---|---|
| Study Period | 2019-2033 |
| Base Year | 2024 |
| Estimated Year | 2025 |
| Forecast Period | 2025-2033 |
| Historical Period | 2019-2024 |
| Growth Rate | CAGR of 7.00% from 2019-2033 |
| Segmentation |
|
Table of Contents
- 1. Introduction
- 1.1. Research Scope
- 1.2. Market Segmentation
- 1.3. Research Methodology
- 1.4. Definitions and Assumptions
- 2. Executive Summary
- 2.1. Introduction
- 3. Market Dynamics
- 3.1. Introduction
- 3.2. Market Drivers
- 3.2.1. Growing Demand for Steady Power Supply and Power Saving; Increasing Number of Electronics Devices in Residential Applications
- 3.3. Market Restrains
- 3.3.1. High Deployment and Operational Cost
- 3.4. Market Trends
- 3.4.1. Increasing Number of Electronics Devices in Residential Applications
- 4. Market Factor Analysis
- 4.1. Porters Five Forces
- 4.2. Supply/Value Chain
- 4.3. PESTEL analysis
- 4.4. Market Entropy
- 4.5. Patent/Trademark Analysis
- 5. Global Power Strip Industry Analysis, Insights and Forecast, 2019-2031
- 5.1. Market Analysis, Insights and Forecast - by Installation Type (Qualitative Analysis)
- 5.1.1. Furniture Power Distribution Units (FPDUs)
- 5.1.2. Multioutlet Assemblies
- 5.1.3. Relocatable Power Taps (RPTs)
- 5.2. Market Analysis, Insights and Forecast - by Application
- 5.2.1. Common Type (General Purpose)
- 5.2.2. Special
- 5.2.3. Smart Power Strips (USB, WiFi, etc.)
- 5.3. Market Analysis, Insights and Forecast - by End-User
- 5.3.1. Industrial
- 5.3.2. Commercial
- 5.3.3. Residential
- 5.4. Market Analysis, Insights and Forecast - by Region
- 5.4.1. North America
- 5.4.2. Europe
- 5.4.3. Asia Pacific
- 5.4.4. Rest of the World
- 5.1. Market Analysis, Insights and Forecast - by Installation Type (Qualitative Analysis)
- 6. North America Power Strip Industry Analysis, Insights and Forecast, 2019-2031
- 6.1. Market Analysis, Insights and Forecast - by Installation Type (Qualitative Analysis)
- 6.1.1. Furniture Power Distribution Units (FPDUs)
- 6.1.2. Multioutlet Assemblies
- 6.1.3. Relocatable Power Taps (RPTs)
- 6.2. Market Analysis, Insights and Forecast - by Application
- 6.2.1. Common Type (General Purpose)
- 6.2.2. Special
- 6.2.3. Smart Power Strips (USB, WiFi, etc.)
- 6.3. Market Analysis, Insights and Forecast - by End-User
- 6.3.1. Industrial
- 6.3.2. Commercial
- 6.3.3. Residential
- 6.1. Market Analysis, Insights and Forecast - by Installation Type (Qualitative Analysis)
- 7. Europe Power Strip Industry Analysis, Insights and Forecast, 2019-2031
- 7.1. Market Analysis, Insights and Forecast - by Installation Type (Qualitative Analysis)
- 7.1.1. Furniture Power Distribution Units (FPDUs)
- 7.1.2. Multioutlet Assemblies
- 7.1.3. Relocatable Power Taps (RPTs)
- 7.2. Market Analysis, Insights and Forecast - by Application
- 7.2.1. Common Type (General Purpose)
- 7.2.2. Special
- 7.2.3. Smart Power Strips (USB, WiFi, etc.)
- 7.3. Market Analysis, Insights and Forecast - by End-User
- 7.3.1. Industrial
- 7.3.2. Commercial
- 7.3.3. Residential
- 7.1. Market Analysis, Insights and Forecast - by Installation Type (Qualitative Analysis)
- 8. Asia Pacific Power Strip Industry Analysis, Insights and Forecast, 2019-2031
- 8.1. Market Analysis, Insights and Forecast - by Installation Type (Qualitative Analysis)
- 8.1.1. Furniture Power Distribution Units (FPDUs)
- 8.1.2. Multioutlet Assemblies
- 8.1.3. Relocatable Power Taps (RPTs)
- 8.2. Market Analysis, Insights and Forecast - by Application
- 8.2.1. Common Type (General Purpose)
- 8.2.2. Special
- 8.2.3. Smart Power Strips (USB, WiFi, etc.)
- 8.3. Market Analysis, Insights and Forecast - by End-User
- 8.3.1. Industrial
- 8.3.2. Commercial
- 8.3.3. Residential
- 8.1. Market Analysis, Insights and Forecast - by Installation Type (Qualitative Analysis)
- 9. Rest of the World Power Strip Industry Analysis, Insights and Forecast, 2019-2031
- 9.1. Market Analysis, Insights and Forecast - by Installation Type (Qualitative Analysis)
- 9.1.1. Furniture Power Distribution Units (FPDUs)
- 9.1.2. Multioutlet Assemblies
- 9.1.3. Relocatable Power Taps (RPTs)
- 9.2. Market Analysis, Insights and Forecast - by Application
- 9.2.1. Common Type (General Purpose)
- 9.2.2. Special
- 9.2.3. Smart Power Strips (USB, WiFi, etc.)
- 9.3. Market Analysis, Insights and Forecast - by End-User
- 9.3.1. Industrial
- 9.3.2. Commercial
- 9.3.3. Residential
- 9.1. Market Analysis, Insights and Forecast - by Installation Type (Qualitative Analysis)
- 10. North America Power Strip Industry Analysis, Insights and Forecast, 2019-2031
- 10.1. Market Analysis, Insights and Forecast - By Country/Sub-region
- 10.1.1.
- 11. Europe Power Strip Industry Analysis, Insights and Forecast, 2019-2031
- 11.1. Market Analysis, Insights and Forecast - By Country/Sub-region
- 11.1.1.
- 12. Asia Pacific Power Strip Industry Analysis, Insights and Forecast, 2019-2031
- 12.1. Market Analysis, Insights and Forecast - By Country/Sub-region
- 12.1.1.
- 13. Rest of the World Power Strip Industry Analysis, Insights and Forecast, 2019-2031
- 13.1. Market Analysis, Insights and Forecast - By Country/Sub-region
- 13.1.1.
- 14. Competitive Analysis
- 14.1. Global Market Share Analysis 2024
- 14.2. Company Profiles
- 14.2.1 ABB Ltd
- 14.2.1.1. Overview
- 14.2.1.2. Products
- 14.2.1.3. SWOT Analysis
- 14.2.1.4. Recent Developments
- 14.2.1.5. Financials (Based on Availability)
- 14.2.2 Legrand SA
- 14.2.2.1. Overview
- 14.2.2.2. Products
- 14.2.2.3. SWOT Analysis
- 14.2.2.4. Recent Developments
- 14.2.2.5. Financials (Based on Availability)
- 14.2.3 Belkin International Inc
- 14.2.3.1. Overview
- 14.2.3.2. Products
- 14.2.3.3. SWOT Analysis
- 14.2.3.4. Recent Developments
- 14.2.3.5. Financials (Based on Availability)
- 14.2.4 Leviton Manufacturing Co Inc
- 14.2.4.1. Overview
- 14.2.4.2. Products
- 14.2.4.3. SWOT Analysis
- 14.2.4.4. Recent Developments
- 14.2.4.5. Financials (Based on Availability)
- 14.2.5 Hubbell Incorporated
- 14.2.5.1. Overview
- 14.2.5.2. Products
- 14.2.5.3. SWOT Analysis
- 14.2.5.4. Recent Developments
- 14.2.5.5. Financials (Based on Availability)
- 14.2.6 Tripp Lite (Eaton Corporation)
- 14.2.6.1. Overview
- 14.2.6.2. Products
- 14.2.6.3. SWOT Analysis
- 14.2.6.4. Recent Developments
- 14.2.6.5. Financials (Based on Availability)
- 14.2.7 Koninklijke Philips N V
- 14.2.7.1. Overview
- 14.2.7.2. Products
- 14.2.7.3. SWOT Analysis
- 14.2.7.4. Recent Developments
- 14.2.7.5. Financials (Based on Availability)
- 14.2.8 Delixi Electric
- 14.2.8.1. Overview
- 14.2.8.2. Products
- 14.2.8.3. SWOT Analysis
- 14.2.8.4. Recent Developments
- 14.2.8.5. Financials (Based on Availability)
- 14.2.9 Falconer Electronics Inc
- 14.2.9.1. Overview
- 14.2.9.2. Products
- 14.2.9.3. SWOT Analysis
- 14.2.9.4. Recent Developments
- 14.2.9.5. Financials (Based on Availability)
- 14.2.10 Schneider Electric
- 14.2.10.1. Overview
- 14.2.10.2. Products
- 14.2.10.3. SWOT Analysis
- 14.2.10.4. Recent Developments
- 14.2.10.5. Financials (Based on Availability)
- 14.2.11 Cyber Power Systems Inc
- 14.2.11.1. Overview
- 14.2.11.2. Products
- 14.2.11.3. SWOT Analysis
- 14.2.11.4. Recent Developments
- 14.2.11.5. Financials (Based on Availability)
- 14.2.12 Panasonic Corporation
- 14.2.12.1. Overview
- 14.2.12.2. Products
- 14.2.12.3. SWOT Analysis
- 14.2.12.4. Recent Developments
- 14.2.12.5. Financials (Based on Availability)
- 14.2.1 ABB Ltd
List of Figures
- Figure 1: Global Power Strip Industry Revenue Breakdown (Million, %) by Region 2024 & 2032
- Figure 2: North America Power Strip Industry Revenue (Million), by Country 2024 & 2032
- Figure 3: North America Power Strip Industry Revenue Share (%), by Country 2024 & 2032
- Figure 4: Europe Power Strip Industry Revenue (Million), by Country 2024 & 2032
- Figure 5: Europe Power Strip Industry Revenue Share (%), by Country 2024 & 2032
- Figure 6: Asia Pacific Power Strip Industry Revenue (Million), by Country 2024 & 2032
- Figure 7: Asia Pacific Power Strip Industry Revenue Share (%), by Country 2024 & 2032
- Figure 8: Rest of the World Power Strip Industry Revenue (Million), by Country 2024 & 2032
- Figure 9: Rest of the World Power Strip Industry Revenue Share (%), by Country 2024 & 2032
- Figure 10: North America Power Strip Industry Revenue (Million), by Installation Type (Qualitative Analysis) 2024 & 2032
- Figure 11: North America Power Strip Industry Revenue Share (%), by Installation Type (Qualitative Analysis) 2024 & 2032
- Figure 12: North America Power Strip Industry Revenue (Million), by Application 2024 & 2032
- Figure 13: North America Power Strip Industry Revenue Share (%), by Application 2024 & 2032
- Figure 14: North America Power Strip Industry Revenue (Million), by End-User 2024 & 2032
- Figure 15: North America Power Strip Industry Revenue Share (%), by End-User 2024 & 2032
- Figure 16: North America Power Strip Industry Revenue (Million), by Country 2024 & 2032
- Figure 17: North America Power Strip Industry Revenue Share (%), by Country 2024 & 2032
- Figure 18: Europe Power Strip Industry Revenue (Million), by Installation Type (Qualitative Analysis) 2024 & 2032
- Figure 19: Europe Power Strip Industry Revenue Share (%), by Installation Type (Qualitative Analysis) 2024 & 2032
- Figure 20: Europe Power Strip Industry Revenue (Million), by Application 2024 & 2032
- Figure 21: Europe Power Strip Industry Revenue Share (%), by Application 2024 & 2032
- Figure 22: Europe Power Strip Industry Revenue (Million), by End-User 2024 & 2032
- Figure 23: Europe Power Strip Industry Revenue Share (%), by End-User 2024 & 2032
- Figure 24: Europe Power Strip Industry Revenue (Million), by Country 2024 & 2032
- Figure 25: Europe Power Strip Industry Revenue Share (%), by Country 2024 & 2032
- Figure 26: Asia Pacific Power Strip Industry Revenue (Million), by Installation Type (Qualitative Analysis) 2024 & 2032
- Figure 27: Asia Pacific Power Strip Industry Revenue Share (%), by Installation Type (Qualitative Analysis) 2024 & 2032
- Figure 28: Asia Pacific Power Strip Industry Revenue (Million), by Application 2024 & 2032
- Figure 29: Asia Pacific Power Strip Industry Revenue Share (%), by Application 2024 & 2032
- Figure 30: Asia Pacific Power Strip Industry Revenue (Million), by End-User 2024 & 2032
- Figure 31: Asia Pacific Power Strip Industry Revenue Share (%), by End-User 2024 & 2032
- Figure 32: Asia Pacific Power Strip Industry Revenue (Million), by Country 2024 & 2032
- Figure 33: Asia Pacific Power Strip Industry Revenue Share (%), by Country 2024 & 2032
- Figure 34: Rest of the World Power Strip Industry Revenue (Million), by Installation Type (Qualitative Analysis) 2024 & 2032
- Figure 35: Rest of the World Power Strip Industry Revenue Share (%), by Installation Type (Qualitative Analysis) 2024 & 2032
- Figure 36: Rest of the World Power Strip Industry Revenue (Million), by Application 2024 & 2032
- Figure 37: Rest of the World Power Strip Industry Revenue Share (%), by Application 2024 & 2032
- Figure 38: Rest of the World Power Strip Industry Revenue (Million), by End-User 2024 & 2032
- Figure 39: Rest of the World Power Strip Industry Revenue Share (%), by End-User 2024 & 2032
- Figure 40: Rest of the World Power Strip Industry Revenue (Million), by Country 2024 & 2032
- Figure 41: Rest of the World Power Strip Industry Revenue Share (%), by Country 2024 & 2032
List of Tables
- Table 1: Global Power Strip Industry Revenue Million Forecast, by Region 2019 & 2032
- Table 2: Global Power Strip Industry Revenue Million Forecast, by Installation Type (Qualitative Analysis) 2019 & 2032
- Table 3: Global Power Strip Industry Revenue Million Forecast, by Application 2019 & 2032
- Table 4: Global Power Strip Industry Revenue Million Forecast, by End-User 2019 & 2032
- Table 5: Global Power Strip Industry Revenue Million Forecast, by Region 2019 & 2032
- Table 6: Global Power Strip Industry Revenue Million Forecast, by Country 2019 & 2032
- Table 7: Power Strip Industry Revenue (Million) Forecast, by Application 2019 & 2032
- Table 8: Global Power Strip Industry Revenue Million Forecast, by Country 2019 & 2032
- Table 9: Power Strip Industry Revenue (Million) Forecast, by Application 2019 & 2032
- Table 10: Global Power Strip Industry Revenue Million Forecast, by Country 2019 & 2032
- Table 11: Power Strip Industry Revenue (Million) Forecast, by Application 2019 & 2032
- Table 12: Global Power Strip Industry Revenue Million Forecast, by Country 2019 & 2032
- Table 13: Power Strip Industry Revenue (Million) Forecast, by Application 2019 & 2032
- Table 14: Global Power Strip Industry Revenue Million Forecast, by Installation Type (Qualitative Analysis) 2019 & 2032
- Table 15: Global Power Strip Industry Revenue Million Forecast, by Application 2019 & 2032
- Table 16: Global Power Strip Industry Revenue Million Forecast, by End-User 2019 & 2032
- Table 17: Global Power Strip Industry Revenue Million Forecast, by Country 2019 & 2032
- Table 18: Global Power Strip Industry Revenue Million Forecast, by Installation Type (Qualitative Analysis) 2019 & 2032
- Table 19: Global Power Strip Industry Revenue Million Forecast, by Application 2019 & 2032
- Table 20: Global Power Strip Industry Revenue Million Forecast, by End-User 2019 & 2032
- Table 21: Global Power Strip Industry Revenue Million Forecast, by Country 2019 & 2032
- Table 22: Global Power Strip Industry Revenue Million Forecast, by Installation Type (Qualitative Analysis) 2019 & 2032
- Table 23: Global Power Strip Industry Revenue Million Forecast, by Application 2019 & 2032
- Table 24: Global Power Strip Industry Revenue Million Forecast, by End-User 2019 & 2032
- Table 25: Global Power Strip Industry Revenue Million Forecast, by Country 2019 & 2032
- Table 26: Global Power Strip Industry Revenue Million Forecast, by Installation Type (Qualitative Analysis) 2019 & 2032
- Table 27: Global Power Strip Industry Revenue Million Forecast, by Application 2019 & 2032
- Table 28: Global Power Strip Industry Revenue Million Forecast, by End-User 2019 & 2032
- Table 29: Global Power Strip Industry Revenue Million Forecast, by Country 2019 & 2032
Frequently Asked Questions
1. What is the projected Compound Annual Growth Rate (CAGR) of the Power Strip Industry?
The projected CAGR is approximately 7.00%.
2. Which companies are prominent players in the Power Strip Industry?
Key companies in the market include ABB Ltd, Legrand SA, Belkin International Inc, Leviton Manufacturing Co Inc, Hubbell Incorporated, Tripp Lite (Eaton Corporation), Koninklijke Philips N V, Delixi Electric, Falconer Electronics Inc, Schneider Electric, Cyber Power Systems Inc , Panasonic Corporation.
3. What are the main segments of the Power Strip Industry?
The market segments include Installation Type (Qualitative Analysis), Application, End-User.
4. Can you provide details about the market size?
The market size is estimated to be USD XX Million as of 2022.
5. What are some drivers contributing to market growth?
Growing Demand for Steady Power Supply and Power Saving; Increasing Number of Electronics Devices in Residential Applications.
6. What are the notable trends driving market growth?
Increasing Number of Electronics Devices in Residential Applications.
7. Are there any restraints impacting market growth?
High Deployment and Operational Cost.
8. Can you provide examples of recent developments in the market?
June 2022 - Anker has introduced the 521 Power Strip, which can charge up to six devices simultaneously. According to the company, the device might be useful in a dorm or hotel room. Three AC outlets are positioned on the back of the 521 Power Strip, with two 12 W USB-A ports and a 30 W USB-C connector on the front of the device. The USB-C port supports high-speed charging. When all three USB ports are active, the power output is reduced to 10 W divided between the USB-A outlets and 20 W for the USB-C port. The ActiveShield technology monitors the device's temperature to prevent the power strip from overheating. The eight-point safety system also protects against overvoltage and surges, and LED lights on the device to indicate when the defense is in place.
9. What pricing options are available for accessing the report?
Pricing options include single-user, multi-user, and enterprise licenses priced at USD 4750, USD 5250, and USD 8750 respectively.
10. Is the market size provided in terms of value or volume?
The market size is provided in terms of value, measured in Million.
11. Are there any specific market keywords associated with the report?
Yes, the market keyword associated with the report is "Power Strip Industry," which aids in identifying and referencing the specific market segment covered.
12. How do I determine which pricing option suits my needs best?
The pricing options vary based on user requirements and access needs. Individual users may opt for single-user licenses, while businesses requiring broader access may choose multi-user or enterprise licenses for cost-effective access to the report.
13. Are there any additional resources or data provided in the Power Strip Industry report?
While the report offers comprehensive insights, it's advisable to review the specific contents or supplementary materials provided to ascertain if additional resources or data are available.
14. How can I stay updated on further developments or reports in the Power Strip Industry?
To stay informed about further developments, trends, and reports in the Power Strip Industry, consider subscribing to industry newsletters, following relevant companies and organizations, or regularly checking reputable industry news sources and publications.
Methodology
Step 1 - Identification of Relevant Samples Size from Population Database


Step 2 - Approaches for Defining Global Market Size (Value, Volume* & Price*)

Note*: In applicable scenarios
Step 3 - Data Sources
Primary Research
- Web Analytics
- Survey Reports
- Research Institute
- Latest Research Reports
- Opinion Leaders
Secondary Research
- Annual Reports
- White Paper
- Latest Press Release
- Industry Association
- Paid Database
- Investor Presentations

Step 4 - Data Triangulation
Involves using different sources of information in order to increase the validity of a study
These sources are likely to be stakeholders in a program - participants, other researchers, program staff, other community members, and so on.
Then we put all data in single framework & apply various statistical tools to find out the dynamic on the market.
During the analysis stage, feedback from the stakeholder groups would be compared to determine areas of agreement as well as areas of divergence


