
Key Insights
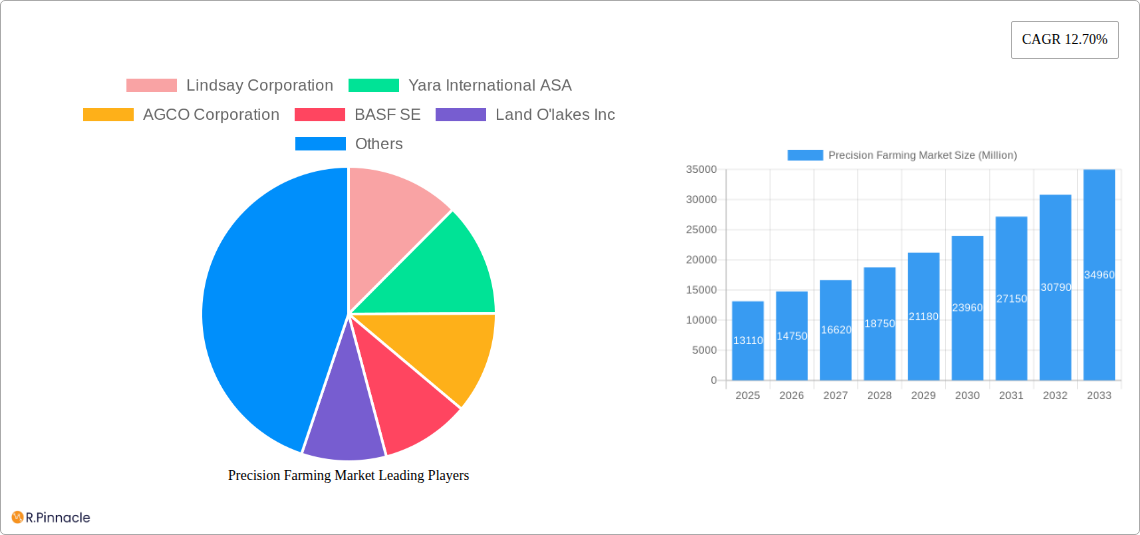
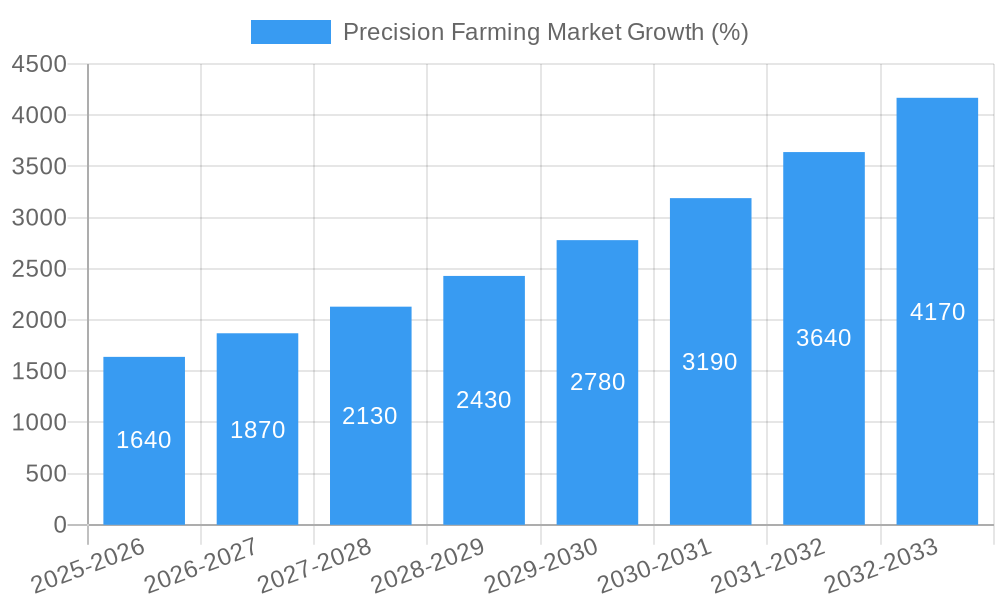
The precision farming market, valued at $13.11 billion in 2025, is projected to experience robust growth, driven by a Compound Annual Growth Rate (CAGR) of 12.70% from 2025 to 2033. This expansion is fueled by several key factors. Firstly, the increasing adoption of advanced technologies like drones, GPS guidance systems, and remote sensing for tasks such as yield monitoring, variable rate application of pesticides and fertilizers, and soil analysis is significantly enhancing farm efficiency and productivity. Secondly, the rising global demand for food, coupled with increasing pressure to optimize resource utilization and minimize environmental impact, is driving farmers towards precision agriculture solutions. Furthermore, government initiatives promoting sustainable agricultural practices and technological advancements in sensor technology, data analytics, and artificial intelligence are contributing to market growth. Competition among established players like John Deere, BASF, and Yara International, alongside the emergence of innovative technology providers, is fostering further market expansion.
However, the market also faces certain restraints. High initial investment costs associated with precision farming technologies can pose a barrier to entry for smallholder farmers in developing regions. Furthermore, the complexity of integrating various technologies and the need for skilled personnel to operate and maintain these systems present challenges. Data security and privacy concerns related to the large volumes of data generated by these systems also need careful consideration. Despite these challenges, the long-term outlook for the precision farming market remains positive, driven by continuous technological advancements, increasing farmer awareness, and supportive government policies. The market segmentation by technology (Guidance systems, GIS, variable-rate technology), application (yield monitoring, variable rate application, etc.), and component (hardware, software, services) allows for targeted strategies addressing diverse farmer needs. The geographical spread across North America, Europe, Asia-Pacific, and other regions reflects the global nature of this rapidly evolving market.
Precision Farming Market Report: A Comprehensive Analysis (2019-2033)
This in-depth report provides a comprehensive analysis of the Precision Farming market, offering actionable insights for industry professionals, investors, and stakeholders. With a study period spanning 2019-2033, a base year of 2025, and a forecast period of 2025-2033, this report leverages extensive data analysis to paint a clear picture of current market dynamics and future trends. The market is segmented by variable rate pesticide (drones and UAVs, other technologies), components (hardware, software, services), applications (yield monitoring, variable rate application, field mapping, soil monitoring, crop scouting, other applications), and technology (guidance system, GIS: remote sensing, variable-rate technology). The report reveals a market expected to be worth xx Million by 2033, driven by technological advancements and increasing demand for efficient farming practices.
Precision Farming Market Market Structure & Innovation Trends
The Precision Farming market exhibits a moderately concentrated structure, with key players like John Deere, AGCO Corporation, and BASF SE holding significant market share. However, the market is also witnessing increased competition from smaller, innovative companies specializing in niche technologies. The market share of the top 5 companies is estimated at xx%. Innovation is driven by the need for improved efficiency, reduced input costs, and enhanced sustainability in agriculture. Regulatory frameworks, such as those promoting sustainable agriculture practices, play a significant role in shaping market growth. Product substitutes include traditional farming methods, but their adoption is declining due to the demonstrated benefits of precision farming. End-user demographics primarily comprise large-scale commercial farms and increasingly smaller farms adopting precision technologies.
Several mergers and acquisitions (M&A) activities have recently taken place, indicating strong industry consolidation. Notable examples include:
- July 2023: Deere & Company's acquisition of Smart Apply Inc. for xx Million, significantly expanding their precision spraying solutions portfolio.
- Other M&A Activities: The total value of M&A deals in the precision farming sector in the historical period (2019-2024) is estimated to be xx Million.
Precision Farming Market Market Dynamics & Trends
The Precision Farming market is experiencing robust growth, with a projected Compound Annual Growth Rate (CAGR) of xx% during the forecast period (2025-2033). Key growth drivers include increasing demand for higher crop yields, rising concerns about resource efficiency (water and fertilizer), government initiatives promoting sustainable agriculture, and technological advancements such as improved sensors, data analytics, and AI-powered decision support systems. Market penetration of precision farming technologies varies across regions and farm sizes, with larger farms typically showing higher adoption rates. Consumer preferences are shifting towards data-driven decision-making and sustainable practices, fueling demand for precision farming solutions. Competitive dynamics are characterized by both fierce competition among established players and the emergence of innovative startups.
Dominant Regions & Segments in Precision Farming Market
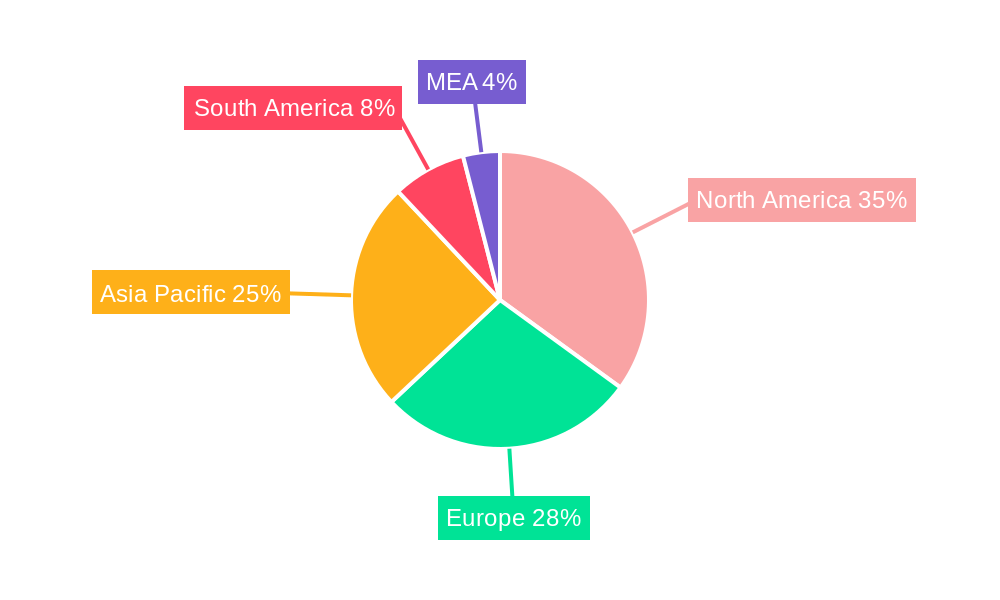
North America currently dominates the Precision Farming market, driven by high technology adoption rates and a well-established agricultural sector. Europe follows closely, with significant growth potential in developing regions like Asia-Pacific.
Key Drivers for Regional Dominance:
- North America: Strong agricultural infrastructure, high technology adoption, favorable government policies, and a large market size.
- Europe: High adoption rates in several countries, strong focus on sustainable agriculture, and increasing government support for precision farming technologies.
- Asia-Pacific: Rapid growth potential driven by rising agricultural output, increasing adoption of technology in farming, and governmental initiatives to promote modern farming techniques.
Leading Market Segments:
- By Application: Yield Monitoring holds the largest market share, followed by Variable Rate Application.
- By Component: Hardware constitutes the largest segment, reflecting the high investment in precision farming equipment.
- By Technology: Variable-rate technology is a leading segment due to its efficiency and effectiveness in optimizing resource use. Guidance systems also show high adoption.
- By Variable Rate Pesticide: Drones and UAVs are gaining traction due to increased automation and efficiency.
Precision Farming Market Product Innovations
Recent product innovations focus on integrating advanced technologies like AI, machine learning, and IoT to enhance data analysis, decision-making, and automation in farming operations. New products emphasize improved sensor accuracy, user-friendly interfaces, and seamless data integration across different platforms. This is leading to more effective variable-rate application of fertilizers and pesticides, optimized irrigation strategies, and improved crop yield predictions, contributing to a more sustainable and efficient agricultural sector. The market fit for these innovations is strong, aligning well with the growing demand for efficiency and sustainability in agriculture.
Report Scope & Segmentation Analysis
This report comprehensively analyzes the Precision Farming market across several key segments. Each segment shows significant growth potential, with varying market sizes and competitive dynamics.
Variable Rate Pesticide: The market is segmented into drones and UAVs, which are seeing significant growth due to their efficiency and precision, and other technologies, including ground-based systems.
By Component: Hardware, Software, and Services, each offering unique growth projections and market sizes influenced by technological advancements and adoption rates.
By Application: Yield Monitoring, Variable Rate Application, Field Mapping, Soil Monitoring, Crop Scouting, and Other Applications, each with specific drivers and growth projections.
By Technology: Guidance System, Global Information System (GIS): Remote Sensing, and Variable-rate Technology, highlighting technological advancements and market penetration.
Key Drivers of Precision Farming Market Growth
Several factors drive the growth of the Precision Farming market. Technological advancements in sensors, data analytics, and automation are key enablers. Economic factors like rising food demand and input costs push farmers to adopt efficiency-enhancing technologies. Regulatory frameworks supporting sustainable agriculture and precision farming practices provide further impetus. For instance, government subsidies and incentives for precision farming technologies encourage adoption.
Challenges in the Precision Farming Market Sector
Challenges include the high initial investment cost of precision farming technologies, which can be a barrier for small-scale farmers. Complex data management and analysis can also present difficulties. Supply chain disruptions and the availability of skilled labor remain concerns. Competitive pressures and the need for continuous innovation further challenge market players. These factors, combined, may slightly restrain the growth of the market and affect the projected values.
Emerging Opportunities in Precision Farming Market
Emerging opportunities include the increasing use of AI and machine learning for data analysis and predictive modeling. Expansion into new markets with significant agricultural potential also offers promising growth avenues. The development of integrated platforms combining multiple precision farming technologies promises to increase efficiency and market adoption. Further innovation in drone and sensor technologies will also propel market growth.
Leading Players in the Precision Farming Market Market
- Lindsay Corporation
- Yara International ASA
- AGCO Corporation
- BASF SE
- Land O'lakes Inc
- Topcon Precision Agriculture
- TeeJet Technologies
- John Deere
- DICKEY-john Corporation
- Raven Industries Inc
- Ag Junction Inc
Key Developments in Precision Farming Market Industry
- July 2023: Deere & Company's acquisition of Smart Apply Inc. strengthens their precision spraying solutions portfolio.
- May 2023: AgEagle Aerial Systems Inc. secures a 2-year supply agreement with Wingtra AG for RedEdge-P sensor kits, boosting drone-based precision farming capabilities.
- February 2023: Murata and Sentinum launch the GAIA soil monitoring solution, improving fertilizer and water usage efficiency.
Future Outlook for Precision Farming Market Market
The Precision Farming market is poised for sustained growth, driven by ongoing technological advancements, increasing demand for sustainable agriculture practices, and supportive government policies. Strategic partnerships and collaborations among industry players are expected to further accelerate market expansion. The continued development of innovative products and services tailored to the specific needs of farmers will be critical in realizing the market's full potential.
Precision Farming Market Segmentation
-
1. Technology
- 1.1. Guidance System
- 1.2. Remote Sensing
- 1.3. Variable-rate Technology
- 1.4. Drones and UAVs
- 1.5. Other Technologies
-
2. Component
- 2.1. Hardware
- 2.2. Software
- 2.3. Services
-
3. Application
- 3.1. Yield Monitoring
- 3.2. Variable Rate Application
- 3.3. Field Mapping
- 3.4. Soil Monitoring
- 3.5. Crop Scouting
- 3.6. Other Applications
Precision Farming Market Segmentation By Geography
-
1. North America
- 1.1. United States
- 1.2. Canada
-
2. Europe
- 2.1. Germany
- 2.2. United Kingdom
- 2.3. France
- 2.4. Rest of Europe
-
3. Asia Pacific
- 3.1. China
- 3.2. Japan
- 3.3. India
- 3.4. Australia
- 3.5. Rest of the Asia Pacific
- 4. Latin America
- 5. Middle East
Precision Farming Market REPORT HIGHLIGHTS
| Aspects | Details |
|---|---|
| Study Period | 2019-2033 |
| Base Year | 2024 |
| Estimated Year | 2025 |
| Forecast Period | 2025-2033 |
| Historical Period | 2019-2024 |
| Growth Rate | CAGR of 12.70% from 2019-2033 |
| Segmentation |
|
Table of Contents
- 1. Introduction
- 1.1. Research Scope
- 1.2. Market Segmentation
- 1.3. Research Methodology
- 1.4. Definitions and Assumptions
- 2. Executive Summary
- 2.1. Introduction
- 3. Market Dynamics
- 3.1. Introduction
- 3.2. Market Drivers
- 3.2.1. Soil Monitoring using AI and IOT technologies to drive the market; Emergence of New Technologies; Government Initiative and Increasing Number of Startups
- 3.3. Market Restrains
- 3.3.1. ; Relatively Low Awareness and Lack af Specialists Remain a Concern; High Initial Costs and Sluggish Penetration of Technology
- 3.4. Market Trends
- 3.4.1. Soil Monitoring is Expected to Hold Significant Share
- 4. Market Factor Analysis
- 4.1. Porters Five Forces
- 4.2. Supply/Value Chain
- 4.3. PESTEL analysis
- 4.4. Market Entropy
- 4.5. Patent/Trademark Analysis
- 5. Global Precision Farming Market Analysis, Insights and Forecast, 2019-2031
- 5.1. Market Analysis, Insights and Forecast - by Technology
- 5.1.1. Guidance System
- 5.1.2. Remote Sensing
- 5.1.3. Variable-rate Technology
- 5.1.4. Drones and UAVs
- 5.1.5. Other Technologies
- 5.2. Market Analysis, Insights and Forecast - by Component
- 5.2.1. Hardware
- 5.2.2. Software
- 5.2.3. Services
- 5.3. Market Analysis, Insights and Forecast - by Application
- 5.3.1. Yield Monitoring
- 5.3.2. Variable Rate Application
- 5.3.3. Field Mapping
- 5.3.4. Soil Monitoring
- 5.3.5. Crop Scouting
- 5.3.6. Other Applications
- 5.4. Market Analysis, Insights and Forecast - by Region
- 5.4.1. North America
- 5.4.2. Europe
- 5.4.3. Asia Pacific
- 5.4.4. Latin America
- 5.4.5. Middle East
- 5.1. Market Analysis, Insights and Forecast - by Technology
- 6. North America Precision Farming Market Analysis, Insights and Forecast, 2019-2031
- 6.1. Market Analysis, Insights and Forecast - by Technology
- 6.1.1. Guidance System
- 6.1.2. Remote Sensing
- 6.1.3. Variable-rate Technology
- 6.1.4. Drones and UAVs
- 6.1.5. Other Technologies
- 6.2. Market Analysis, Insights and Forecast - by Component
- 6.2.1. Hardware
- 6.2.2. Software
- 6.2.3. Services
- 6.3. Market Analysis, Insights and Forecast - by Application
- 6.3.1. Yield Monitoring
- 6.3.2. Variable Rate Application
- 6.3.3. Field Mapping
- 6.3.4. Soil Monitoring
- 6.3.5. Crop Scouting
- 6.3.6. Other Applications
- 6.1. Market Analysis, Insights and Forecast - by Technology
- 7. Europe Precision Farming Market Analysis, Insights and Forecast, 2019-2031
- 7.1. Market Analysis, Insights and Forecast - by Technology
- 7.1.1. Guidance System
- 7.1.2. Remote Sensing
- 7.1.3. Variable-rate Technology
- 7.1.4. Drones and UAVs
- 7.1.5. Other Technologies
- 7.2. Market Analysis, Insights and Forecast - by Component
- 7.2.1. Hardware
- 7.2.2. Software
- 7.2.3. Services
- 7.3. Market Analysis, Insights and Forecast - by Application
- 7.3.1. Yield Monitoring
- 7.3.2. Variable Rate Application
- 7.3.3. Field Mapping
- 7.3.4. Soil Monitoring
- 7.3.5. Crop Scouting
- 7.3.6. Other Applications
- 7.1. Market Analysis, Insights and Forecast - by Technology
- 8. Asia Pacific Precision Farming Market Analysis, Insights and Forecast, 2019-2031
- 8.1. Market Analysis, Insights and Forecast - by Technology
- 8.1.1. Guidance System
- 8.1.2. Remote Sensing
- 8.1.3. Variable-rate Technology
- 8.1.4. Drones and UAVs
- 8.1.5. Other Technologies
- 8.2. Market Analysis, Insights and Forecast - by Component
- 8.2.1. Hardware
- 8.2.2. Software
- 8.2.3. Services
- 8.3. Market Analysis, Insights and Forecast - by Application
- 8.3.1. Yield Monitoring
- 8.3.2. Variable Rate Application
- 8.3.3. Field Mapping
- 8.3.4. Soil Monitoring
- 8.3.5. Crop Scouting
- 8.3.6. Other Applications
- 8.1. Market Analysis, Insights and Forecast - by Technology
- 9. Latin America Precision Farming Market Analysis, Insights and Forecast, 2019-2031
- 9.1. Market Analysis, Insights and Forecast - by Technology
- 9.1.1. Guidance System
- 9.1.2. Remote Sensing
- 9.1.3. Variable-rate Technology
- 9.1.4. Drones and UAVs
- 9.1.5. Other Technologies
- 9.2. Market Analysis, Insights and Forecast - by Component
- 9.2.1. Hardware
- 9.2.2. Software
- 9.2.3. Services
- 9.3. Market Analysis, Insights and Forecast - by Application
- 9.3.1. Yield Monitoring
- 9.3.2. Variable Rate Application
- 9.3.3. Field Mapping
- 9.3.4. Soil Monitoring
- 9.3.5. Crop Scouting
- 9.3.6. Other Applications
- 9.1. Market Analysis, Insights and Forecast - by Technology
- 10. Middle East Precision Farming Market Analysis, Insights and Forecast, 2019-2031
- 10.1. Market Analysis, Insights and Forecast - by Technology
- 10.1.1. Guidance System
- 10.1.2. Remote Sensing
- 10.1.3. Variable-rate Technology
- 10.1.4. Drones and UAVs
- 10.1.5. Other Technologies
- 10.2. Market Analysis, Insights and Forecast - by Component
- 10.2.1. Hardware
- 10.2.2. Software
- 10.2.3. Services
- 10.3. Market Analysis, Insights and Forecast - by Application
- 10.3.1. Yield Monitoring
- 10.3.2. Variable Rate Application
- 10.3.3. Field Mapping
- 10.3.4. Soil Monitoring
- 10.3.5. Crop Scouting
- 10.3.6. Other Applications
- 10.1. Market Analysis, Insights and Forecast - by Technology
- 11. North America Precision Farming Market Analysis, Insights and Forecast, 2019-2031
- 11.1. Market Analysis, Insights and Forecast - By Country/Sub-region
- 11.1.1 United States
- 11.1.2 Canada
- 11.1.3 Mexico
- 12. Europe Precision Farming Market Analysis, Insights and Forecast, 2019-2031
- 12.1. Market Analysis, Insights and Forecast - By Country/Sub-region
- 12.1.1 Germany
- 12.1.2 United Kingdom
- 12.1.3 France
- 12.1.4 Spain
- 12.1.5 Italy
- 12.1.6 Spain
- 12.1.7 Belgium
- 12.1.8 Netherland
- 12.1.9 Nordics
- 12.1.10 Rest of Europe
- 13. Asia Pacific Precision Farming Market Analysis, Insights and Forecast, 2019-2031
- 13.1. Market Analysis, Insights and Forecast - By Country/Sub-region
- 13.1.1 China
- 13.1.2 Japan
- 13.1.3 India
- 13.1.4 South Korea
- 13.1.5 Southeast Asia
- 13.1.6 Australia
- 13.1.7 Indonesia
- 13.1.8 Phillipes
- 13.1.9 Singapore
- 13.1.10 Thailandc
- 13.1.11 Rest of Asia Pacific
- 14. South America Precision Farming Market Analysis, Insights and Forecast, 2019-2031
- 14.1. Market Analysis, Insights and Forecast - By Country/Sub-region
- 14.1.1 Brazil
- 14.1.2 Argentina
- 14.1.3 Peru
- 14.1.4 Chile
- 14.1.5 Colombia
- 14.1.6 Ecuador
- 14.1.7 Venezuela
- 14.1.8 Rest of South America
- 15. North America Precision Farming Market Analysis, Insights and Forecast, 2019-2031
- 15.1. Market Analysis, Insights and Forecast - By Country/Sub-region
- 15.1.1 United States
- 15.1.2 Canada
- 15.1.3 Mexico
- 16. MEA Precision Farming Market Analysis, Insights and Forecast, 2019-2031
- 16.1. Market Analysis, Insights and Forecast - By Country/Sub-region
- 16.1.1 United Arab Emirates
- 16.1.2 Saudi Arabia
- 16.1.3 South Africa
- 16.1.4 Rest of Middle East and Africa
- 17. Competitive Analysis
- 17.1. Global Market Share Analysis 2024
- 17.2. Company Profiles
- 17.2.1 Lindsay Corporation
- 17.2.1.1. Overview
- 17.2.1.2. Products
- 17.2.1.3. SWOT Analysis
- 17.2.1.4. Recent Developments
- 17.2.1.5. Financials (Based on Availability)
- 17.2.2 Yara International ASA
- 17.2.2.1. Overview
- 17.2.2.2. Products
- 17.2.2.3. SWOT Analysis
- 17.2.2.4. Recent Developments
- 17.2.2.5. Financials (Based on Availability)
- 17.2.3 AGCO Corporation
- 17.2.3.1. Overview
- 17.2.3.2. Products
- 17.2.3.3. SWOT Analysis
- 17.2.3.4. Recent Developments
- 17.2.3.5. Financials (Based on Availability)
- 17.2.4 BASF SE
- 17.2.4.1. Overview
- 17.2.4.2. Products
- 17.2.4.3. SWOT Analysis
- 17.2.4.4. Recent Developments
- 17.2.4.5. Financials (Based on Availability)
- 17.2.5 Land O'lakes Inc
- 17.2.5.1. Overview
- 17.2.5.2. Products
- 17.2.5.3. SWOT Analysis
- 17.2.5.4. Recent Developments
- 17.2.5.5. Financials (Based on Availability)
- 17.2.6 Topcon Precision Agriculture
- 17.2.6.1. Overview
- 17.2.6.2. Products
- 17.2.6.3. SWOT Analysis
- 17.2.6.4. Recent Developments
- 17.2.6.5. Financials (Based on Availability)
- 17.2.7 TeeJet Technologies
- 17.2.7.1. Overview
- 17.2.7.2. Products
- 17.2.7.3. SWOT Analysis
- 17.2.7.4. Recent Developments
- 17.2.7.5. Financials (Based on Availability)
- 17.2.8 John Deere
- 17.2.8.1. Overview
- 17.2.8.2. Products
- 17.2.8.3. SWOT Analysis
- 17.2.8.4. Recent Developments
- 17.2.8.5. Financials (Based on Availability)
- 17.2.9 DICKEY-john Corporation
- 17.2.9.1. Overview
- 17.2.9.2. Products
- 17.2.9.3. SWOT Analysis
- 17.2.9.4. Recent Developments
- 17.2.9.5. Financials (Based on Availability)
- 17.2.10 Raven Industries Inc
- 17.2.10.1. Overview
- 17.2.10.2. Products
- 17.2.10.3. SWOT Analysis
- 17.2.10.4. Recent Developments
- 17.2.10.5. Financials (Based on Availability)
- 17.2.11 Ag Junction Inc
- 17.2.11.1. Overview
- 17.2.11.2. Products
- 17.2.11.3. SWOT Analysis
- 17.2.11.4. Recent Developments
- 17.2.11.5. Financials (Based on Availability)
- 17.2.1 Lindsay Corporation
List of Figures
- Figure 1: Global Precision Farming Market Revenue Breakdown (Million, %) by Region 2024 & 2032
- Figure 2: Global Precision Farming Market Volume Breakdown (K Unit, %) by Region 2024 & 2032
- Figure 3: North America Precision Farming Market Revenue (Million), by Country 2024 & 2032
- Figure 4: North America Precision Farming Market Volume (K Unit), by Country 2024 & 2032
- Figure 5: North America Precision Farming Market Revenue Share (%), by Country 2024 & 2032
- Figure 6: North America Precision Farming Market Volume Share (%), by Country 2024 & 2032
- Figure 7: Europe Precision Farming Market Revenue (Million), by Country 2024 & 2032
- Figure 8: Europe Precision Farming Market Volume (K Unit), by Country 2024 & 2032
- Figure 9: Europe Precision Farming Market Revenue Share (%), by Country 2024 & 2032
- Figure 10: Europe Precision Farming Market Volume Share (%), by Country 2024 & 2032
- Figure 11: Asia Pacific Precision Farming Market Revenue (Million), by Country 2024 & 2032
- Figure 12: Asia Pacific Precision Farming Market Volume (K Unit), by Country 2024 & 2032
- Figure 13: Asia Pacific Precision Farming Market Revenue Share (%), by Country 2024 & 2032
- Figure 14: Asia Pacific Precision Farming Market Volume Share (%), by Country 2024 & 2032
- Figure 15: South America Precision Farming Market Revenue (Million), by Country 2024 & 2032
- Figure 16: South America Precision Farming Market Volume (K Unit), by Country 2024 & 2032
- Figure 17: South America Precision Farming Market Revenue Share (%), by Country 2024 & 2032
- Figure 18: South America Precision Farming Market Volume Share (%), by Country 2024 & 2032
- Figure 19: North America Precision Farming Market Revenue (Million), by Country 2024 & 2032
- Figure 20: North America Precision Farming Market Volume (K Unit), by Country 2024 & 2032
- Figure 21: North America Precision Farming Market Revenue Share (%), by Country 2024 & 2032
- Figure 22: North America Precision Farming Market Volume Share (%), by Country 2024 & 2032
- Figure 23: MEA Precision Farming Market Revenue (Million), by Country 2024 & 2032
- Figure 24: MEA Precision Farming Market Volume (K Unit), by Country 2024 & 2032
- Figure 25: MEA Precision Farming Market Revenue Share (%), by Country 2024 & 2032
- Figure 26: MEA Precision Farming Market Volume Share (%), by Country 2024 & 2032
- Figure 27: North America Precision Farming Market Revenue (Million), by Technology 2024 & 2032
- Figure 28: North America Precision Farming Market Volume (K Unit), by Technology 2024 & 2032
- Figure 29: North America Precision Farming Market Revenue Share (%), by Technology 2024 & 2032
- Figure 30: North America Precision Farming Market Volume Share (%), by Technology 2024 & 2032
- Figure 31: North America Precision Farming Market Revenue (Million), by Component 2024 & 2032
- Figure 32: North America Precision Farming Market Volume (K Unit), by Component 2024 & 2032
- Figure 33: North America Precision Farming Market Revenue Share (%), by Component 2024 & 2032
- Figure 34: North America Precision Farming Market Volume Share (%), by Component 2024 & 2032
- Figure 35: North America Precision Farming Market Revenue (Million), by Application 2024 & 2032
- Figure 36: North America Precision Farming Market Volume (K Unit), by Application 2024 & 2032
- Figure 37: North America Precision Farming Market Revenue Share (%), by Application 2024 & 2032
- Figure 38: North America Precision Farming Market Volume Share (%), by Application 2024 & 2032
- Figure 39: North America Precision Farming Market Revenue (Million), by Country 2024 & 2032
- Figure 40: North America Precision Farming Market Volume (K Unit), by Country 2024 & 2032
- Figure 41: North America Precision Farming Market Revenue Share (%), by Country 2024 & 2032
- Figure 42: North America Precision Farming Market Volume Share (%), by Country 2024 & 2032
- Figure 43: Europe Precision Farming Market Revenue (Million), by Technology 2024 & 2032
- Figure 44: Europe Precision Farming Market Volume (K Unit), by Technology 2024 & 2032
- Figure 45: Europe Precision Farming Market Revenue Share (%), by Technology 2024 & 2032
- Figure 46: Europe Precision Farming Market Volume Share (%), by Technology 2024 & 2032
- Figure 47: Europe Precision Farming Market Revenue (Million), by Component 2024 & 2032
- Figure 48: Europe Precision Farming Market Volume (K Unit), by Component 2024 & 2032
- Figure 49: Europe Precision Farming Market Revenue Share (%), by Component 2024 & 2032
- Figure 50: Europe Precision Farming Market Volume Share (%), by Component 2024 & 2032
- Figure 51: Europe Precision Farming Market Revenue (Million), by Application 2024 & 2032
- Figure 52: Europe Precision Farming Market Volume (K Unit), by Application 2024 & 2032
- Figure 53: Europe Precision Farming Market Revenue Share (%), by Application 2024 & 2032
- Figure 54: Europe Precision Farming Market Volume Share (%), by Application 2024 & 2032
- Figure 55: Europe Precision Farming Market Revenue (Million), by Country 2024 & 2032
- Figure 56: Europe Precision Farming Market Volume (K Unit), by Country 2024 & 2032
- Figure 57: Europe Precision Farming Market Revenue Share (%), by Country 2024 & 2032
- Figure 58: Europe Precision Farming Market Volume Share (%), by Country 2024 & 2032
- Figure 59: Asia Pacific Precision Farming Market Revenue (Million), by Technology 2024 & 2032
- Figure 60: Asia Pacific Precision Farming Market Volume (K Unit), by Technology 2024 & 2032
- Figure 61: Asia Pacific Precision Farming Market Revenue Share (%), by Technology 2024 & 2032
- Figure 62: Asia Pacific Precision Farming Market Volume Share (%), by Technology 2024 & 2032
- Figure 63: Asia Pacific Precision Farming Market Revenue (Million), by Component 2024 & 2032
- Figure 64: Asia Pacific Precision Farming Market Volume (K Unit), by Component 2024 & 2032
- Figure 65: Asia Pacific Precision Farming Market Revenue Share (%), by Component 2024 & 2032
- Figure 66: Asia Pacific Precision Farming Market Volume Share (%), by Component 2024 & 2032
- Figure 67: Asia Pacific Precision Farming Market Revenue (Million), by Application 2024 & 2032
- Figure 68: Asia Pacific Precision Farming Market Volume (K Unit), by Application 2024 & 2032
- Figure 69: Asia Pacific Precision Farming Market Revenue Share (%), by Application 2024 & 2032
- Figure 70: Asia Pacific Precision Farming Market Volume Share (%), by Application 2024 & 2032
- Figure 71: Asia Pacific Precision Farming Market Revenue (Million), by Country 2024 & 2032
- Figure 72: Asia Pacific Precision Farming Market Volume (K Unit), by Country 2024 & 2032
- Figure 73: Asia Pacific Precision Farming Market Revenue Share (%), by Country 2024 & 2032
- Figure 74: Asia Pacific Precision Farming Market Volume Share (%), by Country 2024 & 2032
- Figure 75: Latin America Precision Farming Market Revenue (Million), by Technology 2024 & 2032
- Figure 76: Latin America Precision Farming Market Volume (K Unit), by Technology 2024 & 2032
- Figure 77: Latin America Precision Farming Market Revenue Share (%), by Technology 2024 & 2032
- Figure 78: Latin America Precision Farming Market Volume Share (%), by Technology 2024 & 2032
- Figure 79: Latin America Precision Farming Market Revenue (Million), by Component 2024 & 2032
- Figure 80: Latin America Precision Farming Market Volume (K Unit), by Component 2024 & 2032
- Figure 81: Latin America Precision Farming Market Revenue Share (%), by Component 2024 & 2032
- Figure 82: Latin America Precision Farming Market Volume Share (%), by Component 2024 & 2032
- Figure 83: Latin America Precision Farming Market Revenue (Million), by Application 2024 & 2032
- Figure 84: Latin America Precision Farming Market Volume (K Unit), by Application 2024 & 2032
- Figure 85: Latin America Precision Farming Market Revenue Share (%), by Application 2024 & 2032
- Figure 86: Latin America Precision Farming Market Volume Share (%), by Application 2024 & 2032
- Figure 87: Latin America Precision Farming Market Revenue (Million), by Country 2024 & 2032
- Figure 88: Latin America Precision Farming Market Volume (K Unit), by Country 2024 & 2032
- Figure 89: Latin America Precision Farming Market Revenue Share (%), by Country 2024 & 2032
- Figure 90: Latin America Precision Farming Market Volume Share (%), by Country 2024 & 2032
- Figure 91: Middle East Precision Farming Market Revenue (Million), by Technology 2024 & 2032
- Figure 92: Middle East Precision Farming Market Volume (K Unit), by Technology 2024 & 2032
- Figure 93: Middle East Precision Farming Market Revenue Share (%), by Technology 2024 & 2032
- Figure 94: Middle East Precision Farming Market Volume Share (%), by Technology 2024 & 2032
- Figure 95: Middle East Precision Farming Market Revenue (Million), by Component 2024 & 2032
- Figure 96: Middle East Precision Farming Market Volume (K Unit), by Component 2024 & 2032
- Figure 97: Middle East Precision Farming Market Revenue Share (%), by Component 2024 & 2032
- Figure 98: Middle East Precision Farming Market Volume Share (%), by Component 2024 & 2032
- Figure 99: Middle East Precision Farming Market Revenue (Million), by Application 2024 & 2032
- Figure 100: Middle East Precision Farming Market Volume (K Unit), by Application 2024 & 2032
- Figure 101: Middle East Precision Farming Market Revenue Share (%), by Application 2024 & 2032
- Figure 102: Middle East Precision Farming Market Volume Share (%), by Application 2024 & 2032
- Figure 103: Middle East Precision Farming Market Revenue (Million), by Country 2024 & 2032
- Figure 104: Middle East Precision Farming Market Volume (K Unit), by Country 2024 & 2032
- Figure 105: Middle East Precision Farming Market Revenue Share (%), by Country 2024 & 2032
- Figure 106: Middle East Precision Farming Market Volume Share (%), by Country 2024 & 2032
List of Tables
- Table 1: Global Precision Farming Market Revenue Million Forecast, by Region 2019 & 2032
- Table 2: Global Precision Farming Market Volume K Unit Forecast, by Region 2019 & 2032
- Table 3: Global Precision Farming Market Revenue Million Forecast, by Technology 2019 & 2032
- Table 4: Global Precision Farming Market Volume K Unit Forecast, by Technology 2019 & 2032
- Table 5: Global Precision Farming Market Revenue Million Forecast, by Component 2019 & 2032
- Table 6: Global Precision Farming Market Volume K Unit Forecast, by Component 2019 & 2032
- Table 7: Global Precision Farming Market Revenue Million Forecast, by Application 2019 & 2032
- Table 8: Global Precision Farming Market Volume K Unit Forecast, by Application 2019 & 2032
- Table 9: Global Precision Farming Market Revenue Million Forecast, by Region 2019 & 2032
- Table 10: Global Precision Farming Market Volume K Unit Forecast, by Region 2019 & 2032
- Table 11: Global Precision Farming Market Revenue Million Forecast, by Country 2019 & 2032
- Table 12: Global Precision Farming Market Volume K Unit Forecast, by Country 2019 & 2032
- Table 13: United States Precision Farming Market Revenue (Million) Forecast, by Application 2019 & 2032
- Table 14: United States Precision Farming Market Volume (K Unit) Forecast, by Application 2019 & 2032
- Table 15: Canada Precision Farming Market Revenue (Million) Forecast, by Application 2019 & 2032
- Table 16: Canada Precision Farming Market Volume (K Unit) Forecast, by Application 2019 & 2032
- Table 17: Mexico Precision Farming Market Revenue (Million) Forecast, by Application 2019 & 2032
- Table 18: Mexico Precision Farming Market Volume (K Unit) Forecast, by Application 2019 & 2032
- Table 19: Global Precision Farming Market Revenue Million Forecast, by Country 2019 & 2032
- Table 20: Global Precision Farming Market Volume K Unit Forecast, by Country 2019 & 2032
- Table 21: Germany Precision Farming Market Revenue (Million) Forecast, by Application 2019 & 2032
- Table 22: Germany Precision Farming Market Volume (K Unit) Forecast, by Application 2019 & 2032
- Table 23: United Kingdom Precision Farming Market Revenue (Million) Forecast, by Application 2019 & 2032
- Table 24: United Kingdom Precision Farming Market Volume (K Unit) Forecast, by Application 2019 & 2032
- Table 25: France Precision Farming Market Revenue (Million) Forecast, by Application 2019 & 2032
- Table 26: France Precision Farming Market Volume (K Unit) Forecast, by Application 2019 & 2032
- Table 27: Spain Precision Farming Market Revenue (Million) Forecast, by Application 2019 & 2032
- Table 28: Spain Precision Farming Market Volume (K Unit) Forecast, by Application 2019 & 2032
- Table 29: Italy Precision Farming Market Revenue (Million) Forecast, by Application 2019 & 2032
- Table 30: Italy Precision Farming Market Volume (K Unit) Forecast, by Application 2019 & 2032
- Table 31: Spain Precision Farming Market Revenue (Million) Forecast, by Application 2019 & 2032
- Table 32: Spain Precision Farming Market Volume (K Unit) Forecast, by Application 2019 & 2032
- Table 33: Belgium Precision Farming Market Revenue (Million) Forecast, by Application 2019 & 2032
- Table 34: Belgium Precision Farming Market Volume (K Unit) Forecast, by Application 2019 & 2032
- Table 35: Netherland Precision Farming Market Revenue (Million) Forecast, by Application 2019 & 2032
- Table 36: Netherland Precision Farming Market Volume (K Unit) Forecast, by Application 2019 & 2032
- Table 37: Nordics Precision Farming Market Revenue (Million) Forecast, by Application 2019 & 2032
- Table 38: Nordics Precision Farming Market Volume (K Unit) Forecast, by Application 2019 & 2032
- Table 39: Rest of Europe Precision Farming Market Revenue (Million) Forecast, by Application 2019 & 2032
- Table 40: Rest of Europe Precision Farming Market Volume (K Unit) Forecast, by Application 2019 & 2032
- Table 41: Global Precision Farming Market Revenue Million Forecast, by Country 2019 & 2032
- Table 42: Global Precision Farming Market Volume K Unit Forecast, by Country 2019 & 2032
- Table 43: China Precision Farming Market Revenue (Million) Forecast, by Application 2019 & 2032
- Table 44: China Precision Farming Market Volume (K Unit) Forecast, by Application 2019 & 2032
- Table 45: Japan Precision Farming Market Revenue (Million) Forecast, by Application 2019 & 2032
- Table 46: Japan Precision Farming Market Volume (K Unit) Forecast, by Application 2019 & 2032
- Table 47: India Precision Farming Market Revenue (Million) Forecast, by Application 2019 & 2032
- Table 48: India Precision Farming Market Volume (K Unit) Forecast, by Application 2019 & 2032
- Table 49: South Korea Precision Farming Market Revenue (Million) Forecast, by Application 2019 & 2032
- Table 50: South Korea Precision Farming Market Volume (K Unit) Forecast, by Application 2019 & 2032
- Table 51: Southeast Asia Precision Farming Market Revenue (Million) Forecast, by Application 2019 & 2032
- Table 52: Southeast Asia Precision Farming Market Volume (K Unit) Forecast, by Application 2019 & 2032
- Table 53: Australia Precision Farming Market Revenue (Million) Forecast, by Application 2019 & 2032
- Table 54: Australia Precision Farming Market Volume (K Unit) Forecast, by Application 2019 & 2032
- Table 55: Indonesia Precision Farming Market Revenue (Million) Forecast, by Application 2019 & 2032
- Table 56: Indonesia Precision Farming Market Volume (K Unit) Forecast, by Application 2019 & 2032
- Table 57: Phillipes Precision Farming Market Revenue (Million) Forecast, by Application 2019 & 2032
- Table 58: Phillipes Precision Farming Market Volume (K Unit) Forecast, by Application 2019 & 2032
- Table 59: Singapore Precision Farming Market Revenue (Million) Forecast, by Application 2019 & 2032
- Table 60: Singapore Precision Farming Market Volume (K Unit) Forecast, by Application 2019 & 2032
- Table 61: Thailandc Precision Farming Market Revenue (Million) Forecast, by Application 2019 & 2032
- Table 62: Thailandc Precision Farming Market Volume (K Unit) Forecast, by Application 2019 & 2032
- Table 63: Rest of Asia Pacific Precision Farming Market Revenue (Million) Forecast, by Application 2019 & 2032
- Table 64: Rest of Asia Pacific Precision Farming Market Volume (K Unit) Forecast, by Application 2019 & 2032
- Table 65: Global Precision Farming Market Revenue Million Forecast, by Country 2019 & 2032
- Table 66: Global Precision Farming Market Volume K Unit Forecast, by Country 2019 & 2032
- Table 67: Brazil Precision Farming Market Revenue (Million) Forecast, by Application 2019 & 2032
- Table 68: Brazil Precision Farming Market Volume (K Unit) Forecast, by Application 2019 & 2032
- Table 69: Argentina Precision Farming Market Revenue (Million) Forecast, by Application 2019 & 2032
- Table 70: Argentina Precision Farming Market Volume (K Unit) Forecast, by Application 2019 & 2032
- Table 71: Peru Precision Farming Market Revenue (Million) Forecast, by Application 2019 & 2032
- Table 72: Peru Precision Farming Market Volume (K Unit) Forecast, by Application 2019 & 2032
- Table 73: Chile Precision Farming Market Revenue (Million) Forecast, by Application 2019 & 2032
- Table 74: Chile Precision Farming Market Volume (K Unit) Forecast, by Application 2019 & 2032
- Table 75: Colombia Precision Farming Market Revenue (Million) Forecast, by Application 2019 & 2032
- Table 76: Colombia Precision Farming Market Volume (K Unit) Forecast, by Application 2019 & 2032
- Table 77: Ecuador Precision Farming Market Revenue (Million) Forecast, by Application 2019 & 2032
- Table 78: Ecuador Precision Farming Market Volume (K Unit) Forecast, by Application 2019 & 2032
- Table 79: Venezuela Precision Farming Market Revenue (Million) Forecast, by Application 2019 & 2032
- Table 80: Venezuela Precision Farming Market Volume (K Unit) Forecast, by Application 2019 & 2032
- Table 81: Rest of South America Precision Farming Market Revenue (Million) Forecast, by Application 2019 & 2032
- Table 82: Rest of South America Precision Farming Market Volume (K Unit) Forecast, by Application 2019 & 2032
- Table 83: Global Precision Farming Market Revenue Million Forecast, by Country 2019 & 2032
- Table 84: Global Precision Farming Market Volume K Unit Forecast, by Country 2019 & 2032
- Table 85: United States Precision Farming Market Revenue (Million) Forecast, by Application 2019 & 2032
- Table 86: United States Precision Farming Market Volume (K Unit) Forecast, by Application 2019 & 2032
- Table 87: Canada Precision Farming Market Revenue (Million) Forecast, by Application 2019 & 2032
- Table 88: Canada Precision Farming Market Volume (K Unit) Forecast, by Application 2019 & 2032
- Table 89: Mexico Precision Farming Market Revenue (Million) Forecast, by Application 2019 & 2032
- Table 90: Mexico Precision Farming Market Volume (K Unit) Forecast, by Application 2019 & 2032
- Table 91: Global Precision Farming Market Revenue Million Forecast, by Country 2019 & 2032
- Table 92: Global Precision Farming Market Volume K Unit Forecast, by Country 2019 & 2032
- Table 93: United Arab Emirates Precision Farming Market Revenue (Million) Forecast, by Application 2019 & 2032
- Table 94: United Arab Emirates Precision Farming Market Volume (K Unit) Forecast, by Application 2019 & 2032
- Table 95: Saudi Arabia Precision Farming Market Revenue (Million) Forecast, by Application 2019 & 2032
- Table 96: Saudi Arabia Precision Farming Market Volume (K Unit) Forecast, by Application 2019 & 2032
- Table 97: South Africa Precision Farming Market Revenue (Million) Forecast, by Application 2019 & 2032
- Table 98: South Africa Precision Farming Market Volume (K Unit) Forecast, by Application 2019 & 2032
- Table 99: Rest of Middle East and Africa Precision Farming Market Revenue (Million) Forecast, by Application 2019 & 2032
- Table 100: Rest of Middle East and Africa Precision Farming Market Volume (K Unit) Forecast, by Application 2019 & 2032
- Table 101: Global Precision Farming Market Revenue Million Forecast, by Technology 2019 & 2032
- Table 102: Global Precision Farming Market Volume K Unit Forecast, by Technology 2019 & 2032
- Table 103: Global Precision Farming Market Revenue Million Forecast, by Component 2019 & 2032
- Table 104: Global Precision Farming Market Volume K Unit Forecast, by Component 2019 & 2032
- Table 105: Global Precision Farming Market Revenue Million Forecast, by Application 2019 & 2032
- Table 106: Global Precision Farming Market Volume K Unit Forecast, by Application 2019 & 2032
- Table 107: Global Precision Farming Market Revenue Million Forecast, by Country 2019 & 2032
- Table 108: Global Precision Farming Market Volume K Unit Forecast, by Country 2019 & 2032
- Table 109: United States Precision Farming Market Revenue (Million) Forecast, by Application 2019 & 2032
- Table 110: United States Precision Farming Market Volume (K Unit) Forecast, by Application 2019 & 2032
- Table 111: Canada Precision Farming Market Revenue (Million) Forecast, by Application 2019 & 2032
- Table 112: Canada Precision Farming Market Volume (K Unit) Forecast, by Application 2019 & 2032
- Table 113: Global Precision Farming Market Revenue Million Forecast, by Technology 2019 & 2032
- Table 114: Global Precision Farming Market Volume K Unit Forecast, by Technology 2019 & 2032
- Table 115: Global Precision Farming Market Revenue Million Forecast, by Component 2019 & 2032
- Table 116: Global Precision Farming Market Volume K Unit Forecast, by Component 2019 & 2032
- Table 117: Global Precision Farming Market Revenue Million Forecast, by Application 2019 & 2032
- Table 118: Global Precision Farming Market Volume K Unit Forecast, by Application 2019 & 2032
- Table 119: Global Precision Farming Market Revenue Million Forecast, by Country 2019 & 2032
- Table 120: Global Precision Farming Market Volume K Unit Forecast, by Country 2019 & 2032
- Table 121: Germany Precision Farming Market Revenue (Million) Forecast, by Application 2019 & 2032
- Table 122: Germany Precision Farming Market Volume (K Unit) Forecast, by Application 2019 & 2032
- Table 123: United Kingdom Precision Farming Market Revenue (Million) Forecast, by Application 2019 & 2032
- Table 124: United Kingdom Precision Farming Market Volume (K Unit) Forecast, by Application 2019 & 2032
- Table 125: France Precision Farming Market Revenue (Million) Forecast, by Application 2019 & 2032
- Table 126: France Precision Farming Market Volume (K Unit) Forecast, by Application 2019 & 2032
- Table 127: Rest of Europe Precision Farming Market Revenue (Million) Forecast, by Application 2019 & 2032
- Table 128: Rest of Europe Precision Farming Market Volume (K Unit) Forecast, by Application 2019 & 2032
- Table 129: Global Precision Farming Market Revenue Million Forecast, by Technology 2019 & 2032
- Table 130: Global Precision Farming Market Volume K Unit Forecast, by Technology 2019 & 2032
- Table 131: Global Precision Farming Market Revenue Million Forecast, by Component 2019 & 2032
- Table 132: Global Precision Farming Market Volume K Unit Forecast, by Component 2019 & 2032
- Table 133: Global Precision Farming Market Revenue Million Forecast, by Application 2019 & 2032
- Table 134: Global Precision Farming Market Volume K Unit Forecast, by Application 2019 & 2032
- Table 135: Global Precision Farming Market Revenue Million Forecast, by Country 2019 & 2032
- Table 136: Global Precision Farming Market Volume K Unit Forecast, by Country 2019 & 2032
- Table 137: China Precision Farming Market Revenue (Million) Forecast, by Application 2019 & 2032
- Table 138: China Precision Farming Market Volume (K Unit) Forecast, by Application 2019 & 2032
- Table 139: Japan Precision Farming Market Revenue (Million) Forecast, by Application 2019 & 2032
- Table 140: Japan Precision Farming Market Volume (K Unit) Forecast, by Application 2019 & 2032
- Table 141: India Precision Farming Market Revenue (Million) Forecast, by Application 2019 & 2032
- Table 142: India Precision Farming Market Volume (K Unit) Forecast, by Application 2019 & 2032
- Table 143: Australia Precision Farming Market Revenue (Million) Forecast, by Application 2019 & 2032
- Table 144: Australia Precision Farming Market Volume (K Unit) Forecast, by Application 2019 & 2032
- Table 145: Rest of the Asia Pacific Precision Farming Market Revenue (Million) Forecast, by Application 2019 & 2032
- Table 146: Rest of the Asia Pacific Precision Farming Market Volume (K Unit) Forecast, by Application 2019 & 2032
- Table 147: Global Precision Farming Market Revenue Million Forecast, by Technology 2019 & 2032
- Table 148: Global Precision Farming Market Volume K Unit Forecast, by Technology 2019 & 2032
- Table 149: Global Precision Farming Market Revenue Million Forecast, by Component 2019 & 2032
- Table 150: Global Precision Farming Market Volume K Unit Forecast, by Component 2019 & 2032
- Table 151: Global Precision Farming Market Revenue Million Forecast, by Application 2019 & 2032
- Table 152: Global Precision Farming Market Volume K Unit Forecast, by Application 2019 & 2032
- Table 153: Global Precision Farming Market Revenue Million Forecast, by Country 2019 & 2032
- Table 154: Global Precision Farming Market Volume K Unit Forecast, by Country 2019 & 2032
- Table 155: Global Precision Farming Market Revenue Million Forecast, by Technology 2019 & 2032
- Table 156: Global Precision Farming Market Volume K Unit Forecast, by Technology 2019 & 2032
- Table 157: Global Precision Farming Market Revenue Million Forecast, by Component 2019 & 2032
- Table 158: Global Precision Farming Market Volume K Unit Forecast, by Component 2019 & 2032
- Table 159: Global Precision Farming Market Revenue Million Forecast, by Application 2019 & 2032
- Table 160: Global Precision Farming Market Volume K Unit Forecast, by Application 2019 & 2032
- Table 161: Global Precision Farming Market Revenue Million Forecast, by Country 2019 & 2032
- Table 162: Global Precision Farming Market Volume K Unit Forecast, by Country 2019 & 2032
Frequently Asked Questions
1. What is the projected Compound Annual Growth Rate (CAGR) of the Precision Farming Market?
The projected CAGR is approximately 12.70%.
2. Which companies are prominent players in the Precision Farming Market?
Key companies in the market include Lindsay Corporation, Yara International ASA, AGCO Corporation, BASF SE, Land O'lakes Inc, Topcon Precision Agriculture, TeeJet Technologies, John Deere, DICKEY-john Corporation, Raven Industries Inc, Ag Junction Inc.
3. What are the main segments of the Precision Farming Market?
The market segments include Technology, Component, Application.
4. Can you provide details about the market size?
The market size is estimated to be USD 13.11 Million as of 2022.
5. What are some drivers contributing to market growth?
Soil Monitoring using AI and IOT technologies to drive the market; Emergence of New Technologies; Government Initiative and Increasing Number of Startups.
6. What are the notable trends driving market growth?
Soil Monitoring is Expected to Hold Significant Share.
7. Are there any restraints impacting market growth?
; Relatively Low Awareness and Lack af Specialists Remain a Concern; High Initial Costs and Sluggish Penetration of Technology.
8. Can you provide examples of recent developments in the market?
In July 2023, The acquisition of Smart Apply Inc., a provider of agricultural technology solutions, has been announced by Deere & Company, In order to assist farmers in dealing with the challenges of regulatory requirements, input costs, labour etc., Deere & Company is focusing on using Smart ApplyTM precision spraying solutions. The acquisition is intended to boost the company's new customer base.
9. What pricing options are available for accessing the report?
Pricing options include single-user, multi-user, and enterprise licenses priced at USD 4750, USD 5250, and USD 8750 respectively.
10. Is the market size provided in terms of value or volume?
The market size is provided in terms of value, measured in Million and volume, measured in K Unit.
11. Are there any specific market keywords associated with the report?
Yes, the market keyword associated with the report is "Precision Farming Market," which aids in identifying and referencing the specific market segment covered.
12. How do I determine which pricing option suits my needs best?
The pricing options vary based on user requirements and access needs. Individual users may opt for single-user licenses, while businesses requiring broader access may choose multi-user or enterprise licenses for cost-effective access to the report.
13. Are there any additional resources or data provided in the Precision Farming Market report?
While the report offers comprehensive insights, it's advisable to review the specific contents or supplementary materials provided to ascertain if additional resources or data are available.
14. How can I stay updated on further developments or reports in the Precision Farming Market?
To stay informed about further developments, trends, and reports in the Precision Farming Market, consider subscribing to industry newsletters, following relevant companies and organizations, or regularly checking reputable industry news sources and publications.
Methodology
Step 1 - Identification of Relevant Samples Size from Population Database


Step 2 - Approaches for Defining Global Market Size (Value, Volume* & Price*)

Note*: In applicable scenarios
Step 3 - Data Sources
Primary Research
- Web Analytics
- Survey Reports
- Research Institute
- Latest Research Reports
- Opinion Leaders
Secondary Research
- Annual Reports
- White Paper
- Latest Press Release
- Industry Association
- Paid Database
- Investor Presentations

Step 4 - Data Triangulation
Involves using different sources of information in order to increase the validity of a study
These sources are likely to be stakeholders in a program - participants, other researchers, program staff, other community members, and so on.
Then we put all data in single framework & apply various statistical tools to find out the dynamic on the market.
During the analysis stage, feedback from the stakeholder groups would be compared to determine areas of agreement as well as areas of divergence


