
Key Insights
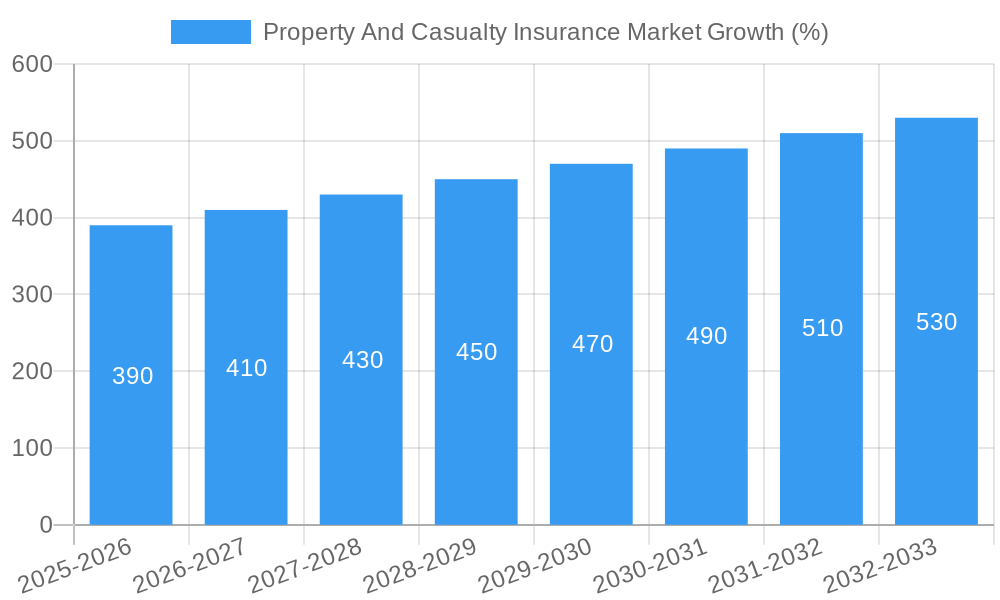
The Property and Casualty (P&C) insurance market, a cornerstone of the global financial system, exhibits robust growth potential. The market size, estimated at $7.36 billion in 2025, reflects a significant presence across diverse geographical regions. Analyzing the historical period (2019-2024) and considering a Compound Annual Growth Rate (CAGR) spanning the study period (2019-2033), the market demonstrates consistent expansion, driven by factors including increasing urbanization, rising asset values, and a growing awareness of risk mitigation strategies among individuals and businesses. The forecast period (2025-2033) anticipates continued growth, propelled by technological advancements in risk assessment and claims processing, the expansion of insurance-linked securities, and a growing demand for specialized insurance products catering to emerging risks such as cyber threats and climate change. Government regulations and economic fluctuations will undoubtedly influence market trajectory, however, the overall trend suggests a positive outlook for the P&C insurance sector.
Further growth is expected due to evolving customer preferences, with a shift toward digital platforms and personalized insurance solutions. This necessitates insurers to adopt advanced analytics, artificial intelligence, and machine learning to enhance customer experience, streamline operations, and detect fraudulent activities. The competitive landscape will also experience dynamic shifts, with mergers and acquisitions likely as companies strive for market share and expansion into new geographical territories. The successful players will be those who successfully navigate technological innovation, regulatory requirements, and changing consumer behaviors, ultimately offering comprehensive and affordable insurance solutions that meet evolving needs. This creates opportunities for both established players and new entrants to leverage innovative business models and tap into the considerable growth potential of this dynamic market.
Property & Casualty Insurance Market Report: 2019-2033
This comprehensive report provides a detailed analysis of the New Zealand Property & Casualty Insurance Market, offering invaluable insights for industry professionals, investors, and strategic planners. With a study period spanning 2019-2033, a base year of 2025, and a forecast period of 2025-2033, this report delivers a robust understanding of current market dynamics and future growth trajectories. The market is valued at xx Million in 2025 and is projected to reach xx Million by 2033.
Property And Casualty Insurance Market Structure & Innovation Trends
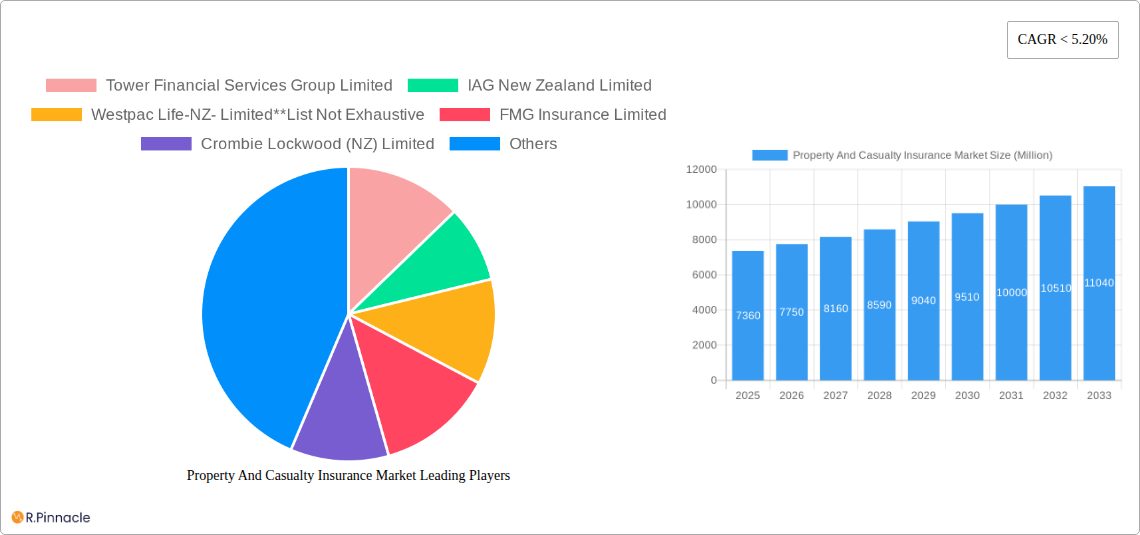
This section analyzes the competitive landscape, innovation drivers, and regulatory influences shaping the New Zealand Property & Casualty Insurance Market. We examine market concentration, revealing the market share held by key players like Tower Financial Services Group Limited, IAG New Zealand Limited, and FMG Insurance Limited. The report further delves into the impact of mergers and acquisitions (M&A) activity, including deal values and their implications for market consolidation. Innovation drivers such as technological advancements in risk assessment and claims processing are discussed, along with regulatory frameworks influencing product development and distribution. Analysis of product substitutes and end-user demographics completes the picture, providing a 360-degree view of the market structure. The estimated total M&A value within the reviewed period is xx Million.
- Market Concentration: Analysis of market share distribution among key players.
- Innovation Drivers: Examination of technological advancements and their impact.
- Regulatory Framework: Assessment of regulations impacting market operations.
- Product Substitutes: Analysis of alternative risk management solutions.
- End-User Demographics: Understanding the characteristics of policyholders.
- M&A Activity: Detailed analysis of significant mergers and acquisitions, including deal values.
Property And Casualty Insurance Market Dynamics & Trends
This section explores the key factors driving market growth, including changing consumer preferences, technological disruptions, and competitive dynamics. We analyze the Compound Annual Growth Rate (CAGR) and market penetration rates for different insurance segments. The impact of digitalization on customer engagement and operational efficiency is examined, alongside evolving consumer expectations for personalized insurance solutions. Competitive dynamics are analyzed, including pricing strategies, product differentiation, and market share battles among key players. The report also incorporates external factors such as economic conditions and evolving regulatory landscapes. Market growth is projected at a CAGR of xx% during the forecast period.
Dominant Regions & Segments in Property And Casualty Insurance Market
This section identifies the leading regions and segments within the New Zealand Property & Casualty Insurance Market. Dominance analysis will be conducted for both insurance types (Home, Motor, Other – marine, professional liability, etc.) and channels of distribution (Direct, Agency, Banks, Other – bancassurance, tied agents and branches).
Key Drivers:
- By Insurance Type:
- Home Insurance: Factors influencing growth in home insurance penetration.
- Motor Insurance: Trends impacting the motor insurance segment.
- Other Insurance Types: Analysis of specialized insurance lines.
- By Channel of Distribution:
- Direct: Analysis of online sales and digital marketing strategies.
- Agency: Assessment of the role of traditional insurance brokers.
- Banks: Evaluation of bancassurance channels.
- Other Channels: Analysis of alternative distribution methods.
Detailed paragraphs will provide in-depth analysis of the dominant regions and segments.
Property And Casualty Insurance Market Product Innovations
This section highlights recent product developments and technological trends impacting the market. We explore the competitive advantages offered by new products, focusing on features like personalized pricing, bundled services, and enhanced customer service. The integration of AI and big data analytics in risk assessment and claims management is also discussed, with an emphasis on market fit and consumer acceptance.
Report Scope & Segmentation Analysis
This report segments the New Zealand Property & Casualty Insurance Market by insurance type (Home, Motor, Other) and channel of distribution (Direct, Agency, Banks, Other). Each segment's growth projections, market size, and competitive dynamics are analyzed individually. Detailed market size figures for each segment are provided for the historical period (2019-2024), estimated year (2025), and forecast period (2025-2033).
Key Drivers of Property And Casualty Insurance Market Growth
Several factors are driving growth in the New Zealand Property & Casualty Insurance Market. Economic growth, increasing urbanization, and rising awareness of risk management are key factors. Technological advancements enabling personalized insurance solutions and efficient claims processing further fuel this growth. Government regulations mandating specific insurance coverage also contribute significantly.
Challenges in the Property And Casualty Insurance Market Sector
The New Zealand Property & Casualty Insurance Market faces several challenges. These include increasing regulatory scrutiny, intense competition among established and emerging players, and the need to adapt to evolving consumer expectations. Economic downturns and natural disasters pose additional risks. Maintaining profitability in the face of these pressures is a key challenge for insurers.
Emerging Opportunities in Property And Casualty Insurance Market
The market presents significant opportunities for growth and innovation. The expansion of digital channels, the adoption of InsurTech solutions, and the growing demand for specialized insurance products create promising avenues for market expansion and increased profitability. Targeting underserved market segments also presents considerable opportunities.
Leading Players in the Property And Casualty Insurance Market Market
- Tower Financial Services Group Limited
- IAG New Zealand Limited
- Westpac Life-NZ- Limited
- FMG Insurance Limited
- Crombie Lockwood (NZ) Limited
- AIA International Limited
- Zurich Financial Services Australia Limited
- AIG Insurance New Zealand Limited
- Allianz Australia Insurance Limited
- Aon New Zealand
Key Developments in Property And Casualty Insurance Market Industry
- September 2023: Howden New Zealand completed the acquisition of Apex Insurance New Zealand and its associated subsidiaries, expanding its market presence.
- July 2022: Chubb Life appointed Gail Costa to lead its newly acquired life insurance operations in New Zealand (previously held by Cigna).
Future Outlook for Property And Casualty Insurance Market Market
The New Zealand Property & Casualty Insurance Market is poised for continued growth, driven by economic expansion, technological innovation, and evolving consumer preferences. Strategic partnerships, product diversification, and expansion into new market segments will be key to success for insurers in the coming years. The market's positive outlook is further reinforced by the projected growth rate.
Property And Casualty Insurance Market Segmentation
-
1. Insurance type
- 1.1. Home
- 1.2. Motor
- 1.3. Other In
-
2. Channel of Distribution
- 2.1. Direct
- 2.2. Agency
- 2.3. Banks
- 2.4. Other ch
Property And Casualty Insurance Market Segmentation By Geography
-
1. North America
- 1.1. United States
- 1.2. Canada
- 1.3. Mexico
-
2. South America
- 2.1. Brazil
- 2.2. Argentina
- 2.3. Rest of South America
-
3. Europe
- 3.1. United Kingdom
- 3.2. Germany
- 3.3. France
- 3.4. Italy
- 3.5. Spain
- 3.6. Russia
- 3.7. Benelux
- 3.8. Nordics
- 3.9. Rest of Europe
-
4. Middle East & Africa
- 4.1. Turkey
- 4.2. Israel
- 4.3. GCC
- 4.4. North Africa
- 4.5. South Africa
- 4.6. Rest of Middle East & Africa
-
5. Asia Pacific
- 5.1. China
- 5.2. India
- 5.3. Japan
- 5.4. South Korea
- 5.5. ASEAN
- 5.6. Oceania
- 5.7. Rest of Asia Pacific
Property And Casualty Insurance Market REPORT HIGHLIGHTS
| Aspects | Details |
|---|---|
| Study Period | 2019-2033 |
| Base Year | 2024 |
| Estimated Year | 2025 |
| Forecast Period | 2025-2033 |
| Historical Period | 2019-2024 |
| Growth Rate | CAGR of < 5.20% from 2019-2033 |
| Segmentation |
|
Table of Contents
- 1. Introduction
- 1.1. Research Scope
- 1.2. Market Segmentation
- 1.3. Research Methodology
- 1.4. Definitions and Assumptions
- 2. Executive Summary
- 2.1. Introduction
- 3. Market Dynamics
- 3.1. Introduction
- 3.2. Market Drivers
- 3.2.1. Increasing Property Values is Driving the Market; Growing Awareness of the Need for Insurance Coverage
- 3.3. Market Restrains
- 3.3.1. Natural Disasters such as Earthquakes and Floods is Restraining the Market
- 3.4. Market Trends
- 3.4.1. Increase in New Residential Buildings
- 4. Market Factor Analysis
- 4.1. Porters Five Forces
- 4.2. Supply/Value Chain
- 4.3. PESTEL analysis
- 4.4. Market Entropy
- 4.5. Patent/Trademark Analysis
- 5. Global Property And Casualty Insurance Market Analysis, Insights and Forecast, 2019-2031
- 5.1. Market Analysis, Insights and Forecast - by Insurance type
- 5.1.1. Home
- 5.1.2. Motor
- 5.1.3. Other In
- 5.2. Market Analysis, Insights and Forecast - by Channel of Distribution
- 5.2.1. Direct
- 5.2.2. Agency
- 5.2.3. Banks
- 5.2.4. Other ch
- 5.3. Market Analysis, Insights and Forecast - by Region
- 5.3.1. North America
- 5.3.2. South America
- 5.3.3. Europe
- 5.3.4. Middle East & Africa
- 5.3.5. Asia Pacific
- 5.1. Market Analysis, Insights and Forecast - by Insurance type
- 6. North America Property And Casualty Insurance Market Analysis, Insights and Forecast, 2019-2031
- 6.1. Market Analysis, Insights and Forecast - by Insurance type
- 6.1.1. Home
- 6.1.2. Motor
- 6.1.3. Other In
- 6.2. Market Analysis, Insights and Forecast - by Channel of Distribution
- 6.2.1. Direct
- 6.2.2. Agency
- 6.2.3. Banks
- 6.2.4. Other ch
- 6.1. Market Analysis, Insights and Forecast - by Insurance type
- 7. South America Property And Casualty Insurance Market Analysis, Insights and Forecast, 2019-2031
- 7.1. Market Analysis, Insights and Forecast - by Insurance type
- 7.1.1. Home
- 7.1.2. Motor
- 7.1.3. Other In
- 7.2. Market Analysis, Insights and Forecast - by Channel of Distribution
- 7.2.1. Direct
- 7.2.2. Agency
- 7.2.3. Banks
- 7.2.4. Other ch
- 7.1. Market Analysis, Insights and Forecast - by Insurance type
- 8. Europe Property And Casualty Insurance Market Analysis, Insights and Forecast, 2019-2031
- 8.1. Market Analysis, Insights and Forecast - by Insurance type
- 8.1.1. Home
- 8.1.2. Motor
- 8.1.3. Other In
- 8.2. Market Analysis, Insights and Forecast - by Channel of Distribution
- 8.2.1. Direct
- 8.2.2. Agency
- 8.2.3. Banks
- 8.2.4. Other ch
- 8.1. Market Analysis, Insights and Forecast - by Insurance type
- 9. Middle East & Africa Property And Casualty Insurance Market Analysis, Insights and Forecast, 2019-2031
- 9.1. Market Analysis, Insights and Forecast - by Insurance type
- 9.1.1. Home
- 9.1.2. Motor
- 9.1.3. Other In
- 9.2. Market Analysis, Insights and Forecast - by Channel of Distribution
- 9.2.1. Direct
- 9.2.2. Agency
- 9.2.3. Banks
- 9.2.4. Other ch
- 9.1. Market Analysis, Insights and Forecast - by Insurance type
- 10. Asia Pacific Property And Casualty Insurance Market Analysis, Insights and Forecast, 2019-2031
- 10.1. Market Analysis, Insights and Forecast - by Insurance type
- 10.1.1. Home
- 10.1.2. Motor
- 10.1.3. Other In
- 10.2. Market Analysis, Insights and Forecast - by Channel of Distribution
- 10.2.1. Direct
- 10.2.2. Agency
- 10.2.3. Banks
- 10.2.4. Other ch
- 10.1. Market Analysis, Insights and Forecast - by Insurance type
- 11. North America Property And Casualty Insurance Market Analysis, Insights and Forecast, 2019-2031
- 11.1. Market Analysis, Insights and Forecast - By Country/Sub-region
- 11.1.1 United States
- 11.1.2 Canada
- 11.1.3 Mexico
- 12. South America Property And Casualty Insurance Market Analysis, Insights and Forecast, 2019-2031
- 12.1. Market Analysis, Insights and Forecast - By Country/Sub-region
- 12.1.1 Brazil
- 12.1.2 Argentina
- 12.1.3 Rest of South America
- 13. Europe Property And Casualty Insurance Market Analysis, Insights and Forecast, 2019-2031
- 13.1. Market Analysis, Insights and Forecast - By Country/Sub-region
- 13.1.1 Germany
- 13.1.2 France
- 13.1.3 Italy
- 13.1.4 United Kingdom
- 13.1.5 Netherlands
- 13.1.6 Rest of Europe
- 14. Asia Pacific Property And Casualty Insurance Market Analysis, Insights and Forecast, 2019-2031
- 14.1. Market Analysis, Insights and Forecast - By Country/Sub-region
- 14.1.1 China
- 14.1.2 Japan
- 14.1.3 India
- 14.1.4 South Korea
- 14.1.5 Taiwan
- 14.1.6 Australia
- 14.1.7 Rest of Asia-Pacific
- 15. Middle East & Africa Property And Casualty Insurance Market Analysis, Insights and Forecast, 2019-2031
- 15.1. Market Analysis, Insights and Forecast - By Country/Sub-region
- 15.1.1 UAE
- 15.1.2 South Africa
- 15.1.3 Saudi Arabia
- 15.1.4 Rest of MEA
- 16. Competitive Analysis
- 16.1. Global Market Share Analysis 2024
- 16.2. Company Profiles
- 16.2.1 Tower Financial Services Group Limited
- 16.2.1.1. Overview
- 16.2.1.2. Products
- 16.2.1.3. SWOT Analysis
- 16.2.1.4. Recent Developments
- 16.2.1.5. Financials (Based on Availability)
- 16.2.2 IAG New Zealand Limited
- 16.2.2.1. Overview
- 16.2.2.2. Products
- 16.2.2.3. SWOT Analysis
- 16.2.2.4. Recent Developments
- 16.2.2.5. Financials (Based on Availability)
- 16.2.3 Westpac Life-NZ- Limited**List Not Exhaustive
- 16.2.3.1. Overview
- 16.2.3.2. Products
- 16.2.3.3. SWOT Analysis
- 16.2.3.4. Recent Developments
- 16.2.3.5. Financials (Based on Availability)
- 16.2.4 FMG Insurance Limited
- 16.2.4.1. Overview
- 16.2.4.2. Products
- 16.2.4.3. SWOT Analysis
- 16.2.4.4. Recent Developments
- 16.2.4.5. Financials (Based on Availability)
- 16.2.5 Crombie Lockwood (NZ) Limited
- 16.2.5.1. Overview
- 16.2.5.2. Products
- 16.2.5.3. SWOT Analysis
- 16.2.5.4. Recent Developments
- 16.2.5.5. Financials (Based on Availability)
- 16.2.6 AIA International Limited
- 16.2.6.1. Overview
- 16.2.6.2. Products
- 16.2.6.3. SWOT Analysis
- 16.2.6.4. Recent Developments
- 16.2.6.5. Financials (Based on Availability)
- 16.2.7 Zurich Financial Services Australia Limited
- 16.2.7.1. Overview
- 16.2.7.2. Products
- 16.2.7.3. SWOT Analysis
- 16.2.7.4. Recent Developments
- 16.2.7.5. Financials (Based on Availability)
- 16.2.8 Aig Insurance New Zealand Limited
- 16.2.8.1. Overview
- 16.2.8.2. Products
- 16.2.8.3. SWOT Analysis
- 16.2.8.4. Recent Developments
- 16.2.8.5. Financials (Based on Availability)
- 16.2.9 Allianz Australia Insurance Limited
- 16.2.9.1. Overview
- 16.2.9.2. Products
- 16.2.9.3. SWOT Analysis
- 16.2.9.4. Recent Developments
- 16.2.9.5. Financials (Based on Availability)
- 16.2.10 Aon New Zealand
- 16.2.10.1. Overview
- 16.2.10.2. Products
- 16.2.10.3. SWOT Analysis
- 16.2.10.4. Recent Developments
- 16.2.10.5. Financials (Based on Availability)
- 16.2.1 Tower Financial Services Group Limited
List of Figures
- Figure 1: Global Property And Casualty Insurance Market Revenue Breakdown (Million, %) by Region 2024 & 2032
- Figure 2: North America Property And Casualty Insurance Market Revenue (Million), by Country 2024 & 2032
- Figure 3: North America Property And Casualty Insurance Market Revenue Share (%), by Country 2024 & 2032
- Figure 4: South America Property And Casualty Insurance Market Revenue (Million), by Country 2024 & 2032
- Figure 5: South America Property And Casualty Insurance Market Revenue Share (%), by Country 2024 & 2032
- Figure 6: Europe Property And Casualty Insurance Market Revenue (Million), by Country 2024 & 2032
- Figure 7: Europe Property And Casualty Insurance Market Revenue Share (%), by Country 2024 & 2032
- Figure 8: Asia Pacific Property And Casualty Insurance Market Revenue (Million), by Country 2024 & 2032
- Figure 9: Asia Pacific Property And Casualty Insurance Market Revenue Share (%), by Country 2024 & 2032
- Figure 10: Middle East & Africa Property And Casualty Insurance Market Revenue (Million), by Country 2024 & 2032
- Figure 11: Middle East & Africa Property And Casualty Insurance Market Revenue Share (%), by Country 2024 & 2032
- Figure 12: North America Property And Casualty Insurance Market Revenue (Million), by Insurance type 2024 & 2032
- Figure 13: North America Property And Casualty Insurance Market Revenue Share (%), by Insurance type 2024 & 2032
- Figure 14: North America Property And Casualty Insurance Market Revenue (Million), by Channel of Distribution 2024 & 2032
- Figure 15: North America Property And Casualty Insurance Market Revenue Share (%), by Channel of Distribution 2024 & 2032
- Figure 16: North America Property And Casualty Insurance Market Revenue (Million), by Country 2024 & 2032
- Figure 17: North America Property And Casualty Insurance Market Revenue Share (%), by Country 2024 & 2032
- Figure 18: South America Property And Casualty Insurance Market Revenue (Million), by Insurance type 2024 & 2032
- Figure 19: South America Property And Casualty Insurance Market Revenue Share (%), by Insurance type 2024 & 2032
- Figure 20: South America Property And Casualty Insurance Market Revenue (Million), by Channel of Distribution 2024 & 2032
- Figure 21: South America Property And Casualty Insurance Market Revenue Share (%), by Channel of Distribution 2024 & 2032
- Figure 22: South America Property And Casualty Insurance Market Revenue (Million), by Country 2024 & 2032
- Figure 23: South America Property And Casualty Insurance Market Revenue Share (%), by Country 2024 & 2032
- Figure 24: Europe Property And Casualty Insurance Market Revenue (Million), by Insurance type 2024 & 2032
- Figure 25: Europe Property And Casualty Insurance Market Revenue Share (%), by Insurance type 2024 & 2032
- Figure 26: Europe Property And Casualty Insurance Market Revenue (Million), by Channel of Distribution 2024 & 2032
- Figure 27: Europe Property And Casualty Insurance Market Revenue Share (%), by Channel of Distribution 2024 & 2032
- Figure 28: Europe Property And Casualty Insurance Market Revenue (Million), by Country 2024 & 2032
- Figure 29: Europe Property And Casualty Insurance Market Revenue Share (%), by Country 2024 & 2032
- Figure 30: Middle East & Africa Property And Casualty Insurance Market Revenue (Million), by Insurance type 2024 & 2032
- Figure 31: Middle East & Africa Property And Casualty Insurance Market Revenue Share (%), by Insurance type 2024 & 2032
- Figure 32: Middle East & Africa Property And Casualty Insurance Market Revenue (Million), by Channel of Distribution 2024 & 2032
- Figure 33: Middle East & Africa Property And Casualty Insurance Market Revenue Share (%), by Channel of Distribution 2024 & 2032
- Figure 34: Middle East & Africa Property And Casualty Insurance Market Revenue (Million), by Country 2024 & 2032
- Figure 35: Middle East & Africa Property And Casualty Insurance Market Revenue Share (%), by Country 2024 & 2032
- Figure 36: Asia Pacific Property And Casualty Insurance Market Revenue (Million), by Insurance type 2024 & 2032
- Figure 37: Asia Pacific Property And Casualty Insurance Market Revenue Share (%), by Insurance type 2024 & 2032
- Figure 38: Asia Pacific Property And Casualty Insurance Market Revenue (Million), by Channel of Distribution 2024 & 2032
- Figure 39: Asia Pacific Property And Casualty Insurance Market Revenue Share (%), by Channel of Distribution 2024 & 2032
- Figure 40: Asia Pacific Property And Casualty Insurance Market Revenue (Million), by Country 2024 & 2032
- Figure 41: Asia Pacific Property And Casualty Insurance Market Revenue Share (%), by Country 2024 & 2032
List of Tables
- Table 1: Global Property And Casualty Insurance Market Revenue Million Forecast, by Region 2019 & 2032
- Table 2: Global Property And Casualty Insurance Market Revenue Million Forecast, by Insurance type 2019 & 2032
- Table 3: Global Property And Casualty Insurance Market Revenue Million Forecast, by Channel of Distribution 2019 & 2032
- Table 4: Global Property And Casualty Insurance Market Revenue Million Forecast, by Region 2019 & 2032
- Table 5: Global Property And Casualty Insurance Market Revenue Million Forecast, by Country 2019 & 2032
- Table 6: United States Property And Casualty Insurance Market Revenue (Million) Forecast, by Application 2019 & 2032
- Table 7: Canada Property And Casualty Insurance Market Revenue (Million) Forecast, by Application 2019 & 2032
- Table 8: Mexico Property And Casualty Insurance Market Revenue (Million) Forecast, by Application 2019 & 2032
- Table 9: Global Property And Casualty Insurance Market Revenue Million Forecast, by Country 2019 & 2032
- Table 10: Brazil Property And Casualty Insurance Market Revenue (Million) Forecast, by Application 2019 & 2032
- Table 11: Argentina Property And Casualty Insurance Market Revenue (Million) Forecast, by Application 2019 & 2032
- Table 12: Rest of South America Property And Casualty Insurance Market Revenue (Million) Forecast, by Application 2019 & 2032
- Table 13: Global Property And Casualty Insurance Market Revenue Million Forecast, by Country 2019 & 2032
- Table 14: Germany Property And Casualty Insurance Market Revenue (Million) Forecast, by Application 2019 & 2032
- Table 15: France Property And Casualty Insurance Market Revenue (Million) Forecast, by Application 2019 & 2032
- Table 16: Italy Property And Casualty Insurance Market Revenue (Million) Forecast, by Application 2019 & 2032
- Table 17: United Kingdom Property And Casualty Insurance Market Revenue (Million) Forecast, by Application 2019 & 2032
- Table 18: Netherlands Property And Casualty Insurance Market Revenue (Million) Forecast, by Application 2019 & 2032
- Table 19: Rest of Europe Property And Casualty Insurance Market Revenue (Million) Forecast, by Application 2019 & 2032
- Table 20: Global Property And Casualty Insurance Market Revenue Million Forecast, by Country 2019 & 2032
- Table 21: China Property And Casualty Insurance Market Revenue (Million) Forecast, by Application 2019 & 2032
- Table 22: Japan Property And Casualty Insurance Market Revenue (Million) Forecast, by Application 2019 & 2032
- Table 23: India Property And Casualty Insurance Market Revenue (Million) Forecast, by Application 2019 & 2032
- Table 24: South Korea Property And Casualty Insurance Market Revenue (Million) Forecast, by Application 2019 & 2032
- Table 25: Taiwan Property And Casualty Insurance Market Revenue (Million) Forecast, by Application 2019 & 2032
- Table 26: Australia Property And Casualty Insurance Market Revenue (Million) Forecast, by Application 2019 & 2032
- Table 27: Rest of Asia-Pacific Property And Casualty Insurance Market Revenue (Million) Forecast, by Application 2019 & 2032
- Table 28: Global Property And Casualty Insurance Market Revenue Million Forecast, by Country 2019 & 2032
- Table 29: UAE Property And Casualty Insurance Market Revenue (Million) Forecast, by Application 2019 & 2032
- Table 30: South Africa Property And Casualty Insurance Market Revenue (Million) Forecast, by Application 2019 & 2032
- Table 31: Saudi Arabia Property And Casualty Insurance Market Revenue (Million) Forecast, by Application 2019 & 2032
- Table 32: Rest of MEA Property And Casualty Insurance Market Revenue (Million) Forecast, by Application 2019 & 2032
- Table 33: Global Property And Casualty Insurance Market Revenue Million Forecast, by Insurance type 2019 & 2032
- Table 34: Global Property And Casualty Insurance Market Revenue Million Forecast, by Channel of Distribution 2019 & 2032
- Table 35: Global Property And Casualty Insurance Market Revenue Million Forecast, by Country 2019 & 2032
- Table 36: United States Property And Casualty Insurance Market Revenue (Million) Forecast, by Application 2019 & 2032
- Table 37: Canada Property And Casualty Insurance Market Revenue (Million) Forecast, by Application 2019 & 2032
- Table 38: Mexico Property And Casualty Insurance Market Revenue (Million) Forecast, by Application 2019 & 2032
- Table 39: Global Property And Casualty Insurance Market Revenue Million Forecast, by Insurance type 2019 & 2032
- Table 40: Global Property And Casualty Insurance Market Revenue Million Forecast, by Channel of Distribution 2019 & 2032
- Table 41: Global Property And Casualty Insurance Market Revenue Million Forecast, by Country 2019 & 2032
- Table 42: Brazil Property And Casualty Insurance Market Revenue (Million) Forecast, by Application 2019 & 2032
- Table 43: Argentina Property And Casualty Insurance Market Revenue (Million) Forecast, by Application 2019 & 2032
- Table 44: Rest of South America Property And Casualty Insurance Market Revenue (Million) Forecast, by Application 2019 & 2032
- Table 45: Global Property And Casualty Insurance Market Revenue Million Forecast, by Insurance type 2019 & 2032
- Table 46: Global Property And Casualty Insurance Market Revenue Million Forecast, by Channel of Distribution 2019 & 2032
- Table 47: Global Property And Casualty Insurance Market Revenue Million Forecast, by Country 2019 & 2032
- Table 48: United Kingdom Property And Casualty Insurance Market Revenue (Million) Forecast, by Application 2019 & 2032
- Table 49: Germany Property And Casualty Insurance Market Revenue (Million) Forecast, by Application 2019 & 2032
- Table 50: France Property And Casualty Insurance Market Revenue (Million) Forecast, by Application 2019 & 2032
- Table 51: Italy Property And Casualty Insurance Market Revenue (Million) Forecast, by Application 2019 & 2032
- Table 52: Spain Property And Casualty Insurance Market Revenue (Million) Forecast, by Application 2019 & 2032
- Table 53: Russia Property And Casualty Insurance Market Revenue (Million) Forecast, by Application 2019 & 2032
- Table 54: Benelux Property And Casualty Insurance Market Revenue (Million) Forecast, by Application 2019 & 2032
- Table 55: Nordics Property And Casualty Insurance Market Revenue (Million) Forecast, by Application 2019 & 2032
- Table 56: Rest of Europe Property And Casualty Insurance Market Revenue (Million) Forecast, by Application 2019 & 2032
- Table 57: Global Property And Casualty Insurance Market Revenue Million Forecast, by Insurance type 2019 & 2032
- Table 58: Global Property And Casualty Insurance Market Revenue Million Forecast, by Channel of Distribution 2019 & 2032
- Table 59: Global Property And Casualty Insurance Market Revenue Million Forecast, by Country 2019 & 2032
- Table 60: Turkey Property And Casualty Insurance Market Revenue (Million) Forecast, by Application 2019 & 2032
- Table 61: Israel Property And Casualty Insurance Market Revenue (Million) Forecast, by Application 2019 & 2032
- Table 62: GCC Property And Casualty Insurance Market Revenue (Million) Forecast, by Application 2019 & 2032
- Table 63: North Africa Property And Casualty Insurance Market Revenue (Million) Forecast, by Application 2019 & 2032
- Table 64: South Africa Property And Casualty Insurance Market Revenue (Million) Forecast, by Application 2019 & 2032
- Table 65: Rest of Middle East & Africa Property And Casualty Insurance Market Revenue (Million) Forecast, by Application 2019 & 2032
- Table 66: Global Property And Casualty Insurance Market Revenue Million Forecast, by Insurance type 2019 & 2032
- Table 67: Global Property And Casualty Insurance Market Revenue Million Forecast, by Channel of Distribution 2019 & 2032
- Table 68: Global Property And Casualty Insurance Market Revenue Million Forecast, by Country 2019 & 2032
- Table 69: China Property And Casualty Insurance Market Revenue (Million) Forecast, by Application 2019 & 2032
- Table 70: India Property And Casualty Insurance Market Revenue (Million) Forecast, by Application 2019 & 2032
- Table 71: Japan Property And Casualty Insurance Market Revenue (Million) Forecast, by Application 2019 & 2032
- Table 72: South Korea Property And Casualty Insurance Market Revenue (Million) Forecast, by Application 2019 & 2032
- Table 73: ASEAN Property And Casualty Insurance Market Revenue (Million) Forecast, by Application 2019 & 2032
- Table 74: Oceania Property And Casualty Insurance Market Revenue (Million) Forecast, by Application 2019 & 2032
- Table 75: Rest of Asia Pacific Property And Casualty Insurance Market Revenue (Million) Forecast, by Application 2019 & 2032
Frequently Asked Questions
1. What is the projected Compound Annual Growth Rate (CAGR) of the Property And Casualty Insurance Market?
The projected CAGR is approximately < 5.20%.
2. Which companies are prominent players in the Property And Casualty Insurance Market?
Key companies in the market include Tower Financial Services Group Limited, IAG New Zealand Limited, Westpac Life-NZ- Limited**List Not Exhaustive, FMG Insurance Limited, Crombie Lockwood (NZ) Limited, AIA International Limited, Zurich Financial Services Australia Limited, Aig Insurance New Zealand Limited, Allianz Australia Insurance Limited, Aon New Zealand.
3. What are the main segments of the Property And Casualty Insurance Market?
The market segments include Insurance type, Channel of Distribution.
4. Can you provide details about the market size?
The market size is estimated to be USD 7.36 Million as of 2022.
5. What are some drivers contributing to market growth?
Increasing Property Values is Driving the Market; Growing Awareness of the Need for Insurance Coverage.
6. What are the notable trends driving market growth?
Increase in New Residential Buildings.
7. Are there any restraints impacting market growth?
Natural Disasters such as Earthquakes and Floods is Restraining the Market.
8. Can you provide examples of recent developments in the market?
September 2023: Howden New Zealand, a global insurance group, expanded its presence in New Zealand. They recently completed the acquisition of Apex Insurance New Zealand and its associated subsidiaries.
9. What pricing options are available for accessing the report?
Pricing options include single-user, multi-user, and enterprise licenses priced at USD 3800, USD 4500, and USD 5800 respectively.
10. Is the market size provided in terms of value or volume?
The market size is provided in terms of value, measured in Million.
11. Are there any specific market keywords associated with the report?
Yes, the market keyword associated with the report is "Property And Casualty Insurance Market," which aids in identifying and referencing the specific market segment covered.
12. How do I determine which pricing option suits my needs best?
The pricing options vary based on user requirements and access needs. Individual users may opt for single-user licenses, while businesses requiring broader access may choose multi-user or enterprise licenses for cost-effective access to the report.
13. Are there any additional resources or data provided in the Property And Casualty Insurance Market report?
While the report offers comprehensive insights, it's advisable to review the specific contents or supplementary materials provided to ascertain if additional resources or data are available.
14. How can I stay updated on further developments or reports in the Property And Casualty Insurance Market?
To stay informed about further developments, trends, and reports in the Property And Casualty Insurance Market, consider subscribing to industry newsletters, following relevant companies and organizations, or regularly checking reputable industry news sources and publications.
Methodology
Step 1 - Identification of Relevant Samples Size from Population Database


Step 2 - Approaches for Defining Global Market Size (Value, Volume* & Price*)

Note*: In applicable scenarios
Step 3 - Data Sources
Primary Research
- Web Analytics
- Survey Reports
- Research Institute
- Latest Research Reports
- Opinion Leaders
Secondary Research
- Annual Reports
- White Paper
- Latest Press Release
- Industry Association
- Paid Database
- Investor Presentations

Step 4 - Data Triangulation
Involves using different sources of information in order to increase the validity of a study
These sources are likely to be stakeholders in a program - participants, other researchers, program staff, other community members, and so on.
Then we put all data in single framework & apply various statistical tools to find out the dynamic on the market.
During the analysis stage, feedback from the stakeholder groups would be compared to determine areas of agreement as well as areas of divergence


