
Key Insights
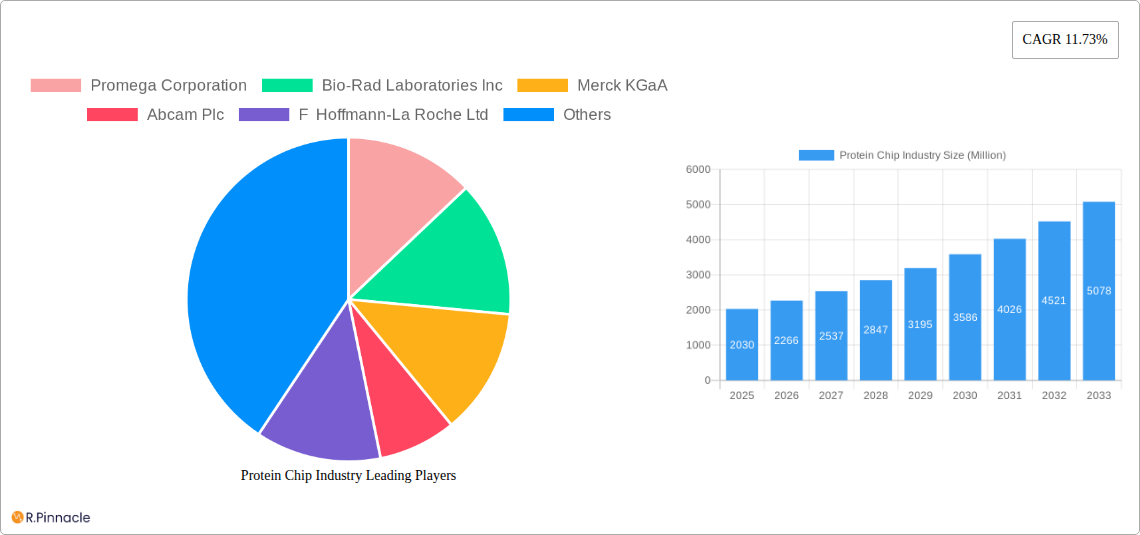
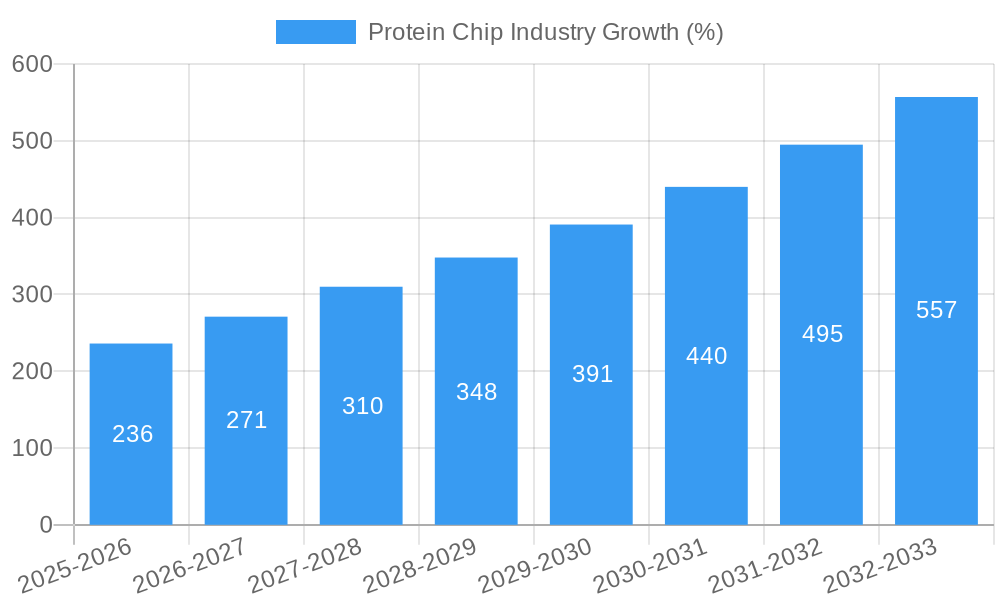
The global protein chip market, valued at $2.03 billion in 2025, is projected to experience robust growth, driven by the increasing prevalence of chronic diseases necessitating advanced diagnostics and the expanding pharmaceutical and biotechnology industries demanding efficient drug discovery tools. The market's Compound Annual Growth Rate (CAGR) of 11.73% from 2019 to 2024 indicates a significant upward trajectory, expected to continue throughout the forecast period (2025-2033). Key drivers include the rising demand for high-throughput screening in drug development, the increasing adoption of personalized medicine requiring precise protein analysis, and advancements in technology leading to more sensitive and accurate protein chip platforms. Growth is further fueled by government initiatives promoting research and development in life sciences and the expanding availability of skilled professionals in related fields. While challenges exist, such as high initial investment costs for equipment and the complexity of assay development, these are offset by the significant advantages protein chips offer over traditional methods in terms of speed, cost-effectiveness, and miniaturization.
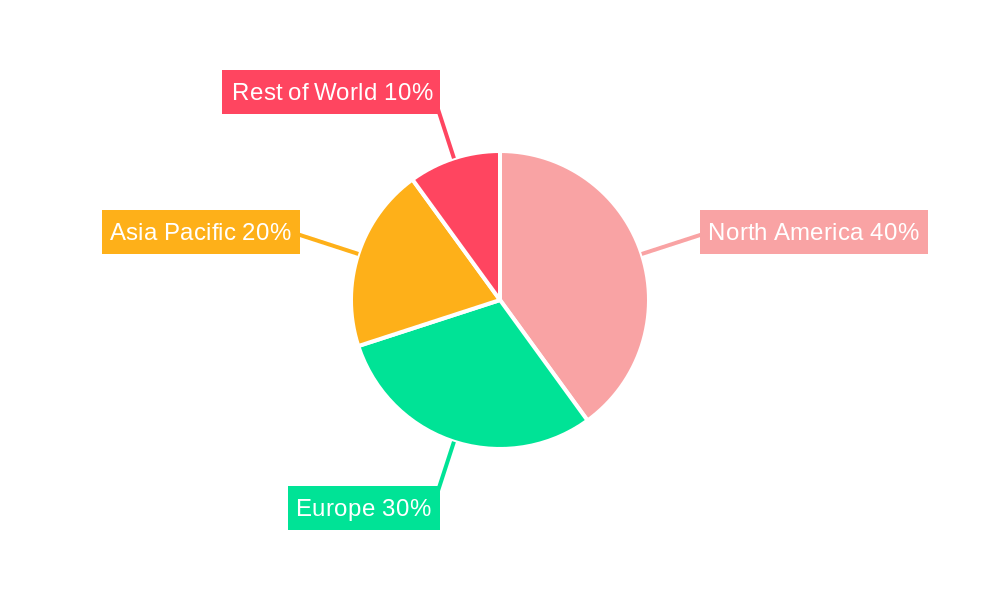
Market segmentation reveals that kits and reagents currently constitute the largest revenue share, reflecting the high demand for consumables in protein chip applications. The drug discovery and development segment is the leading application area, followed by disease diagnosis. Pharmaceutical and biotechnology companies dominate the end-user segment due to their extensive research and development activities. Geographically, North America holds a substantial market share, attributable to well-established research infrastructure, high healthcare expenditure, and a robust presence of major players. However, the Asia-Pacific region is expected to exhibit significant growth owing to rising investments in healthcare infrastructure and an expanding biopharmaceutical industry, particularly in China and India. The European market, despite being mature, is anticipated to continue showing steady growth due to increasing research initiatives and advancements in healthcare technology. The overall market outlook for protein chips remains exceptionally positive, with substantial growth potential throughout the forecast period driven by technological innovation and the increasing importance of proteomics research.
Protein Chip Industry Market Report: 2019-2033
This comprehensive report provides a detailed analysis of the Protein Chip industry, offering invaluable insights for industry professionals, investors, and researchers. Covering the period 2019-2033, with a focus on 2025, this report dissects market dynamics, competitive landscapes, and future growth potential. The report leverages extensive data analysis and expert insights to provide actionable strategies for success in this rapidly evolving market.
Protein Chip Industry Market Structure & Innovation Trends
This section analyzes the competitive landscape of the Protein Chip market, examining market concentration, innovation drivers, regulatory influences, and market dynamics. The report assesses the market share of key players like Promega Corporation, Bio-Rad Laboratories Inc, Merck KGaA, Abcam Plc, F Hoffmann-La Roche Ltd, Cell Signaling Technology Inc, Danaher Corporation, Qiagen, PerkinElmer Inc, and Thermo Fisher Scientific. It also explores the impact of mergers and acquisitions (M&A) activities, evaluating deal values and their influence on market consolidation. The xx% market share held by the top 5 players indicates a moderately consolidated market. Innovation is driven by advancements in proteomics and the need for high-throughput screening in drug discovery. Stringent regulatory frameworks for medical devices and diagnostic tools influence product development and market entry. The report analyzes substitute technologies and their potential impact, along with end-user demographics, providing a 360-degree view of the market structure. M&A activity in the last five years totaled approximately USD xx Billion, indicating significant consolidation efforts within the industry.
Protein Chip Industry Market Dynamics & Trends
This section delves into the key factors shaping the Protein Chip market's growth trajectory. We analyze the compound annual growth rate (CAGR) and market penetration rates across different segments, identifying prominent growth drivers. These include the increasing prevalence of chronic diseases, escalating demand for personalized medicine, and rapid advancements in proteomics research. The report explores technological disruptions, such as the integration of AI and machine learning in protein chip analysis, and how these are reshaping market dynamics. Consumer preferences, specifically towards faster, more accurate, and cost-effective diagnostic tools, are examined. Finally, the report analyzes the competitive landscape, detailing the strategies employed by leading players to maintain their market share and the overall intensity of competition within the industry. The projected CAGR for the forecast period (2025-2033) is estimated to be xx%.
Dominant Regions & Segments in Protein Chip Industry
This section identifies the leading regions, countries, and segments within the Protein Chip market. The analysis considers market size and growth potential across various segments:
- By Product Type: Kits, Reagents, Instruments & Accessories. The Kits segment is currently dominant, driven by ease of use and pre-packaged solutions.
- By Application: Drug Discovery and Development, Disease Diagnosis, Other Applications. Drug Discovery and Development holds a significant market share, fueled by the rising demand for targeted therapies.
- By End User: Pharmaceutical and Biotechnology Industries, Hospitals and Clinics, Other End Users. The Pharmaceutical and Biotechnology Industries segment dominates due to substantial R&D investments.
The North American region currently holds the largest market share, driven by robust R&D infrastructure and strong regulatory support. Key drivers for regional dominance include:
- North America: High healthcare expenditure, strong presence of key players, and advanced research facilities.
- Europe: Growing adoption of advanced diagnostics, increasing government funding for research, and stringent regulatory compliance.
- Asia Pacific: Rapidly growing healthcare sector, expanding research infrastructure, and increasing prevalence of chronic diseases.
Protein Chip Industry Product Innovations
Recent innovations in protein chip technology are focused on improving sensitivity, throughput, and multiplexing capabilities. Miniaturization and automation are key trends, aimed at reducing cost and improving efficiency. This includes integration with advanced analytical techniques like mass spectrometry and development of novel chip materials to enhance performance. These advancements are broadening applications across various fields, leading to enhanced diagnostic accuracy and accelerated drug discovery processes.
Report Scope & Segmentation Analysis
This report covers the global Protein Chip market, segmented by product type (Kits, Reagents, Instruments & Accessories), application (Drug Discovery and Development, Disease Diagnosis, Other Applications), and end-user (Pharmaceutical and Biotechnology Industries, Hospitals and Clinics, Other End Users). Each segment's market size, growth projections, and competitive dynamics are analyzed. The global market is projected to reach USD xx Million by 2033. Growth in each segment varies depending on technological advancements and regulatory approvals.
Key Drivers of Protein Chip Industry Growth
Growth in the Protein Chip industry is propelled by several factors: the increasing prevalence of chronic diseases necessitating advanced diagnostics; rising R&D spending by pharmaceutical and biotechnology companies; advancements in proteomics research leading to innovative applications; and government initiatives supporting healthcare infrastructure and technological development. The development and adoption of novel protein chip designs and improved analytical capabilities further fuel market expansion.
Challenges in the Protein Chip Industry Sector
The Protein Chip industry faces challenges including high initial investment costs associated with technology development and implementation, complex regulatory approvals, and competition from alternative diagnostic techniques. Supply chain disruptions and the need for skilled professionals to operate and interpret data from these systems also pose obstacles to growth. The market faces an estimated xx% loss annually due to supply chain issues.
Emerging Opportunities in Protein Chip Industry
Emerging opportunities include the integration of protein chip technology with point-of-care diagnostics, personalized medicine initiatives, and the development of new chip designs for early disease detection. Expanding applications in veterinary diagnostics and environmental monitoring also present promising avenues for growth. There is a significant opportunity to capitalize on the rising demand for rapid diagnostic tests for infectious diseases.
Leading Players in the Protein Chip Industry Market
- Promega Corporation
- Bio-Rad Laboratories Inc
- Merck KGaA
- Abcam Plc
- F Hoffmann-La Roche Ltd
- Cell Signaling Technology Inc
- Danaher Corporation
- Qiagen
- PerkinElmer Inc
- Thermo Fisher Scientific
Key Developments in Protein Chip Industry
- March 2022: Biognosys launched an expanded suite of proteomics platforms, enhancing pharmaceutical and diagnostics capabilities.
- January 2022: Amgen partnered with Generate Biomedicines, investing USD 1.9 Billion+ in protein therapeutic discovery.
Future Outlook for Protein Chip Industry Market
The Protein Chip market exhibits strong growth potential, driven by continuous technological advancements, expanding applications, and increasing demand for high-throughput screening methods. Strategic partnerships, collaborations, and M&A activities will shape the industry landscape. The integration of AI and Big Data analytics will further enhance the capabilities of protein chips, opening up new frontiers in disease diagnosis and drug discovery, promising a significant market expansion in the coming years.
Protein Chip Industry Segmentation
-
1. Product Type
- 1.1. Kits
- 1.2. Reagents
- 1.3. Instruments and Accessories
-
2. Application
- 2.1. Drug Discovery and Development
- 2.2. Disease Diagnosis
- 2.3. Other Applications
-
3. End User
- 3.1. Pharmaceutical and Biotechnology Industries
- 3.2. Hospitals and Clinics
- 3.3. Other End Users
Protein Chip Industry Segmentation By Geography
-
1. North America
- 1.1. United States
- 1.2. Canada
- 1.3. Mexico
-
2. Europe
- 2.1. Germany
- 2.2. United Kingdom
- 2.3. France
- 2.4. Italy
- 2.5. Spain
- 2.6. Rest of Europe
-
3. Asia Pacific
- 3.1. China
- 3.2. Japan
- 3.3. India
- 3.4. Australia
- 3.5. South Korea
- 3.6. Rest of Asia Pacific
-
4. Middle East and Africa
- 4.1. GCC
- 4.2. South Africa
- 4.3. Rest of Middle East and Africa
-
5. South America
- 5.1. Brazil
- 5.2. Argentina
- 5.3. Rest of South America
Protein Chip Industry REPORT HIGHLIGHTS
| Aspects | Details |
|---|---|
| Study Period | 2019-2033 |
| Base Year | 2024 |
| Estimated Year | 2025 |
| Forecast Period | 2025-2033 |
| Historical Period | 2019-2024 |
| Growth Rate | CAGR of 11.73% from 2019-2033 |
| Segmentation |
|
Table of Contents
- 1. Introduction
- 1.1. Research Scope
- 1.2. Market Segmentation
- 1.3. Research Methodology
- 1.4. Definitions and Assumptions
- 2. Executive Summary
- 2.1. Introduction
- 3. Market Dynamics
- 3.1. Introduction
- 3.2. Market Drivers
- 3.2.1. Increasing Incidence of Chronic and Infectious Diseases; Technological Advancements in Protein Assay Techniques; Increasing Expenditure on Pharmaceutical and Biological Research and Development
- 3.3. Market Restrains
- 3.3.1. High Cost of Multiplex Assay Equipment
- 3.4. Market Trends
- 3.4.1. Drug Discovery and Development Segment is Expected to Hold a Significant Share in the Protein Assay Market during the Forecast Period of the Study
- 4. Market Factor Analysis
- 4.1. Porters Five Forces
- 4.2. Supply/Value Chain
- 4.3. PESTEL analysis
- 4.4. Market Entropy
- 4.5. Patent/Trademark Analysis
- 5. Global Protein Chip Industry Analysis, Insights and Forecast, 2019-2031
- 5.1. Market Analysis, Insights and Forecast - by Product Type
- 5.1.1. Kits
- 5.1.2. Reagents
- 5.1.3. Instruments and Accessories
- 5.2. Market Analysis, Insights and Forecast - by Application
- 5.2.1. Drug Discovery and Development
- 5.2.2. Disease Diagnosis
- 5.2.3. Other Applications
- 5.3. Market Analysis, Insights and Forecast - by End User
- 5.3.1. Pharmaceutical and Biotechnology Industries
- 5.3.2. Hospitals and Clinics
- 5.3.3. Other End Users
- 5.4. Market Analysis, Insights and Forecast - by Region
- 5.4.1. North America
- 5.4.2. Europe
- 5.4.3. Asia Pacific
- 5.4.4. Middle East and Africa
- 5.4.5. South America
- 5.1. Market Analysis, Insights and Forecast - by Product Type
- 6. North America Protein Chip Industry Analysis, Insights and Forecast, 2019-2031
- 6.1. Market Analysis, Insights and Forecast - by Product Type
- 6.1.1. Kits
- 6.1.2. Reagents
- 6.1.3. Instruments and Accessories
- 6.2. Market Analysis, Insights and Forecast - by Application
- 6.2.1. Drug Discovery and Development
- 6.2.2. Disease Diagnosis
- 6.2.3. Other Applications
- 6.3. Market Analysis, Insights and Forecast - by End User
- 6.3.1. Pharmaceutical and Biotechnology Industries
- 6.3.2. Hospitals and Clinics
- 6.3.3. Other End Users
- 6.1. Market Analysis, Insights and Forecast - by Product Type
- 7. Europe Protein Chip Industry Analysis, Insights and Forecast, 2019-2031
- 7.1. Market Analysis, Insights and Forecast - by Product Type
- 7.1.1. Kits
- 7.1.2. Reagents
- 7.1.3. Instruments and Accessories
- 7.2. Market Analysis, Insights and Forecast - by Application
- 7.2.1. Drug Discovery and Development
- 7.2.2. Disease Diagnosis
- 7.2.3. Other Applications
- 7.3. Market Analysis, Insights and Forecast - by End User
- 7.3.1. Pharmaceutical and Biotechnology Industries
- 7.3.2. Hospitals and Clinics
- 7.3.3. Other End Users
- 7.1. Market Analysis, Insights and Forecast - by Product Type
- 8. Asia Pacific Protein Chip Industry Analysis, Insights and Forecast, 2019-2031
- 8.1. Market Analysis, Insights and Forecast - by Product Type
- 8.1.1. Kits
- 8.1.2. Reagents
- 8.1.3. Instruments and Accessories
- 8.2. Market Analysis, Insights and Forecast - by Application
- 8.2.1. Drug Discovery and Development
- 8.2.2. Disease Diagnosis
- 8.2.3. Other Applications
- 8.3. Market Analysis, Insights and Forecast - by End User
- 8.3.1. Pharmaceutical and Biotechnology Industries
- 8.3.2. Hospitals and Clinics
- 8.3.3. Other End Users
- 8.1. Market Analysis, Insights and Forecast - by Product Type
- 9. Middle East and Africa Protein Chip Industry Analysis, Insights and Forecast, 2019-2031
- 9.1. Market Analysis, Insights and Forecast - by Product Type
- 9.1.1. Kits
- 9.1.2. Reagents
- 9.1.3. Instruments and Accessories
- 9.2. Market Analysis, Insights and Forecast - by Application
- 9.2.1. Drug Discovery and Development
- 9.2.2. Disease Diagnosis
- 9.2.3. Other Applications
- 9.3. Market Analysis, Insights and Forecast - by End User
- 9.3.1. Pharmaceutical and Biotechnology Industries
- 9.3.2. Hospitals and Clinics
- 9.3.3. Other End Users
- 9.1. Market Analysis, Insights and Forecast - by Product Type
- 10. South America Protein Chip Industry Analysis, Insights and Forecast, 2019-2031
- 10.1. Market Analysis, Insights and Forecast - by Product Type
- 10.1.1. Kits
- 10.1.2. Reagents
- 10.1.3. Instruments and Accessories
- 10.2. Market Analysis, Insights and Forecast - by Application
- 10.2.1. Drug Discovery and Development
- 10.2.2. Disease Diagnosis
- 10.2.3. Other Applications
- 10.3. Market Analysis, Insights and Forecast - by End User
- 10.3.1. Pharmaceutical and Biotechnology Industries
- 10.3.2. Hospitals and Clinics
- 10.3.3. Other End Users
- 10.1. Market Analysis, Insights and Forecast - by Product Type
- 11. North America Protein Chip Industry Analysis, Insights and Forecast, 2019-2031
- 11.1. Market Analysis, Insights and Forecast - By Country/Sub-region
- 11.1.1 United States
- 11.1.2 Canada
- 11.1.3 Mexico
- 12. Europe Protein Chip Industry Analysis, Insights and Forecast, 2019-2031
- 12.1. Market Analysis, Insights and Forecast - By Country/Sub-region
- 12.1.1 Germany
- 12.1.2 United Kingdom
- 12.1.3 France
- 12.1.4 Italy
- 12.1.5 Spain
- 12.1.6 Rest of Europe
- 13. Asia Pacific Protein Chip Industry Analysis, Insights and Forecast, 2019-2031
- 13.1. Market Analysis, Insights and Forecast - By Country/Sub-region
- 13.1.1 China
- 13.1.2 Japan
- 13.1.3 India
- 13.1.4 Australia
- 13.1.5 South Korea
- 13.1.6 Rest of Asia Pacific
- 14. Middle East and Africa Protein Chip Industry Analysis, Insights and Forecast, 2019-2031
- 14.1. Market Analysis, Insights and Forecast - By Country/Sub-region
- 14.1.1 GCC
- 14.1.2 South Africa
- 14.1.3 Rest of Middle East and Africa
- 15. South America Protein Chip Industry Analysis, Insights and Forecast, 2019-2031
- 15.1. Market Analysis, Insights and Forecast - By Country/Sub-region
- 15.1.1 Brazil
- 15.1.2 Argentina
- 15.1.3 Rest of South America
- 16. Competitive Analysis
- 16.1. Global Market Share Analysis 2024
- 16.2. Company Profiles
- 16.2.1 Promega Corporation
- 16.2.1.1. Overview
- 16.2.1.2. Products
- 16.2.1.3. SWOT Analysis
- 16.2.1.4. Recent Developments
- 16.2.1.5. Financials (Based on Availability)
- 16.2.2 Bio-Rad Laboratories Inc
- 16.2.2.1. Overview
- 16.2.2.2. Products
- 16.2.2.3. SWOT Analysis
- 16.2.2.4. Recent Developments
- 16.2.2.5. Financials (Based on Availability)
- 16.2.3 Merck KGaA
- 16.2.3.1. Overview
- 16.2.3.2. Products
- 16.2.3.3. SWOT Analysis
- 16.2.3.4. Recent Developments
- 16.2.3.5. Financials (Based on Availability)
- 16.2.4 Abcam Plc
- 16.2.4.1. Overview
- 16.2.4.2. Products
- 16.2.4.3. SWOT Analysis
- 16.2.4.4. Recent Developments
- 16.2.4.5. Financials (Based on Availability)
- 16.2.5 F Hoffmann-La Roche Ltd
- 16.2.5.1. Overview
- 16.2.5.2. Products
- 16.2.5.3. SWOT Analysis
- 16.2.5.4. Recent Developments
- 16.2.5.5. Financials (Based on Availability)
- 16.2.6 Cell Signaling Technology Inc
- 16.2.6.1. Overview
- 16.2.6.2. Products
- 16.2.6.3. SWOT Analysis
- 16.2.6.4. Recent Developments
- 16.2.6.5. Financials (Based on Availability)
- 16.2.7 Danaher Corporation
- 16.2.7.1. Overview
- 16.2.7.2. Products
- 16.2.7.3. SWOT Analysis
- 16.2.7.4. Recent Developments
- 16.2.7.5. Financials (Based on Availability)
- 16.2.8 Qiagen
- 16.2.8.1. Overview
- 16.2.8.2. Products
- 16.2.8.3. SWOT Analysis
- 16.2.8.4. Recent Developments
- 16.2.8.5. Financials (Based on Availability)
- 16.2.9 PerkinElmer Inc
- 16.2.9.1. Overview
- 16.2.9.2. Products
- 16.2.9.3. SWOT Analysis
- 16.2.9.4. Recent Developments
- 16.2.9.5. Financials (Based on Availability)
- 16.2.10 Thermo Fisher Scientific
- 16.2.10.1. Overview
- 16.2.10.2. Products
- 16.2.10.3. SWOT Analysis
- 16.2.10.4. Recent Developments
- 16.2.10.5. Financials (Based on Availability)
- 16.2.1 Promega Corporation
List of Figures
- Figure 1: Global Protein Chip Industry Revenue Breakdown (Million, %) by Region 2024 & 2032
- Figure 2: Global Protein Chip Industry Volume Breakdown (K Unit, %) by Region 2024 & 2032
- Figure 3: North America Protein Chip Industry Revenue (Million), by Country 2024 & 2032
- Figure 4: North America Protein Chip Industry Volume (K Unit), by Country 2024 & 2032
- Figure 5: North America Protein Chip Industry Revenue Share (%), by Country 2024 & 2032
- Figure 6: North America Protein Chip Industry Volume Share (%), by Country 2024 & 2032
- Figure 7: Europe Protein Chip Industry Revenue (Million), by Country 2024 & 2032
- Figure 8: Europe Protein Chip Industry Volume (K Unit), by Country 2024 & 2032
- Figure 9: Europe Protein Chip Industry Revenue Share (%), by Country 2024 & 2032
- Figure 10: Europe Protein Chip Industry Volume Share (%), by Country 2024 & 2032
- Figure 11: Asia Pacific Protein Chip Industry Revenue (Million), by Country 2024 & 2032
- Figure 12: Asia Pacific Protein Chip Industry Volume (K Unit), by Country 2024 & 2032
- Figure 13: Asia Pacific Protein Chip Industry Revenue Share (%), by Country 2024 & 2032
- Figure 14: Asia Pacific Protein Chip Industry Volume Share (%), by Country 2024 & 2032
- Figure 15: Middle East and Africa Protein Chip Industry Revenue (Million), by Country 2024 & 2032
- Figure 16: Middle East and Africa Protein Chip Industry Volume (K Unit), by Country 2024 & 2032
- Figure 17: Middle East and Africa Protein Chip Industry Revenue Share (%), by Country 2024 & 2032
- Figure 18: Middle East and Africa Protein Chip Industry Volume Share (%), by Country 2024 & 2032
- Figure 19: South America Protein Chip Industry Revenue (Million), by Country 2024 & 2032
- Figure 20: South America Protein Chip Industry Volume (K Unit), by Country 2024 & 2032
- Figure 21: South America Protein Chip Industry Revenue Share (%), by Country 2024 & 2032
- Figure 22: South America Protein Chip Industry Volume Share (%), by Country 2024 & 2032
- Figure 23: North America Protein Chip Industry Revenue (Million), by Product Type 2024 & 2032
- Figure 24: North America Protein Chip Industry Volume (K Unit), by Product Type 2024 & 2032
- Figure 25: North America Protein Chip Industry Revenue Share (%), by Product Type 2024 & 2032
- Figure 26: North America Protein Chip Industry Volume Share (%), by Product Type 2024 & 2032
- Figure 27: North America Protein Chip Industry Revenue (Million), by Application 2024 & 2032
- Figure 28: North America Protein Chip Industry Volume (K Unit), by Application 2024 & 2032
- Figure 29: North America Protein Chip Industry Revenue Share (%), by Application 2024 & 2032
- Figure 30: North America Protein Chip Industry Volume Share (%), by Application 2024 & 2032
- Figure 31: North America Protein Chip Industry Revenue (Million), by End User 2024 & 2032
- Figure 32: North America Protein Chip Industry Volume (K Unit), by End User 2024 & 2032
- Figure 33: North America Protein Chip Industry Revenue Share (%), by End User 2024 & 2032
- Figure 34: North America Protein Chip Industry Volume Share (%), by End User 2024 & 2032
- Figure 35: North America Protein Chip Industry Revenue (Million), by Country 2024 & 2032
- Figure 36: North America Protein Chip Industry Volume (K Unit), by Country 2024 & 2032
- Figure 37: North America Protein Chip Industry Revenue Share (%), by Country 2024 & 2032
- Figure 38: North America Protein Chip Industry Volume Share (%), by Country 2024 & 2032
- Figure 39: Europe Protein Chip Industry Revenue (Million), by Product Type 2024 & 2032
- Figure 40: Europe Protein Chip Industry Volume (K Unit), by Product Type 2024 & 2032
- Figure 41: Europe Protein Chip Industry Revenue Share (%), by Product Type 2024 & 2032
- Figure 42: Europe Protein Chip Industry Volume Share (%), by Product Type 2024 & 2032
- Figure 43: Europe Protein Chip Industry Revenue (Million), by Application 2024 & 2032
- Figure 44: Europe Protein Chip Industry Volume (K Unit), by Application 2024 & 2032
- Figure 45: Europe Protein Chip Industry Revenue Share (%), by Application 2024 & 2032
- Figure 46: Europe Protein Chip Industry Volume Share (%), by Application 2024 & 2032
- Figure 47: Europe Protein Chip Industry Revenue (Million), by End User 2024 & 2032
- Figure 48: Europe Protein Chip Industry Volume (K Unit), by End User 2024 & 2032
- Figure 49: Europe Protein Chip Industry Revenue Share (%), by End User 2024 & 2032
- Figure 50: Europe Protein Chip Industry Volume Share (%), by End User 2024 & 2032
- Figure 51: Europe Protein Chip Industry Revenue (Million), by Country 2024 & 2032
- Figure 52: Europe Protein Chip Industry Volume (K Unit), by Country 2024 & 2032
- Figure 53: Europe Protein Chip Industry Revenue Share (%), by Country 2024 & 2032
- Figure 54: Europe Protein Chip Industry Volume Share (%), by Country 2024 & 2032
- Figure 55: Asia Pacific Protein Chip Industry Revenue (Million), by Product Type 2024 & 2032
- Figure 56: Asia Pacific Protein Chip Industry Volume (K Unit), by Product Type 2024 & 2032
- Figure 57: Asia Pacific Protein Chip Industry Revenue Share (%), by Product Type 2024 & 2032
- Figure 58: Asia Pacific Protein Chip Industry Volume Share (%), by Product Type 2024 & 2032
- Figure 59: Asia Pacific Protein Chip Industry Revenue (Million), by Application 2024 & 2032
- Figure 60: Asia Pacific Protein Chip Industry Volume (K Unit), by Application 2024 & 2032
- Figure 61: Asia Pacific Protein Chip Industry Revenue Share (%), by Application 2024 & 2032
- Figure 62: Asia Pacific Protein Chip Industry Volume Share (%), by Application 2024 & 2032
- Figure 63: Asia Pacific Protein Chip Industry Revenue (Million), by End User 2024 & 2032
- Figure 64: Asia Pacific Protein Chip Industry Volume (K Unit), by End User 2024 & 2032
- Figure 65: Asia Pacific Protein Chip Industry Revenue Share (%), by End User 2024 & 2032
- Figure 66: Asia Pacific Protein Chip Industry Volume Share (%), by End User 2024 & 2032
- Figure 67: Asia Pacific Protein Chip Industry Revenue (Million), by Country 2024 & 2032
- Figure 68: Asia Pacific Protein Chip Industry Volume (K Unit), by Country 2024 & 2032
- Figure 69: Asia Pacific Protein Chip Industry Revenue Share (%), by Country 2024 & 2032
- Figure 70: Asia Pacific Protein Chip Industry Volume Share (%), by Country 2024 & 2032
- Figure 71: Middle East and Africa Protein Chip Industry Revenue (Million), by Product Type 2024 & 2032
- Figure 72: Middle East and Africa Protein Chip Industry Volume (K Unit), by Product Type 2024 & 2032
- Figure 73: Middle East and Africa Protein Chip Industry Revenue Share (%), by Product Type 2024 & 2032
- Figure 74: Middle East and Africa Protein Chip Industry Volume Share (%), by Product Type 2024 & 2032
- Figure 75: Middle East and Africa Protein Chip Industry Revenue (Million), by Application 2024 & 2032
- Figure 76: Middle East and Africa Protein Chip Industry Volume (K Unit), by Application 2024 & 2032
- Figure 77: Middle East and Africa Protein Chip Industry Revenue Share (%), by Application 2024 & 2032
- Figure 78: Middle East and Africa Protein Chip Industry Volume Share (%), by Application 2024 & 2032
- Figure 79: Middle East and Africa Protein Chip Industry Revenue (Million), by End User 2024 & 2032
- Figure 80: Middle East and Africa Protein Chip Industry Volume (K Unit), by End User 2024 & 2032
- Figure 81: Middle East and Africa Protein Chip Industry Revenue Share (%), by End User 2024 & 2032
- Figure 82: Middle East and Africa Protein Chip Industry Volume Share (%), by End User 2024 & 2032
- Figure 83: Middle East and Africa Protein Chip Industry Revenue (Million), by Country 2024 & 2032
- Figure 84: Middle East and Africa Protein Chip Industry Volume (K Unit), by Country 2024 & 2032
- Figure 85: Middle East and Africa Protein Chip Industry Revenue Share (%), by Country 2024 & 2032
- Figure 86: Middle East and Africa Protein Chip Industry Volume Share (%), by Country 2024 & 2032
- Figure 87: South America Protein Chip Industry Revenue (Million), by Product Type 2024 & 2032
- Figure 88: South America Protein Chip Industry Volume (K Unit), by Product Type 2024 & 2032
- Figure 89: South America Protein Chip Industry Revenue Share (%), by Product Type 2024 & 2032
- Figure 90: South America Protein Chip Industry Volume Share (%), by Product Type 2024 & 2032
- Figure 91: South America Protein Chip Industry Revenue (Million), by Application 2024 & 2032
- Figure 92: South America Protein Chip Industry Volume (K Unit), by Application 2024 & 2032
- Figure 93: South America Protein Chip Industry Revenue Share (%), by Application 2024 & 2032
- Figure 94: South America Protein Chip Industry Volume Share (%), by Application 2024 & 2032
- Figure 95: South America Protein Chip Industry Revenue (Million), by End User 2024 & 2032
- Figure 96: South America Protein Chip Industry Volume (K Unit), by End User 2024 & 2032
- Figure 97: South America Protein Chip Industry Revenue Share (%), by End User 2024 & 2032
- Figure 98: South America Protein Chip Industry Volume Share (%), by End User 2024 & 2032
- Figure 99: South America Protein Chip Industry Revenue (Million), by Country 2024 & 2032
- Figure 100: South America Protein Chip Industry Volume (K Unit), by Country 2024 & 2032
- Figure 101: South America Protein Chip Industry Revenue Share (%), by Country 2024 & 2032
- Figure 102: South America Protein Chip Industry Volume Share (%), by Country 2024 & 2032
List of Tables
- Table 1: Global Protein Chip Industry Revenue Million Forecast, by Region 2019 & 2032
- Table 2: Global Protein Chip Industry Volume K Unit Forecast, by Region 2019 & 2032
- Table 3: Global Protein Chip Industry Revenue Million Forecast, by Product Type 2019 & 2032
- Table 4: Global Protein Chip Industry Volume K Unit Forecast, by Product Type 2019 & 2032
- Table 5: Global Protein Chip Industry Revenue Million Forecast, by Application 2019 & 2032
- Table 6: Global Protein Chip Industry Volume K Unit Forecast, by Application 2019 & 2032
- Table 7: Global Protein Chip Industry Revenue Million Forecast, by End User 2019 & 2032
- Table 8: Global Protein Chip Industry Volume K Unit Forecast, by End User 2019 & 2032
- Table 9: Global Protein Chip Industry Revenue Million Forecast, by Region 2019 & 2032
- Table 10: Global Protein Chip Industry Volume K Unit Forecast, by Region 2019 & 2032
- Table 11: Global Protein Chip Industry Revenue Million Forecast, by Country 2019 & 2032
- Table 12: Global Protein Chip Industry Volume K Unit Forecast, by Country 2019 & 2032
- Table 13: United States Protein Chip Industry Revenue (Million) Forecast, by Application 2019 & 2032
- Table 14: United States Protein Chip Industry Volume (K Unit) Forecast, by Application 2019 & 2032
- Table 15: Canada Protein Chip Industry Revenue (Million) Forecast, by Application 2019 & 2032
- Table 16: Canada Protein Chip Industry Volume (K Unit) Forecast, by Application 2019 & 2032
- Table 17: Mexico Protein Chip Industry Revenue (Million) Forecast, by Application 2019 & 2032
- Table 18: Mexico Protein Chip Industry Volume (K Unit) Forecast, by Application 2019 & 2032
- Table 19: Global Protein Chip Industry Revenue Million Forecast, by Country 2019 & 2032
- Table 20: Global Protein Chip Industry Volume K Unit Forecast, by Country 2019 & 2032
- Table 21: Germany Protein Chip Industry Revenue (Million) Forecast, by Application 2019 & 2032
- Table 22: Germany Protein Chip Industry Volume (K Unit) Forecast, by Application 2019 & 2032
- Table 23: United Kingdom Protein Chip Industry Revenue (Million) Forecast, by Application 2019 & 2032
- Table 24: United Kingdom Protein Chip Industry Volume (K Unit) Forecast, by Application 2019 & 2032
- Table 25: France Protein Chip Industry Revenue (Million) Forecast, by Application 2019 & 2032
- Table 26: France Protein Chip Industry Volume (K Unit) Forecast, by Application 2019 & 2032
- Table 27: Italy Protein Chip Industry Revenue (Million) Forecast, by Application 2019 & 2032
- Table 28: Italy Protein Chip Industry Volume (K Unit) Forecast, by Application 2019 & 2032
- Table 29: Spain Protein Chip Industry Revenue (Million) Forecast, by Application 2019 & 2032
- Table 30: Spain Protein Chip Industry Volume (K Unit) Forecast, by Application 2019 & 2032
- Table 31: Rest of Europe Protein Chip Industry Revenue (Million) Forecast, by Application 2019 & 2032
- Table 32: Rest of Europe Protein Chip Industry Volume (K Unit) Forecast, by Application 2019 & 2032
- Table 33: Global Protein Chip Industry Revenue Million Forecast, by Country 2019 & 2032
- Table 34: Global Protein Chip Industry Volume K Unit Forecast, by Country 2019 & 2032
- Table 35: China Protein Chip Industry Revenue (Million) Forecast, by Application 2019 & 2032
- Table 36: China Protein Chip Industry Volume (K Unit) Forecast, by Application 2019 & 2032
- Table 37: Japan Protein Chip Industry Revenue (Million) Forecast, by Application 2019 & 2032
- Table 38: Japan Protein Chip Industry Volume (K Unit) Forecast, by Application 2019 & 2032
- Table 39: India Protein Chip Industry Revenue (Million) Forecast, by Application 2019 & 2032
- Table 40: India Protein Chip Industry Volume (K Unit) Forecast, by Application 2019 & 2032
- Table 41: Australia Protein Chip Industry Revenue (Million) Forecast, by Application 2019 & 2032
- Table 42: Australia Protein Chip Industry Volume (K Unit) Forecast, by Application 2019 & 2032
- Table 43: South Korea Protein Chip Industry Revenue (Million) Forecast, by Application 2019 & 2032
- Table 44: South Korea Protein Chip Industry Volume (K Unit) Forecast, by Application 2019 & 2032
- Table 45: Rest of Asia Pacific Protein Chip Industry Revenue (Million) Forecast, by Application 2019 & 2032
- Table 46: Rest of Asia Pacific Protein Chip Industry Volume (K Unit) Forecast, by Application 2019 & 2032
- Table 47: Global Protein Chip Industry Revenue Million Forecast, by Country 2019 & 2032
- Table 48: Global Protein Chip Industry Volume K Unit Forecast, by Country 2019 & 2032
- Table 49: GCC Protein Chip Industry Revenue (Million) Forecast, by Application 2019 & 2032
- Table 50: GCC Protein Chip Industry Volume (K Unit) Forecast, by Application 2019 & 2032
- Table 51: South Africa Protein Chip Industry Revenue (Million) Forecast, by Application 2019 & 2032
- Table 52: South Africa Protein Chip Industry Volume (K Unit) Forecast, by Application 2019 & 2032
- Table 53: Rest of Middle East and Africa Protein Chip Industry Revenue (Million) Forecast, by Application 2019 & 2032
- Table 54: Rest of Middle East and Africa Protein Chip Industry Volume (K Unit) Forecast, by Application 2019 & 2032
- Table 55: Global Protein Chip Industry Revenue Million Forecast, by Country 2019 & 2032
- Table 56: Global Protein Chip Industry Volume K Unit Forecast, by Country 2019 & 2032
- Table 57: Brazil Protein Chip Industry Revenue (Million) Forecast, by Application 2019 & 2032
- Table 58: Brazil Protein Chip Industry Volume (K Unit) Forecast, by Application 2019 & 2032
- Table 59: Argentina Protein Chip Industry Revenue (Million) Forecast, by Application 2019 & 2032
- Table 60: Argentina Protein Chip Industry Volume (K Unit) Forecast, by Application 2019 & 2032
- Table 61: Rest of South America Protein Chip Industry Revenue (Million) Forecast, by Application 2019 & 2032
- Table 62: Rest of South America Protein Chip Industry Volume (K Unit) Forecast, by Application 2019 & 2032
- Table 63: Global Protein Chip Industry Revenue Million Forecast, by Product Type 2019 & 2032
- Table 64: Global Protein Chip Industry Volume K Unit Forecast, by Product Type 2019 & 2032
- Table 65: Global Protein Chip Industry Revenue Million Forecast, by Application 2019 & 2032
- Table 66: Global Protein Chip Industry Volume K Unit Forecast, by Application 2019 & 2032
- Table 67: Global Protein Chip Industry Revenue Million Forecast, by End User 2019 & 2032
- Table 68: Global Protein Chip Industry Volume K Unit Forecast, by End User 2019 & 2032
- Table 69: Global Protein Chip Industry Revenue Million Forecast, by Country 2019 & 2032
- Table 70: Global Protein Chip Industry Volume K Unit Forecast, by Country 2019 & 2032
- Table 71: United States Protein Chip Industry Revenue (Million) Forecast, by Application 2019 & 2032
- Table 72: United States Protein Chip Industry Volume (K Unit) Forecast, by Application 2019 & 2032
- Table 73: Canada Protein Chip Industry Revenue (Million) Forecast, by Application 2019 & 2032
- Table 74: Canada Protein Chip Industry Volume (K Unit) Forecast, by Application 2019 & 2032
- Table 75: Mexico Protein Chip Industry Revenue (Million) Forecast, by Application 2019 & 2032
- Table 76: Mexico Protein Chip Industry Volume (K Unit) Forecast, by Application 2019 & 2032
- Table 77: Global Protein Chip Industry Revenue Million Forecast, by Product Type 2019 & 2032
- Table 78: Global Protein Chip Industry Volume K Unit Forecast, by Product Type 2019 & 2032
- Table 79: Global Protein Chip Industry Revenue Million Forecast, by Application 2019 & 2032
- Table 80: Global Protein Chip Industry Volume K Unit Forecast, by Application 2019 & 2032
- Table 81: Global Protein Chip Industry Revenue Million Forecast, by End User 2019 & 2032
- Table 82: Global Protein Chip Industry Volume K Unit Forecast, by End User 2019 & 2032
- Table 83: Global Protein Chip Industry Revenue Million Forecast, by Country 2019 & 2032
- Table 84: Global Protein Chip Industry Volume K Unit Forecast, by Country 2019 & 2032
- Table 85: Germany Protein Chip Industry Revenue (Million) Forecast, by Application 2019 & 2032
- Table 86: Germany Protein Chip Industry Volume (K Unit) Forecast, by Application 2019 & 2032
- Table 87: United Kingdom Protein Chip Industry Revenue (Million) Forecast, by Application 2019 & 2032
- Table 88: United Kingdom Protein Chip Industry Volume (K Unit) Forecast, by Application 2019 & 2032
- Table 89: France Protein Chip Industry Revenue (Million) Forecast, by Application 2019 & 2032
- Table 90: France Protein Chip Industry Volume (K Unit) Forecast, by Application 2019 & 2032
- Table 91: Italy Protein Chip Industry Revenue (Million) Forecast, by Application 2019 & 2032
- Table 92: Italy Protein Chip Industry Volume (K Unit) Forecast, by Application 2019 & 2032
- Table 93: Spain Protein Chip Industry Revenue (Million) Forecast, by Application 2019 & 2032
- Table 94: Spain Protein Chip Industry Volume (K Unit) Forecast, by Application 2019 & 2032
- Table 95: Rest of Europe Protein Chip Industry Revenue (Million) Forecast, by Application 2019 & 2032
- Table 96: Rest of Europe Protein Chip Industry Volume (K Unit) Forecast, by Application 2019 & 2032
- Table 97: Global Protein Chip Industry Revenue Million Forecast, by Product Type 2019 & 2032
- Table 98: Global Protein Chip Industry Volume K Unit Forecast, by Product Type 2019 & 2032
- Table 99: Global Protein Chip Industry Revenue Million Forecast, by Application 2019 & 2032
- Table 100: Global Protein Chip Industry Volume K Unit Forecast, by Application 2019 & 2032
- Table 101: Global Protein Chip Industry Revenue Million Forecast, by End User 2019 & 2032
- Table 102: Global Protein Chip Industry Volume K Unit Forecast, by End User 2019 & 2032
- Table 103: Global Protein Chip Industry Revenue Million Forecast, by Country 2019 & 2032
- Table 104: Global Protein Chip Industry Volume K Unit Forecast, by Country 2019 & 2032
- Table 105: China Protein Chip Industry Revenue (Million) Forecast, by Application 2019 & 2032
- Table 106: China Protein Chip Industry Volume (K Unit) Forecast, by Application 2019 & 2032
- Table 107: Japan Protein Chip Industry Revenue (Million) Forecast, by Application 2019 & 2032
- Table 108: Japan Protein Chip Industry Volume (K Unit) Forecast, by Application 2019 & 2032
- Table 109: India Protein Chip Industry Revenue (Million) Forecast, by Application 2019 & 2032
- Table 110: India Protein Chip Industry Volume (K Unit) Forecast, by Application 2019 & 2032
- Table 111: Australia Protein Chip Industry Revenue (Million) Forecast, by Application 2019 & 2032
- Table 112: Australia Protein Chip Industry Volume (K Unit) Forecast, by Application 2019 & 2032
- Table 113: South Korea Protein Chip Industry Revenue (Million) Forecast, by Application 2019 & 2032
- Table 114: South Korea Protein Chip Industry Volume (K Unit) Forecast, by Application 2019 & 2032
- Table 115: Rest of Asia Pacific Protein Chip Industry Revenue (Million) Forecast, by Application 2019 & 2032
- Table 116: Rest of Asia Pacific Protein Chip Industry Volume (K Unit) Forecast, by Application 2019 & 2032
- Table 117: Global Protein Chip Industry Revenue Million Forecast, by Product Type 2019 & 2032
- Table 118: Global Protein Chip Industry Volume K Unit Forecast, by Product Type 2019 & 2032
- Table 119: Global Protein Chip Industry Revenue Million Forecast, by Application 2019 & 2032
- Table 120: Global Protein Chip Industry Volume K Unit Forecast, by Application 2019 & 2032
- Table 121: Global Protein Chip Industry Revenue Million Forecast, by End User 2019 & 2032
- Table 122: Global Protein Chip Industry Volume K Unit Forecast, by End User 2019 & 2032
- Table 123: Global Protein Chip Industry Revenue Million Forecast, by Country 2019 & 2032
- Table 124: Global Protein Chip Industry Volume K Unit Forecast, by Country 2019 & 2032
- Table 125: GCC Protein Chip Industry Revenue (Million) Forecast, by Application 2019 & 2032
- Table 126: GCC Protein Chip Industry Volume (K Unit) Forecast, by Application 2019 & 2032
- Table 127: South Africa Protein Chip Industry Revenue (Million) Forecast, by Application 2019 & 2032
- Table 128: South Africa Protein Chip Industry Volume (K Unit) Forecast, by Application 2019 & 2032
- Table 129: Rest of Middle East and Africa Protein Chip Industry Revenue (Million) Forecast, by Application 2019 & 2032
- Table 130: Rest of Middle East and Africa Protein Chip Industry Volume (K Unit) Forecast, by Application 2019 & 2032
- Table 131: Global Protein Chip Industry Revenue Million Forecast, by Product Type 2019 & 2032
- Table 132: Global Protein Chip Industry Volume K Unit Forecast, by Product Type 2019 & 2032
- Table 133: Global Protein Chip Industry Revenue Million Forecast, by Application 2019 & 2032
- Table 134: Global Protein Chip Industry Volume K Unit Forecast, by Application 2019 & 2032
- Table 135: Global Protein Chip Industry Revenue Million Forecast, by End User 2019 & 2032
- Table 136: Global Protein Chip Industry Volume K Unit Forecast, by End User 2019 & 2032
- Table 137: Global Protein Chip Industry Revenue Million Forecast, by Country 2019 & 2032
- Table 138: Global Protein Chip Industry Volume K Unit Forecast, by Country 2019 & 2032
- Table 139: Brazil Protein Chip Industry Revenue (Million) Forecast, by Application 2019 & 2032
- Table 140: Brazil Protein Chip Industry Volume (K Unit) Forecast, by Application 2019 & 2032
- Table 141: Argentina Protein Chip Industry Revenue (Million) Forecast, by Application 2019 & 2032
- Table 142: Argentina Protein Chip Industry Volume (K Unit) Forecast, by Application 2019 & 2032
- Table 143: Rest of South America Protein Chip Industry Revenue (Million) Forecast, by Application 2019 & 2032
- Table 144: Rest of South America Protein Chip Industry Volume (K Unit) Forecast, by Application 2019 & 2032
Frequently Asked Questions
1. What is the projected Compound Annual Growth Rate (CAGR) of the Protein Chip Industry?
The projected CAGR is approximately 11.73%.
2. Which companies are prominent players in the Protein Chip Industry?
Key companies in the market include Promega Corporation, Bio-Rad Laboratories Inc, Merck KGaA, Abcam Plc, F Hoffmann-La Roche Ltd, Cell Signaling Technology Inc, Danaher Corporation, Qiagen, PerkinElmer Inc, Thermo Fisher Scientific.
3. What are the main segments of the Protein Chip Industry?
The market segments include Product Type, Application, End User.
4. Can you provide details about the market size?
The market size is estimated to be USD 2.03 Million as of 2022.
5. What are some drivers contributing to market growth?
Increasing Incidence of Chronic and Infectious Diseases; Technological Advancements in Protein Assay Techniques; Increasing Expenditure on Pharmaceutical and Biological Research and Development.
6. What are the notable trends driving market growth?
Drug Discovery and Development Segment is Expected to Hold a Significant Share in the Protein Assay Market during the Forecast Period of the Study.
7. Are there any restraints impacting market growth?
High Cost of Multiplex Assay Equipment.
8. Can you provide examples of recent developments in the market?
In March 2022, Biognosys launched an expanded suite of proteomics platforms that provide pharmaceutical and diagnostics customers with deep biological insights across the entire R&D pipeline, from early-stage discovery to clinical settings.
9. What pricing options are available for accessing the report?
Pricing options include single-user, multi-user, and enterprise licenses priced at USD 4750, USD 5250, and USD 8750 respectively.
10. Is the market size provided in terms of value or volume?
The market size is provided in terms of value, measured in Million and volume, measured in K Unit.
11. Are there any specific market keywords associated with the report?
Yes, the market keyword associated with the report is "Protein Chip Industry," which aids in identifying and referencing the specific market segment covered.
12. How do I determine which pricing option suits my needs best?
The pricing options vary based on user requirements and access needs. Individual users may opt for single-user licenses, while businesses requiring broader access may choose multi-user or enterprise licenses for cost-effective access to the report.
13. Are there any additional resources or data provided in the Protein Chip Industry report?
While the report offers comprehensive insights, it's advisable to review the specific contents or supplementary materials provided to ascertain if additional resources or data are available.
14. How can I stay updated on further developments or reports in the Protein Chip Industry?
To stay informed about further developments, trends, and reports in the Protein Chip Industry, consider subscribing to industry newsletters, following relevant companies and organizations, or regularly checking reputable industry news sources and publications.
Methodology
Step 1 - Identification of Relevant Samples Size from Population Database


Step 2 - Approaches for Defining Global Market Size (Value, Volume* & Price*)

Note*: In applicable scenarios
Step 3 - Data Sources
Primary Research
- Web Analytics
- Survey Reports
- Research Institute
- Latest Research Reports
- Opinion Leaders
Secondary Research
- Annual Reports
- White Paper
- Latest Press Release
- Industry Association
- Paid Database
- Investor Presentations

Step 4 - Data Triangulation
Involves using different sources of information in order to increase the validity of a study
These sources are likely to be stakeholders in a program - participants, other researchers, program staff, other community members, and so on.
Then we put all data in single framework & apply various statistical tools to find out the dynamic on the market.
During the analysis stage, feedback from the stakeholder groups would be compared to determine areas of agreement as well as areas of divergence


