
Key Insights
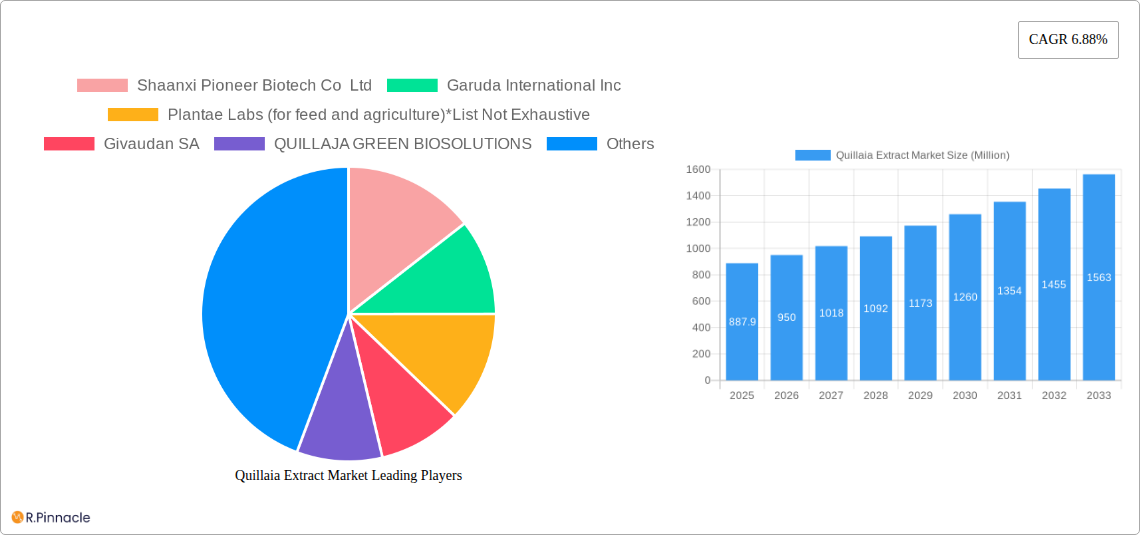
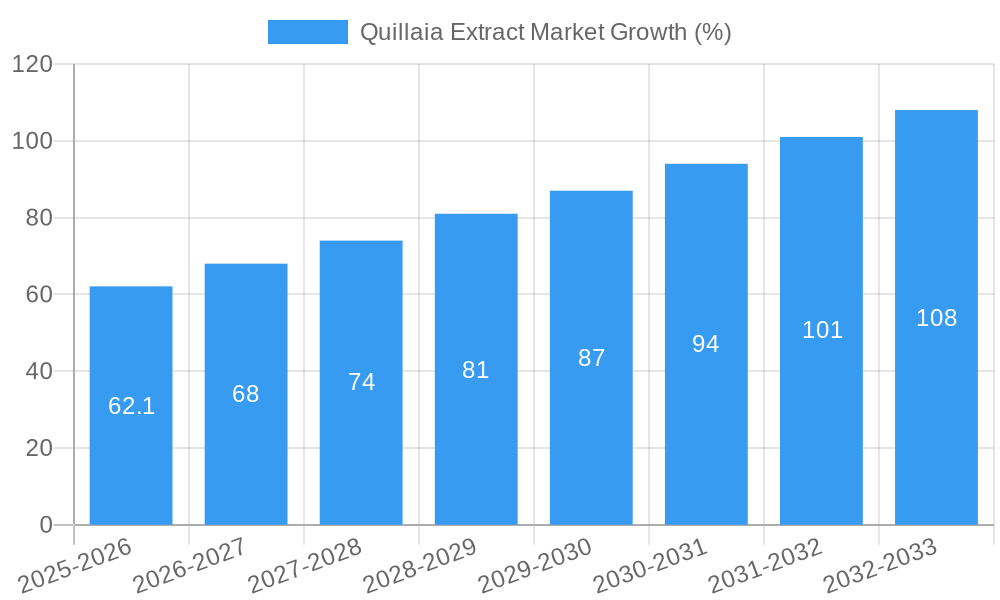
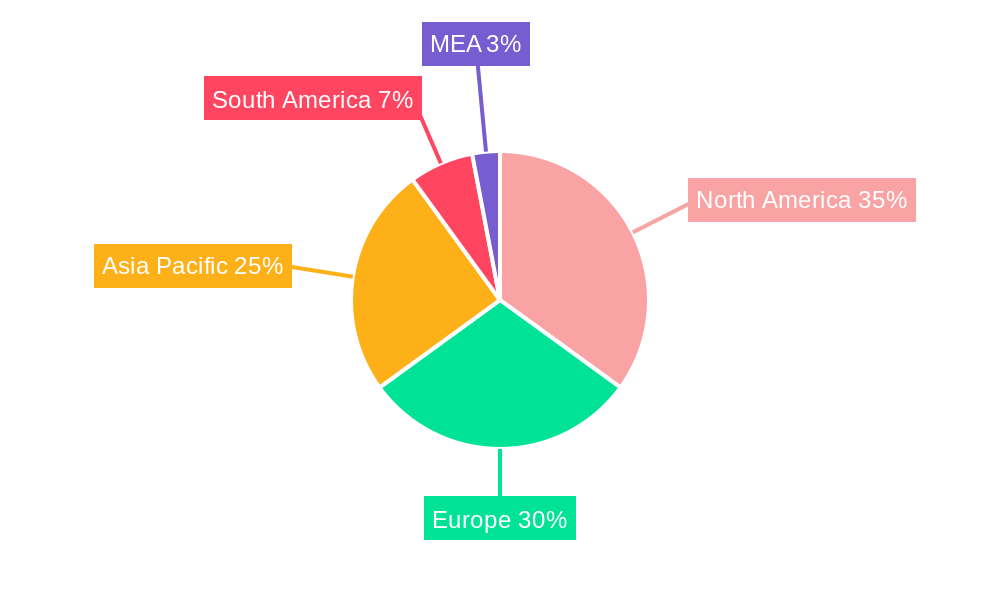
The Quillaia extract market, valued at $887.90 million in 2025, is projected to experience robust growth, driven by increasing demand across diverse sectors. A compound annual growth rate (CAGR) of 6.88% from 2025 to 2033 indicates a significant expansion potential. Key drivers include the rising popularity of natural and organic ingredients in food and beverage products, the growing pharmaceutical industry's interest in its surfactant properties, and its increasing use in personal care and cosmetics for its foaming and emulsifying capabilities. The market is segmented by form (liquid and powder) and application (food, beverages, pharmaceuticals, personal care and cosmetics, and others). The liquid form currently dominates, driven by its ease of use in various applications. Geographically, North America and Europe currently hold significant market share, fueled by established consumer preferences for natural products and well-developed regulatory frameworks. However, Asia-Pacific is poised for significant growth owing to increasing disposable incomes and rising awareness of natural ingredients among consumers in developing economies. Competition in the market is moderate, with key players like Shaanxi Pioneer Biotech, Garuda International, and Givaudan SA leading the way, along with several regional players catering to specific market segments. Despite challenges such as price fluctuations in raw materials and potential supply chain constraints, the overall outlook for the Quillaia extract market remains positive, presenting lucrative opportunities for both established and emerging companies.
The projected growth is supported by several factors. The increasing focus on sustainable and ethically sourced ingredients is further boosting demand. Ongoing research into the potential health benefits of Quillaia extract, such as its immune-modulatory properties, is expected to drive further adoption in the pharmaceutical and nutraceutical sectors. Furthermore, the expanding market for natural cosmetics and personal care products is expected to further enhance market expansion. The market is anticipated to witness increasing innovation in product formulations and delivery systems, particularly in the food and beverage industry, enhancing product appeal and driving further market growth throughout the forecast period. Regulatory changes and evolving consumer preferences will continue to shape market dynamics, necessitating adaptation and innovation among market participants.
Quillaia Extract Market Report: A Comprehensive Analysis (2019-2033)
This comprehensive report provides an in-depth analysis of the global Quillaia Extract market, offering valuable insights for industry professionals, investors, and researchers. Spanning the period from 2019 to 2033, with a base year of 2025 and a forecast period of 2025-2033, this report unravels the market's structure, dynamics, and future potential. The report features detailed segmentation by form (liquid, powder) and application (food, beverage, pharmaceutical, personal care & cosmetics, others), delivering actionable intelligence for strategic decision-making. With a market size expected to reach XX Million by 2033, this report is an essential resource for navigating the complexities of this growing market.
Quillaia Extract Market Structure & Innovation Trends
The Quillaia Extract market exhibits a moderately fragmented structure, with several key players vying for market share. While precise market share figures for individual companies remain commercially sensitive, Ingredion Incorporated, Givaudan SA, and Shaanxi Pioneer Biotech Co Ltd are recognized as significant players. The market's innovative landscape is driven by advancements in extraction techniques, leading to higher purity and yield, and the exploration of novel applications in the pharmaceutical and cosmetic sectors.
- Market Concentration: Moderately fragmented, with no single dominant player holding a majority share.
- Innovation Drivers: Advancements in extraction technologies, R&D in new applications (e.g., nutraceuticals), sustainable sourcing initiatives.
- Regulatory Frameworks: Varying regulations across different regions impacting product labeling and usage.
- Product Substitutes: Limited direct substitutes, but competition exists from other natural emulsifiers and foaming agents.
- M&A Activities: Recent significant activity includes the acquisition of Desert King by Ingredion Incorporated in 2023, potentially valued at XX Million, indicating a consolidation trend. This deal significantly enhanced Ingredion’s presence in the natural extracts market. The partnership between Shaanxi Pioneer Biotech and Plantae Labs suggests a growing trend in collaborative R&D.
- End-User Demographics: Diverse, spanning food & beverage, pharmaceutical, and personal care industries.
Quillaia Extract Market Dynamics & Trends
The Quillaia Extract market is experiencing robust growth, fueled by increasing demand across various applications. The compound annual growth rate (CAGR) is projected to be XX% during the forecast period (2025-2033). This growth is driven by several factors, including the rising consumer preference for natural and clean-label ingredients, the expanding pharmaceutical and cosmetic sectors, and the increasing use of quillaia extract as a sustainable alternative to synthetic emulsifiers and foaming agents. Technological advancements in extraction methods contribute to higher product quality and cost-effectiveness. Competitive dynamics are characterized by a mix of established players and emerging companies, leading to innovation and strategic partnerships. Market penetration is steadily increasing across different regions, particularly in developed economies with high demand for natural products.
Dominant Regions & Segments in Quillaia Extract Market
The Quillaia Extract market displays regional variations in growth and dominance. While specific market share data by region is confidential, Latin America (particularly Chile and Peru), due to being a primary growing region, is likely to be a dominant region for production and potentially export. Within segment analysis:
By Form: The powder form currently holds a larger market share than the liquid form due to its ease of handling and storage, however, liquid form is expected to show substantial growth with advancements in extraction and stabilization techniques.
By Application: The food and beverage sector currently dominates the market, followed by the personal care and cosmetics industry. Growth in the pharmaceutical sector is expected due to increasing use of quillaia extract in drug delivery systems.
Key Drivers (for Latin America): Favorable climatic conditions for Quillaia cultivation, established agricultural infrastructure, government support for the natural products industry.
Quillaia Extract Market Product Innovations
Recent innovations focus on enhancing the purity and stability of quillaia extract, extending its shelf life, and developing specialized formulations for specific applications. Technological advancements in extraction processes, such as supercritical fluid extraction, are improving yield and reducing environmental impact. These innovations are improving the market fit by providing higher-quality ingredients that meet the demands of discerning consumers and manufacturers.
Report Scope & Segmentation Analysis
This report segments the Quillaia Extract market by form (liquid, powder) and application (food, beverage, pharmaceutical, personal care & cosmetics, others). Each segment’s growth projections, market size (in Million USD), and competitive dynamics are analyzed in detail. The report offers insights into the factors influencing the growth trajectory of each segment, along with forecasts for market size and share for the period 2025-2033.
Key Drivers of Quillaia Extract Market Growth
The Quillaia Extract market's growth is primarily driven by:
- The increasing consumer preference for natural and clean-label ingredients in food and personal care products.
- The growing demand for sustainable and eco-friendly alternatives to synthetic emulsifiers and foaming agents.
- Advancements in extraction technologies leading to improved product quality and cost-efficiency.
- Expansion of the pharmaceutical and cosmetic industries.
Challenges in the Quillaia Extract Market Sector
Challenges facing the Quillaia Extract market include:
- Fluctuations in raw material supply due to factors such as climate change and disease.
- Variations in regulatory frameworks across different regions impacting product compliance.
- Intense competition from other natural and synthetic emulsifiers and foaming agents.
Emerging Opportunities in Quillaia Extract Market
Emerging opportunities include:
- Expansion into new markets with high growth potential, such as nutraceuticals and functional foods.
- Development of new applications in areas such as drug delivery and cosmetics.
- Exploring innovative extraction and processing methods to enhance sustainability.
Leading Players in the Quillaia Extract Market
- Shaanxi Pioneer Biotech Co Ltd
- Garuda International Inc
- Plantae Labs (for feed and agriculture)
- Givaudan SA
- QUILLAJA GREEN BIOSOLUTIONS
- Desert King
- Ingredion Incorporated
- Baja Yucca Company
- Brenntag AG
- StanChem, Inc.
Key Developments in Quillaia Extract Market Industry
- 2023: Acquisition of Desert King by Ingredion Incorporated.
- 20XX: Partnership between Shaanxi Pioneer Biotech and Plantae Labs for joint R&D.
- 20XX: Expansion of cultivation areas in Chile and Peru by QUILLAJA GREEN BIOSOLUTIONS.
Future Outlook for Quillaia Extract Market
The Quillaia Extract market is poised for continued growth, driven by increasing consumer demand for natural ingredients and expanding applications in diverse sectors. Strategic partnerships, product innovation, and expansion into new markets present significant opportunities for market players. The market's sustainable and eco-friendly nature positions it for long-term success.
Quillaia Extract Market Segmentation
-
1. Form
- 1.1. Liquid
- 1.2. Powder
-
2. Application
-
2.1. Food
- 2.1.1. Bakery
- 2.1.2. Confectionary
- 2.1.3. Dairy
- 2.1.4. Others
-
2.2. Beverage
- 2.2.1. Alcholic
- 2.2.2. Non-Alcholic
- 2.3. Pharamceutical
- 2.4. Personal Care and Cosmetics
-
2.1. Food
Quillaia Extract Market Segmentation By Geography
-
1. North America
- 1.1. United States
- 1.2. Canada
- 1.3. Mexico
- 1.4. Rest of North America
-
2. Europe
- 2.1. Germany
- 2.2. United Kingdom
- 2.3. France
- 2.4. Italy
- 2.5. Russia
- 2.6. Spain
- 2.7. Rest of Europe
-
3. Asia Pacific
- 3.1. China
- 3.2. Japan
- 3.3. India
- 3.4. Australia
- 3.5. Rest of Asia Pacific
-
4. Rest of the World
- 4.1. South America
- 4.2. Middle East and Africa
Quillaia Extract Market REPORT HIGHLIGHTS
| Aspects | Details |
|---|---|
| Study Period | 2019-2033 |
| Base Year | 2024 |
| Estimated Year | 2025 |
| Forecast Period | 2025-2033 |
| Historical Period | 2019-2024 |
| Growth Rate | CAGR of 6.88% from 2019-2033 |
| Segmentation |
|
Table of Contents
- 1. Introduction
- 1.1. Research Scope
- 1.2. Market Segmentation
- 1.3. Research Methodology
- 1.4. Definitions and Assumptions
- 2. Executive Summary
- 2.1. Introduction
- 3. Market Dynamics
- 3.1. Introduction
- 3.2. Market Drivers
- 3.2.1. Increasing application of Gelatin in healthcare and pharmaceutical sector
- 3.3. Market Restrains
- 3.3.1. Rising demand for clean label products
- 3.4. Market Trends
- 3.4.1. Role of Specialty Food Ingredients in Processed Food Industry
- 4. Market Factor Analysis
- 4.1. Porters Five Forces
- 4.2. Supply/Value Chain
- 4.3. PESTEL analysis
- 4.4. Market Entropy
- 4.5. Patent/Trademark Analysis
- 5. Global Quillaia Extract Market Analysis, Insights and Forecast, 2019-2031
- 5.1. Market Analysis, Insights and Forecast - by Form
- 5.1.1. Liquid
- 5.1.2. Powder
- 5.2. Market Analysis, Insights and Forecast - by Application
- 5.2.1. Food
- 5.2.1.1. Bakery
- 5.2.1.2. Confectionary
- 5.2.1.3. Dairy
- 5.2.1.4. Others
- 5.2.2. Beverage
- 5.2.2.1. Alcholic
- 5.2.2.2. Non-Alcholic
- 5.2.3. Pharamceutical
- 5.2.4. Personal Care and Cosmetics
- 5.2.1. Food
- 5.3. Market Analysis, Insights and Forecast - by Region
- 5.3.1. North America
- 5.3.2. Europe
- 5.3.3. Asia Pacific
- 5.3.4. Rest of the World
- 5.1. Market Analysis, Insights and Forecast - by Form
- 6. North America Quillaia Extract Market Analysis, Insights and Forecast, 2019-2031
- 6.1. Market Analysis, Insights and Forecast - by Form
- 6.1.1. Liquid
- 6.1.2. Powder
- 6.2. Market Analysis, Insights and Forecast - by Application
- 6.2.1. Food
- 6.2.1.1. Bakery
- 6.2.1.2. Confectionary
- 6.2.1.3. Dairy
- 6.2.1.4. Others
- 6.2.2. Beverage
- 6.2.2.1. Alcholic
- 6.2.2.2. Non-Alcholic
- 6.2.3. Pharamceutical
- 6.2.4. Personal Care and Cosmetics
- 6.2.1. Food
- 6.1. Market Analysis, Insights and Forecast - by Form
- 7. Europe Quillaia Extract Market Analysis, Insights and Forecast, 2019-2031
- 7.1. Market Analysis, Insights and Forecast - by Form
- 7.1.1. Liquid
- 7.1.2. Powder
- 7.2. Market Analysis, Insights and Forecast - by Application
- 7.2.1. Food
- 7.2.1.1. Bakery
- 7.2.1.2. Confectionary
- 7.2.1.3. Dairy
- 7.2.1.4. Others
- 7.2.2. Beverage
- 7.2.2.1. Alcholic
- 7.2.2.2. Non-Alcholic
- 7.2.3. Pharamceutical
- 7.2.4. Personal Care and Cosmetics
- 7.2.1. Food
- 7.1. Market Analysis, Insights and Forecast - by Form
- 8. Asia Pacific Quillaia Extract Market Analysis, Insights and Forecast, 2019-2031
- 8.1. Market Analysis, Insights and Forecast - by Form
- 8.1.1. Liquid
- 8.1.2. Powder
- 8.2. Market Analysis, Insights and Forecast - by Application
- 8.2.1. Food
- 8.2.1.1. Bakery
- 8.2.1.2. Confectionary
- 8.2.1.3. Dairy
- 8.2.1.4. Others
- 8.2.2. Beverage
- 8.2.2.1. Alcholic
- 8.2.2.2. Non-Alcholic
- 8.2.3. Pharamceutical
- 8.2.4. Personal Care and Cosmetics
- 8.2.1. Food
- 8.1. Market Analysis, Insights and Forecast - by Form
- 9. Rest of the World Quillaia Extract Market Analysis, Insights and Forecast, 2019-2031
- 9.1. Market Analysis, Insights and Forecast - by Form
- 9.1.1. Liquid
- 9.1.2. Powder
- 9.2. Market Analysis, Insights and Forecast - by Application
- 9.2.1. Food
- 9.2.1.1. Bakery
- 9.2.1.2. Confectionary
- 9.2.1.3. Dairy
- 9.2.1.4. Others
- 9.2.2. Beverage
- 9.2.2.1. Alcholic
- 9.2.2.2. Non-Alcholic
- 9.2.3. Pharamceutical
- 9.2.4. Personal Care and Cosmetics
- 9.2.1. Food
- 9.1. Market Analysis, Insights and Forecast - by Form
- 10. North America Quillaia Extract Market Analysis, Insights and Forecast, 2019-2031
- 10.1. Market Analysis, Insights and Forecast - By Country/Sub-region
- 10.1.1 United States
- 10.1.2 Canada
- 10.1.3 Mexico
- 11. Europe Quillaia Extract Market Analysis, Insights and Forecast, 2019-2031
- 11.1. Market Analysis, Insights and Forecast - By Country/Sub-region
- 11.1.1 Germany
- 11.1.2 United Kingdom
- 11.1.3 France
- 11.1.4 Spain
- 11.1.5 Italy
- 11.1.6 Spain
- 11.1.7 Belgium
- 11.1.8 Netherland
- 11.1.9 Nordics
- 11.1.10 Rest of Europe
- 12. Asia Pacific Quillaia Extract Market Analysis, Insights and Forecast, 2019-2031
- 12.1. Market Analysis, Insights and Forecast - By Country/Sub-region
- 12.1.1 China
- 12.1.2 Japan
- 12.1.3 India
- 12.1.4 South Korea
- 12.1.5 Southeast Asia
- 12.1.6 Australia
- 12.1.7 Indonesia
- 12.1.8 Phillipes
- 12.1.9 Singapore
- 12.1.10 Thailandc
- 12.1.11 Rest of Asia Pacific
- 13. South America Quillaia Extract Market Analysis, Insights and Forecast, 2019-2031
- 13.1. Market Analysis, Insights and Forecast - By Country/Sub-region
- 13.1.1 Brazil
- 13.1.2 Argentina
- 13.1.3 Peru
- 13.1.4 Chile
- 13.1.5 Colombia
- 13.1.6 Ecuador
- 13.1.7 Venezuela
- 13.1.8 Rest of South America
- 14. North America Quillaia Extract Market Analysis, Insights and Forecast, 2019-2031
- 14.1. Market Analysis, Insights and Forecast - By Country/Sub-region
- 14.1.1 United States
- 14.1.2 Canada
- 14.1.3 Mexico
- 15. MEA Quillaia Extract Market Analysis, Insights and Forecast, 2019-2031
- 15.1. Market Analysis, Insights and Forecast - By Country/Sub-region
- 15.1.1 United Arab Emirates
- 15.1.2 Saudi Arabia
- 15.1.3 South Africa
- 15.1.4 Rest of Middle East and Africa
- 16. Competitive Analysis
- 16.1. Global Market Share Analysis 2024
- 16.2. Company Profiles
- 16.2.1 Shaanxi Pioneer Biotech Co Ltd
- 16.2.1.1. Overview
- 16.2.1.2. Products
- 16.2.1.3. SWOT Analysis
- 16.2.1.4. Recent Developments
- 16.2.1.5. Financials (Based on Availability)
- 16.2.2 Garuda International Inc
- 16.2.2.1. Overview
- 16.2.2.2. Products
- 16.2.2.3. SWOT Analysis
- 16.2.2.4. Recent Developments
- 16.2.2.5. Financials (Based on Availability)
- 16.2.3 Plantae Labs (for feed and agriculture)*List Not Exhaustive
- 16.2.3.1. Overview
- 16.2.3.2. Products
- 16.2.3.3. SWOT Analysis
- 16.2.3.4. Recent Developments
- 16.2.3.5. Financials (Based on Availability)
- 16.2.4 Givaudan SA
- 16.2.4.1. Overview
- 16.2.4.2. Products
- 16.2.4.3. SWOT Analysis
- 16.2.4.4. Recent Developments
- 16.2.4.5. Financials (Based on Availability)
- 16.2.5 QUILLAJA GREEN BIOSOLUTIONS
- 16.2.5.1. Overview
- 16.2.5.2. Products
- 16.2.5.3. SWOT Analysis
- 16.2.5.4. Recent Developments
- 16.2.5.5. Financials (Based on Availability)
- 16.2.6 Desert King
- 16.2.6.1. Overview
- 16.2.6.2. Products
- 16.2.6.3. SWOT Analysis
- 16.2.6.4. Recent Developments
- 16.2.6.5. Financials (Based on Availability)
- 16.2.7 Ingredion Incorporated
- 16.2.7.1. Overview
- 16.2.7.2. Products
- 16.2.7.3. SWOT Analysis
- 16.2.7.4. Recent Developments
- 16.2.7.5. Financials (Based on Availability)
- 16.2.8 Baja Yucca Company
- 16.2.8.1. Overview
- 16.2.8.2. Products
- 16.2.8.3. SWOT Analysis
- 16.2.8.4. Recent Developments
- 16.2.8.5. Financials (Based on Availability)
- 16.2.9 Brenntag AG
- 16.2.9.1. Overview
- 16.2.9.2. Products
- 16.2.9.3. SWOT Analysis
- 16.2.9.4. Recent Developments
- 16.2.9.5. Financials (Based on Availability)
- 16.2.10 StanChem Inc.
- 16.2.10.1. Overview
- 16.2.10.2. Products
- 16.2.10.3. SWOT Analysis
- 16.2.10.4. Recent Developments
- 16.2.10.5. Financials (Based on Availability)
- 16.2.1 Shaanxi Pioneer Biotech Co Ltd
List of Figures
- Figure 1: Global Quillaia Extract Market Revenue Breakdown (Million, %) by Region 2024 & 2032
- Figure 2: Global Quillaia Extract Market Volume Breakdown (K Tons, %) by Region 2024 & 2032
- Figure 3: North America Quillaia Extract Market Revenue (Million), by Country 2024 & 2032
- Figure 4: North America Quillaia Extract Market Volume (K Tons), by Country 2024 & 2032
- Figure 5: North America Quillaia Extract Market Revenue Share (%), by Country 2024 & 2032
- Figure 6: North America Quillaia Extract Market Volume Share (%), by Country 2024 & 2032
- Figure 7: Europe Quillaia Extract Market Revenue (Million), by Country 2024 & 2032
- Figure 8: Europe Quillaia Extract Market Volume (K Tons), by Country 2024 & 2032
- Figure 9: Europe Quillaia Extract Market Revenue Share (%), by Country 2024 & 2032
- Figure 10: Europe Quillaia Extract Market Volume Share (%), by Country 2024 & 2032
- Figure 11: Asia Pacific Quillaia Extract Market Revenue (Million), by Country 2024 & 2032
- Figure 12: Asia Pacific Quillaia Extract Market Volume (K Tons), by Country 2024 & 2032
- Figure 13: Asia Pacific Quillaia Extract Market Revenue Share (%), by Country 2024 & 2032
- Figure 14: Asia Pacific Quillaia Extract Market Volume Share (%), by Country 2024 & 2032
- Figure 15: South America Quillaia Extract Market Revenue (Million), by Country 2024 & 2032
- Figure 16: South America Quillaia Extract Market Volume (K Tons), by Country 2024 & 2032
- Figure 17: South America Quillaia Extract Market Revenue Share (%), by Country 2024 & 2032
- Figure 18: South America Quillaia Extract Market Volume Share (%), by Country 2024 & 2032
- Figure 19: North America Quillaia Extract Market Revenue (Million), by Country 2024 & 2032
- Figure 20: North America Quillaia Extract Market Volume (K Tons), by Country 2024 & 2032
- Figure 21: North America Quillaia Extract Market Revenue Share (%), by Country 2024 & 2032
- Figure 22: North America Quillaia Extract Market Volume Share (%), by Country 2024 & 2032
- Figure 23: MEA Quillaia Extract Market Revenue (Million), by Country 2024 & 2032
- Figure 24: MEA Quillaia Extract Market Volume (K Tons), by Country 2024 & 2032
- Figure 25: MEA Quillaia Extract Market Revenue Share (%), by Country 2024 & 2032
- Figure 26: MEA Quillaia Extract Market Volume Share (%), by Country 2024 & 2032
- Figure 27: North America Quillaia Extract Market Revenue (Million), by Form 2024 & 2032
- Figure 28: North America Quillaia Extract Market Volume (K Tons), by Form 2024 & 2032
- Figure 29: North America Quillaia Extract Market Revenue Share (%), by Form 2024 & 2032
- Figure 30: North America Quillaia Extract Market Volume Share (%), by Form 2024 & 2032
- Figure 31: North America Quillaia Extract Market Revenue (Million), by Application 2024 & 2032
- Figure 32: North America Quillaia Extract Market Volume (K Tons), by Application 2024 & 2032
- Figure 33: North America Quillaia Extract Market Revenue Share (%), by Application 2024 & 2032
- Figure 34: North America Quillaia Extract Market Volume Share (%), by Application 2024 & 2032
- Figure 35: North America Quillaia Extract Market Revenue (Million), by Country 2024 & 2032
- Figure 36: North America Quillaia Extract Market Volume (K Tons), by Country 2024 & 2032
- Figure 37: North America Quillaia Extract Market Revenue Share (%), by Country 2024 & 2032
- Figure 38: North America Quillaia Extract Market Volume Share (%), by Country 2024 & 2032
- Figure 39: Europe Quillaia Extract Market Revenue (Million), by Form 2024 & 2032
- Figure 40: Europe Quillaia Extract Market Volume (K Tons), by Form 2024 & 2032
- Figure 41: Europe Quillaia Extract Market Revenue Share (%), by Form 2024 & 2032
- Figure 42: Europe Quillaia Extract Market Volume Share (%), by Form 2024 & 2032
- Figure 43: Europe Quillaia Extract Market Revenue (Million), by Application 2024 & 2032
- Figure 44: Europe Quillaia Extract Market Volume (K Tons), by Application 2024 & 2032
- Figure 45: Europe Quillaia Extract Market Revenue Share (%), by Application 2024 & 2032
- Figure 46: Europe Quillaia Extract Market Volume Share (%), by Application 2024 & 2032
- Figure 47: Europe Quillaia Extract Market Revenue (Million), by Country 2024 & 2032
- Figure 48: Europe Quillaia Extract Market Volume (K Tons), by Country 2024 & 2032
- Figure 49: Europe Quillaia Extract Market Revenue Share (%), by Country 2024 & 2032
- Figure 50: Europe Quillaia Extract Market Volume Share (%), by Country 2024 & 2032
- Figure 51: Asia Pacific Quillaia Extract Market Revenue (Million), by Form 2024 & 2032
- Figure 52: Asia Pacific Quillaia Extract Market Volume (K Tons), by Form 2024 & 2032
- Figure 53: Asia Pacific Quillaia Extract Market Revenue Share (%), by Form 2024 & 2032
- Figure 54: Asia Pacific Quillaia Extract Market Volume Share (%), by Form 2024 & 2032
- Figure 55: Asia Pacific Quillaia Extract Market Revenue (Million), by Application 2024 & 2032
- Figure 56: Asia Pacific Quillaia Extract Market Volume (K Tons), by Application 2024 & 2032
- Figure 57: Asia Pacific Quillaia Extract Market Revenue Share (%), by Application 2024 & 2032
- Figure 58: Asia Pacific Quillaia Extract Market Volume Share (%), by Application 2024 & 2032
- Figure 59: Asia Pacific Quillaia Extract Market Revenue (Million), by Country 2024 & 2032
- Figure 60: Asia Pacific Quillaia Extract Market Volume (K Tons), by Country 2024 & 2032
- Figure 61: Asia Pacific Quillaia Extract Market Revenue Share (%), by Country 2024 & 2032
- Figure 62: Asia Pacific Quillaia Extract Market Volume Share (%), by Country 2024 & 2032
- Figure 63: Rest of the World Quillaia Extract Market Revenue (Million), by Form 2024 & 2032
- Figure 64: Rest of the World Quillaia Extract Market Volume (K Tons), by Form 2024 & 2032
- Figure 65: Rest of the World Quillaia Extract Market Revenue Share (%), by Form 2024 & 2032
- Figure 66: Rest of the World Quillaia Extract Market Volume Share (%), by Form 2024 & 2032
- Figure 67: Rest of the World Quillaia Extract Market Revenue (Million), by Application 2024 & 2032
- Figure 68: Rest of the World Quillaia Extract Market Volume (K Tons), by Application 2024 & 2032
- Figure 69: Rest of the World Quillaia Extract Market Revenue Share (%), by Application 2024 & 2032
- Figure 70: Rest of the World Quillaia Extract Market Volume Share (%), by Application 2024 & 2032
- Figure 71: Rest of the World Quillaia Extract Market Revenue (Million), by Country 2024 & 2032
- Figure 72: Rest of the World Quillaia Extract Market Volume (K Tons), by Country 2024 & 2032
- Figure 73: Rest of the World Quillaia Extract Market Revenue Share (%), by Country 2024 & 2032
- Figure 74: Rest of the World Quillaia Extract Market Volume Share (%), by Country 2024 & 2032
List of Tables
- Table 1: Global Quillaia Extract Market Revenue Million Forecast, by Region 2019 & 2032
- Table 2: Global Quillaia Extract Market Volume K Tons Forecast, by Region 2019 & 2032
- Table 3: Global Quillaia Extract Market Revenue Million Forecast, by Form 2019 & 2032
- Table 4: Global Quillaia Extract Market Volume K Tons Forecast, by Form 2019 & 2032
- Table 5: Global Quillaia Extract Market Revenue Million Forecast, by Application 2019 & 2032
- Table 6: Global Quillaia Extract Market Volume K Tons Forecast, by Application 2019 & 2032
- Table 7: Global Quillaia Extract Market Revenue Million Forecast, by Region 2019 & 2032
- Table 8: Global Quillaia Extract Market Volume K Tons Forecast, by Region 2019 & 2032
- Table 9: Global Quillaia Extract Market Revenue Million Forecast, by Country 2019 & 2032
- Table 10: Global Quillaia Extract Market Volume K Tons Forecast, by Country 2019 & 2032
- Table 11: United States Quillaia Extract Market Revenue (Million) Forecast, by Application 2019 & 2032
- Table 12: United States Quillaia Extract Market Volume (K Tons) Forecast, by Application 2019 & 2032
- Table 13: Canada Quillaia Extract Market Revenue (Million) Forecast, by Application 2019 & 2032
- Table 14: Canada Quillaia Extract Market Volume (K Tons) Forecast, by Application 2019 & 2032
- Table 15: Mexico Quillaia Extract Market Revenue (Million) Forecast, by Application 2019 & 2032
- Table 16: Mexico Quillaia Extract Market Volume (K Tons) Forecast, by Application 2019 & 2032
- Table 17: Global Quillaia Extract Market Revenue Million Forecast, by Country 2019 & 2032
- Table 18: Global Quillaia Extract Market Volume K Tons Forecast, by Country 2019 & 2032
- Table 19: Germany Quillaia Extract Market Revenue (Million) Forecast, by Application 2019 & 2032
- Table 20: Germany Quillaia Extract Market Volume (K Tons) Forecast, by Application 2019 & 2032
- Table 21: United Kingdom Quillaia Extract Market Revenue (Million) Forecast, by Application 2019 & 2032
- Table 22: United Kingdom Quillaia Extract Market Volume (K Tons) Forecast, by Application 2019 & 2032
- Table 23: France Quillaia Extract Market Revenue (Million) Forecast, by Application 2019 & 2032
- Table 24: France Quillaia Extract Market Volume (K Tons) Forecast, by Application 2019 & 2032
- Table 25: Spain Quillaia Extract Market Revenue (Million) Forecast, by Application 2019 & 2032
- Table 26: Spain Quillaia Extract Market Volume (K Tons) Forecast, by Application 2019 & 2032
- Table 27: Italy Quillaia Extract Market Revenue (Million) Forecast, by Application 2019 & 2032
- Table 28: Italy Quillaia Extract Market Volume (K Tons) Forecast, by Application 2019 & 2032
- Table 29: Spain Quillaia Extract Market Revenue (Million) Forecast, by Application 2019 & 2032
- Table 30: Spain Quillaia Extract Market Volume (K Tons) Forecast, by Application 2019 & 2032
- Table 31: Belgium Quillaia Extract Market Revenue (Million) Forecast, by Application 2019 & 2032
- Table 32: Belgium Quillaia Extract Market Volume (K Tons) Forecast, by Application 2019 & 2032
- Table 33: Netherland Quillaia Extract Market Revenue (Million) Forecast, by Application 2019 & 2032
- Table 34: Netherland Quillaia Extract Market Volume (K Tons) Forecast, by Application 2019 & 2032
- Table 35: Nordics Quillaia Extract Market Revenue (Million) Forecast, by Application 2019 & 2032
- Table 36: Nordics Quillaia Extract Market Volume (K Tons) Forecast, by Application 2019 & 2032
- Table 37: Rest of Europe Quillaia Extract Market Revenue (Million) Forecast, by Application 2019 & 2032
- Table 38: Rest of Europe Quillaia Extract Market Volume (K Tons) Forecast, by Application 2019 & 2032
- Table 39: Global Quillaia Extract Market Revenue Million Forecast, by Country 2019 & 2032
- Table 40: Global Quillaia Extract Market Volume K Tons Forecast, by Country 2019 & 2032
- Table 41: China Quillaia Extract Market Revenue (Million) Forecast, by Application 2019 & 2032
- Table 42: China Quillaia Extract Market Volume (K Tons) Forecast, by Application 2019 & 2032
- Table 43: Japan Quillaia Extract Market Revenue (Million) Forecast, by Application 2019 & 2032
- Table 44: Japan Quillaia Extract Market Volume (K Tons) Forecast, by Application 2019 & 2032
- Table 45: India Quillaia Extract Market Revenue (Million) Forecast, by Application 2019 & 2032
- Table 46: India Quillaia Extract Market Volume (K Tons) Forecast, by Application 2019 & 2032
- Table 47: South Korea Quillaia Extract Market Revenue (Million) Forecast, by Application 2019 & 2032
- Table 48: South Korea Quillaia Extract Market Volume (K Tons) Forecast, by Application 2019 & 2032
- Table 49: Southeast Asia Quillaia Extract Market Revenue (Million) Forecast, by Application 2019 & 2032
- Table 50: Southeast Asia Quillaia Extract Market Volume (K Tons) Forecast, by Application 2019 & 2032
- Table 51: Australia Quillaia Extract Market Revenue (Million) Forecast, by Application 2019 & 2032
- Table 52: Australia Quillaia Extract Market Volume (K Tons) Forecast, by Application 2019 & 2032
- Table 53: Indonesia Quillaia Extract Market Revenue (Million) Forecast, by Application 2019 & 2032
- Table 54: Indonesia Quillaia Extract Market Volume (K Tons) Forecast, by Application 2019 & 2032
- Table 55: Phillipes Quillaia Extract Market Revenue (Million) Forecast, by Application 2019 & 2032
- Table 56: Phillipes Quillaia Extract Market Volume (K Tons) Forecast, by Application 2019 & 2032
- Table 57: Singapore Quillaia Extract Market Revenue (Million) Forecast, by Application 2019 & 2032
- Table 58: Singapore Quillaia Extract Market Volume (K Tons) Forecast, by Application 2019 & 2032
- Table 59: Thailandc Quillaia Extract Market Revenue (Million) Forecast, by Application 2019 & 2032
- Table 60: Thailandc Quillaia Extract Market Volume (K Tons) Forecast, by Application 2019 & 2032
- Table 61: Rest of Asia Pacific Quillaia Extract Market Revenue (Million) Forecast, by Application 2019 & 2032
- Table 62: Rest of Asia Pacific Quillaia Extract Market Volume (K Tons) Forecast, by Application 2019 & 2032
- Table 63: Global Quillaia Extract Market Revenue Million Forecast, by Country 2019 & 2032
- Table 64: Global Quillaia Extract Market Volume K Tons Forecast, by Country 2019 & 2032
- Table 65: Brazil Quillaia Extract Market Revenue (Million) Forecast, by Application 2019 & 2032
- Table 66: Brazil Quillaia Extract Market Volume (K Tons) Forecast, by Application 2019 & 2032
- Table 67: Argentina Quillaia Extract Market Revenue (Million) Forecast, by Application 2019 & 2032
- Table 68: Argentina Quillaia Extract Market Volume (K Tons) Forecast, by Application 2019 & 2032
- Table 69: Peru Quillaia Extract Market Revenue (Million) Forecast, by Application 2019 & 2032
- Table 70: Peru Quillaia Extract Market Volume (K Tons) Forecast, by Application 2019 & 2032
- Table 71: Chile Quillaia Extract Market Revenue (Million) Forecast, by Application 2019 & 2032
- Table 72: Chile Quillaia Extract Market Volume (K Tons) Forecast, by Application 2019 & 2032
- Table 73: Colombia Quillaia Extract Market Revenue (Million) Forecast, by Application 2019 & 2032
- Table 74: Colombia Quillaia Extract Market Volume (K Tons) Forecast, by Application 2019 & 2032
- Table 75: Ecuador Quillaia Extract Market Revenue (Million) Forecast, by Application 2019 & 2032
- Table 76: Ecuador Quillaia Extract Market Volume (K Tons) Forecast, by Application 2019 & 2032
- Table 77: Venezuela Quillaia Extract Market Revenue (Million) Forecast, by Application 2019 & 2032
- Table 78: Venezuela Quillaia Extract Market Volume (K Tons) Forecast, by Application 2019 & 2032
- Table 79: Rest of South America Quillaia Extract Market Revenue (Million) Forecast, by Application 2019 & 2032
- Table 80: Rest of South America Quillaia Extract Market Volume (K Tons) Forecast, by Application 2019 & 2032
- Table 81: Global Quillaia Extract Market Revenue Million Forecast, by Country 2019 & 2032
- Table 82: Global Quillaia Extract Market Volume K Tons Forecast, by Country 2019 & 2032
- Table 83: United States Quillaia Extract Market Revenue (Million) Forecast, by Application 2019 & 2032
- Table 84: United States Quillaia Extract Market Volume (K Tons) Forecast, by Application 2019 & 2032
- Table 85: Canada Quillaia Extract Market Revenue (Million) Forecast, by Application 2019 & 2032
- Table 86: Canada Quillaia Extract Market Volume (K Tons) Forecast, by Application 2019 & 2032
- Table 87: Mexico Quillaia Extract Market Revenue (Million) Forecast, by Application 2019 & 2032
- Table 88: Mexico Quillaia Extract Market Volume (K Tons) Forecast, by Application 2019 & 2032
- Table 89: Global Quillaia Extract Market Revenue Million Forecast, by Country 2019 & 2032
- Table 90: Global Quillaia Extract Market Volume K Tons Forecast, by Country 2019 & 2032
- Table 91: United Arab Emirates Quillaia Extract Market Revenue (Million) Forecast, by Application 2019 & 2032
- Table 92: United Arab Emirates Quillaia Extract Market Volume (K Tons) Forecast, by Application 2019 & 2032
- Table 93: Saudi Arabia Quillaia Extract Market Revenue (Million) Forecast, by Application 2019 & 2032
- Table 94: Saudi Arabia Quillaia Extract Market Volume (K Tons) Forecast, by Application 2019 & 2032
- Table 95: South Africa Quillaia Extract Market Revenue (Million) Forecast, by Application 2019 & 2032
- Table 96: South Africa Quillaia Extract Market Volume (K Tons) Forecast, by Application 2019 & 2032
- Table 97: Rest of Middle East and Africa Quillaia Extract Market Revenue (Million) Forecast, by Application 2019 & 2032
- Table 98: Rest of Middle East and Africa Quillaia Extract Market Volume (K Tons) Forecast, by Application 2019 & 2032
- Table 99: Global Quillaia Extract Market Revenue Million Forecast, by Form 2019 & 2032
- Table 100: Global Quillaia Extract Market Volume K Tons Forecast, by Form 2019 & 2032
- Table 101: Global Quillaia Extract Market Revenue Million Forecast, by Application 2019 & 2032
- Table 102: Global Quillaia Extract Market Volume K Tons Forecast, by Application 2019 & 2032
- Table 103: Global Quillaia Extract Market Revenue Million Forecast, by Country 2019 & 2032
- Table 104: Global Quillaia Extract Market Volume K Tons Forecast, by Country 2019 & 2032
- Table 105: United States Quillaia Extract Market Revenue (Million) Forecast, by Application 2019 & 2032
- Table 106: United States Quillaia Extract Market Volume (K Tons) Forecast, by Application 2019 & 2032
- Table 107: Canada Quillaia Extract Market Revenue (Million) Forecast, by Application 2019 & 2032
- Table 108: Canada Quillaia Extract Market Volume (K Tons) Forecast, by Application 2019 & 2032
- Table 109: Mexico Quillaia Extract Market Revenue (Million) Forecast, by Application 2019 & 2032
- Table 110: Mexico Quillaia Extract Market Volume (K Tons) Forecast, by Application 2019 & 2032
- Table 111: Rest of North America Quillaia Extract Market Revenue (Million) Forecast, by Application 2019 & 2032
- Table 112: Rest of North America Quillaia Extract Market Volume (K Tons) Forecast, by Application 2019 & 2032
- Table 113: Global Quillaia Extract Market Revenue Million Forecast, by Form 2019 & 2032
- Table 114: Global Quillaia Extract Market Volume K Tons Forecast, by Form 2019 & 2032
- Table 115: Global Quillaia Extract Market Revenue Million Forecast, by Application 2019 & 2032
- Table 116: Global Quillaia Extract Market Volume K Tons Forecast, by Application 2019 & 2032
- Table 117: Global Quillaia Extract Market Revenue Million Forecast, by Country 2019 & 2032
- Table 118: Global Quillaia Extract Market Volume K Tons Forecast, by Country 2019 & 2032
- Table 119: Germany Quillaia Extract Market Revenue (Million) Forecast, by Application 2019 & 2032
- Table 120: Germany Quillaia Extract Market Volume (K Tons) Forecast, by Application 2019 & 2032
- Table 121: United Kingdom Quillaia Extract Market Revenue (Million) Forecast, by Application 2019 & 2032
- Table 122: United Kingdom Quillaia Extract Market Volume (K Tons) Forecast, by Application 2019 & 2032
- Table 123: France Quillaia Extract Market Revenue (Million) Forecast, by Application 2019 & 2032
- Table 124: France Quillaia Extract Market Volume (K Tons) Forecast, by Application 2019 & 2032
- Table 125: Italy Quillaia Extract Market Revenue (Million) Forecast, by Application 2019 & 2032
- Table 126: Italy Quillaia Extract Market Volume (K Tons) Forecast, by Application 2019 & 2032
- Table 127: Russia Quillaia Extract Market Revenue (Million) Forecast, by Application 2019 & 2032
- Table 128: Russia Quillaia Extract Market Volume (K Tons) Forecast, by Application 2019 & 2032
- Table 129: Spain Quillaia Extract Market Revenue (Million) Forecast, by Application 2019 & 2032
- Table 130: Spain Quillaia Extract Market Volume (K Tons) Forecast, by Application 2019 & 2032
- Table 131: Rest of Europe Quillaia Extract Market Revenue (Million) Forecast, by Application 2019 & 2032
- Table 132: Rest of Europe Quillaia Extract Market Volume (K Tons) Forecast, by Application 2019 & 2032
- Table 133: Global Quillaia Extract Market Revenue Million Forecast, by Form 2019 & 2032
- Table 134: Global Quillaia Extract Market Volume K Tons Forecast, by Form 2019 & 2032
- Table 135: Global Quillaia Extract Market Revenue Million Forecast, by Application 2019 & 2032
- Table 136: Global Quillaia Extract Market Volume K Tons Forecast, by Application 2019 & 2032
- Table 137: Global Quillaia Extract Market Revenue Million Forecast, by Country 2019 & 2032
- Table 138: Global Quillaia Extract Market Volume K Tons Forecast, by Country 2019 & 2032
- Table 139: China Quillaia Extract Market Revenue (Million) Forecast, by Application 2019 & 2032
- Table 140: China Quillaia Extract Market Volume (K Tons) Forecast, by Application 2019 & 2032
- Table 141: Japan Quillaia Extract Market Revenue (Million) Forecast, by Application 2019 & 2032
- Table 142: Japan Quillaia Extract Market Volume (K Tons) Forecast, by Application 2019 & 2032
- Table 143: India Quillaia Extract Market Revenue (Million) Forecast, by Application 2019 & 2032
- Table 144: India Quillaia Extract Market Volume (K Tons) Forecast, by Application 2019 & 2032
- Table 145: Australia Quillaia Extract Market Revenue (Million) Forecast, by Application 2019 & 2032
- Table 146: Australia Quillaia Extract Market Volume (K Tons) Forecast, by Application 2019 & 2032
- Table 147: Rest of Asia Pacific Quillaia Extract Market Revenue (Million) Forecast, by Application 2019 & 2032
- Table 148: Rest of Asia Pacific Quillaia Extract Market Volume (K Tons) Forecast, by Application 2019 & 2032
- Table 149: Global Quillaia Extract Market Revenue Million Forecast, by Form 2019 & 2032
- Table 150: Global Quillaia Extract Market Volume K Tons Forecast, by Form 2019 & 2032
- Table 151: Global Quillaia Extract Market Revenue Million Forecast, by Application 2019 & 2032
- Table 152: Global Quillaia Extract Market Volume K Tons Forecast, by Application 2019 & 2032
- Table 153: Global Quillaia Extract Market Revenue Million Forecast, by Country 2019 & 2032
- Table 154: Global Quillaia Extract Market Volume K Tons Forecast, by Country 2019 & 2032
- Table 155: South America Quillaia Extract Market Revenue (Million) Forecast, by Application 2019 & 2032
- Table 156: South America Quillaia Extract Market Volume (K Tons) Forecast, by Application 2019 & 2032
- Table 157: Middle East and Africa Quillaia Extract Market Revenue (Million) Forecast, by Application 2019 & 2032
- Table 158: Middle East and Africa Quillaia Extract Market Volume (K Tons) Forecast, by Application 2019 & 2032
Frequently Asked Questions
1. What is the projected Compound Annual Growth Rate (CAGR) of the Quillaia Extract Market?
The projected CAGR is approximately 6.88%.
2. Which companies are prominent players in the Quillaia Extract Market?
Key companies in the market include Shaanxi Pioneer Biotech Co Ltd, Garuda International Inc, Plantae Labs (for feed and agriculture)*List Not Exhaustive, Givaudan SA, QUILLAJA GREEN BIOSOLUTIONS, Desert King, Ingredion Incorporated, Baja Yucca Company, Brenntag AG , StanChem, Inc..
3. What are the main segments of the Quillaia Extract Market?
The market segments include Form, Application.
4. Can you provide details about the market size?
The market size is estimated to be USD 887.90 Million as of 2022.
5. What are some drivers contributing to market growth?
Increasing application of Gelatin in healthcare and pharmaceutical sector.
6. What are the notable trends driving market growth?
Role of Specialty Food Ingredients in Processed Food Industry.
7. Are there any restraints impacting market growth?
Rising demand for clean label products.
8. Can you provide examples of recent developments in the market?
Acquisition of Desert King by Ingredion Incorporated in 2023
9. What pricing options are available for accessing the report?
Pricing options include single-user, multi-user, and enterprise licenses priced at USD 4750, USD 5250, and USD 8750 respectively.
10. Is the market size provided in terms of value or volume?
The market size is provided in terms of value, measured in Million and volume, measured in K Tons.
11. Are there any specific market keywords associated with the report?
Yes, the market keyword associated with the report is "Quillaia Extract Market," which aids in identifying and referencing the specific market segment covered.
12. How do I determine which pricing option suits my needs best?
The pricing options vary based on user requirements and access needs. Individual users may opt for single-user licenses, while businesses requiring broader access may choose multi-user or enterprise licenses for cost-effective access to the report.
13. Are there any additional resources or data provided in the Quillaia Extract Market report?
While the report offers comprehensive insights, it's advisable to review the specific contents or supplementary materials provided to ascertain if additional resources or data are available.
14. How can I stay updated on further developments or reports in the Quillaia Extract Market?
To stay informed about further developments, trends, and reports in the Quillaia Extract Market, consider subscribing to industry newsletters, following relevant companies and organizations, or regularly checking reputable industry news sources and publications.
Methodology
Step 1 - Identification of Relevant Samples Size from Population Database


Step 2 - Approaches for Defining Global Market Size (Value, Volume* & Price*)

Note*: In applicable scenarios
Step 3 - Data Sources
Primary Research
- Web Analytics
- Survey Reports
- Research Institute
- Latest Research Reports
- Opinion Leaders
Secondary Research
- Annual Reports
- White Paper
- Latest Press Release
- Industry Association
- Paid Database
- Investor Presentations

Step 4 - Data Triangulation
Involves using different sources of information in order to increase the validity of a study
These sources are likely to be stakeholders in a program - participants, other researchers, program staff, other community members, and so on.
Then we put all data in single framework & apply various statistical tools to find out the dynamic on the market.
During the analysis stage, feedback from the stakeholder groups would be compared to determine areas of agreement as well as areas of divergence


