
Key Insights
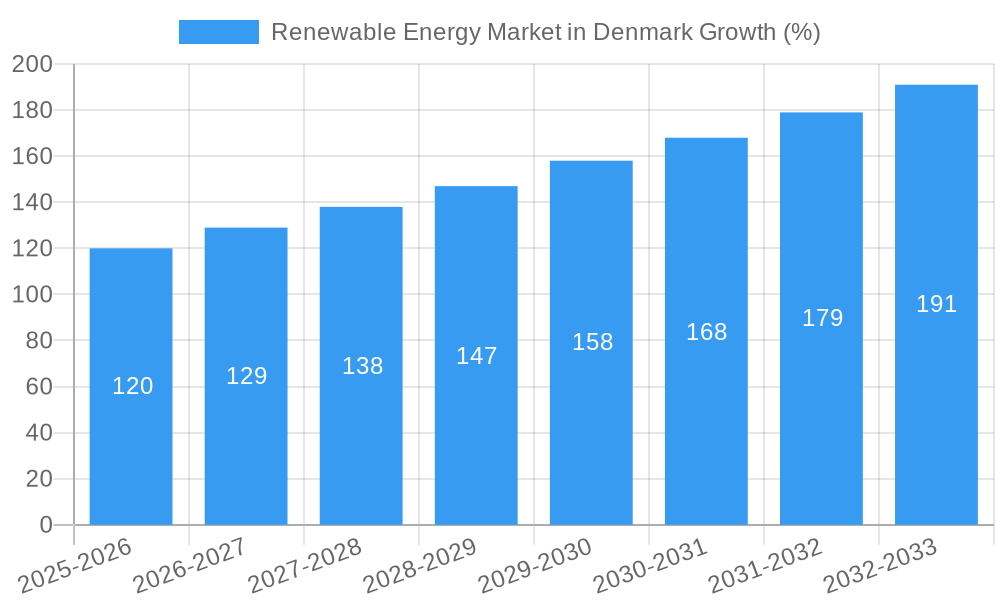
The Danish renewable energy market, exhibiting a robust CAGR exceeding 8% from 2019 to 2024, is poised for continued expansion through 2033. Driven by stringent environmental policies, a commitment to carbon neutrality, and significant investments in renewable energy infrastructure, the market is witnessing substantial growth across various segments. Solar and wind power dominate the landscape, primarily fueling electricity generation. However, increasing applications in heating and cooling, alongside burgeoning electric vehicle adoption, are driving diversification within the sector. Key players like Ørsted, Siemens Gamesa, and Vestas Wind Systems are at the forefront of this expansion, leveraging technological advancements and strategic partnerships to capitalize on market opportunities. The market's growth is further supported by government incentives, such as feed-in tariffs and tax breaks, encouraging private investment and fostering innovation. While challenges such as grid integration and land availability exist, the overall outlook remains optimistic, with a projected significant increase in market value over the forecast period.
The market segmentation reveals a clear emphasis on solar and wind energy, underpinned by Denmark's geographical advantages and established expertise in these areas. The "Other Types" segment, encompassing geothermal and biomass, while currently smaller, is expected to witness growth driven by technological advancements and diversification strategies. The application-based segmentation highlights the transition towards a more sustainable energy system, with electricity generation remaining the primary focus, complemented by increasing contributions from heating and cooling, and transportation sectors. The concentration of major players underscores the competitive yet collaborative nature of the market, with companies focusing on technological leadership, cost optimization, and strategic acquisitions to maintain a leading position. The continued focus on research and development will be crucial in further enhancing the efficiency and sustainability of renewable energy sources, thereby bolstering the market's trajectory.
Renewable Energy Market in Denmark: A Comprehensive Report (2019-2033)
This in-depth report provides a comprehensive analysis of the renewable energy market in Denmark, covering the period from 2019 to 2033. It offers valuable insights into market dynamics, key players, emerging trends, and future growth prospects, making it an essential resource for industry professionals, investors, and policymakers. The report leverages robust data and analysis, incorporating key developments and forecasts to provide a clear picture of this dynamic sector.
Renewable Energy Market in Denmark Market Structure & Innovation Trends
This section analyzes the structure and innovation trends within Denmark's renewable energy market from 2019-2024 and projects to 2033. We examine market concentration, identifying key players such as Ørsted AS, Vestas Wind Systems AS, and Siemens Gamesa Renewable Energy SA and their respective market shares. We also explore innovation drivers, including government policies, technological advancements, and R&D investments. The regulatory framework governing renewable energy deployment in Denmark is analyzed, alongside a discussion of substitute products and their impact on market competition. Finally, the report examines end-user demographics and the influence of M&A activities, detailing notable deals and their financial implications. For example, the xx Billion DKK investment in the artificial energy island project highlights significant investment in the sector. The report also details the impact of technological innovations, such as advancements in wind turbine technology and the increasing efficiency of solar panels, on the market. The analysis incorporates metrics like market share, M&A deal values, and analyses of investment trends.
Renewable Energy Market in Denmark Market Dynamics & Trends
This section delves into the market dynamics and trends shaping Denmark's renewable energy sector. We analyze market growth drivers, including rising energy demand, increasing environmental concerns, and supportive government policies. The report examines technological disruptions, like the integration of smart grids and energy storage solutions, and their impact on market growth. Consumer preferences, particularly the growing demand for sustainable energy sources, are also assessed. The competitive landscape is explored, highlighting the strategies employed by key players and their impact on market share. The compound annual growth rate (CAGR) and market penetration rates for various renewable energy technologies are presented, providing a quantifiable measure of market performance and future projections. This section provides a detailed look at how these factors have shaped the market from 2019 to 2024 and projects their impact until 2033.
Dominant Regions & Segments in Renewable Energy Market in Denmark
This section identifies the leading regions and segments within Denmark's renewable energy market. The report analyses dominance in terms of both renewable energy type (Solar, Wind, Other) and application (Electricity generation, Heating and cooling, Transportation).
Wind Energy Dominance: Wind energy is the dominant segment, driven by:
- Favorable wind resources.
- Substantial government support (including the large-scale artificial island project).
- Technological advancements in turbine technology.
- Strong presence of major players like Ørsted and Vestas.
Electricity Generation: The primary application of renewable energy is electricity generation, due to:
- High demand for electricity.
- Relatively mature infrastructure for grid integration.
- Supportive regulatory framework for renewable electricity generation.
Further analysis explores regional variations within Denmark, highlighting the specific factors driving renewable energy adoption in different areas. This section offers granular detail on the market size, growth projections, and competitive dynamics for each dominant segment and region.
Renewable Energy Market in Denmark Product Innovations
Recent product developments in Denmark's renewable energy market focus on increased efficiency, reduced costs, and improved integration with existing energy infrastructure. Advancements in wind turbine design, including larger rotor diameters and improved blade aerodynamics, are enhancing energy output. Solar panel technology is witnessing advancements in efficiency and durability. The development of innovative energy storage solutions, like battery technology, is addressing the intermittency of renewable energy sources. These innovations are improving the market fit of renewable energy and strengthening the competitive landscape.
Report Scope & Segmentation Analysis
This report segments the Danish renewable energy market by type (Solar, Wind, Other) and application (Electricity generation, Heating and cooling, Transportation).
By Type:
Wind: This segment is projected to maintain significant growth due to ongoing investments in offshore wind farms and government support. Market size data and competitive landscape analysis will be included.
Solar: Solar power is experiencing growth driven by declining costs and technological improvements. The report will present market size, growth projections, and a competitive analysis.
Other: This category includes biomass, geothermal, and hydropower, and will be analyzed for its current market size, future projections and competitive landscape.
By Application:
Each application segment (Electricity generation, Heating and cooling, Transportation) will be analyzed for market size, growth projections, and competitive dynamics within that application.
Key Drivers of Renewable Energy Market in Denmark Growth
The growth of Denmark's renewable energy market is propelled by several key factors. Stringent environmental regulations promote renewable energy adoption. Government incentives, such as feed-in tariffs and tax breaks, provide economic support for renewable energy projects. Technological advancements continually improve the efficiency and cost-effectiveness of renewable technologies. Public awareness and consumer preference for environmentally friendly energy sources are also driving demand. The ambitious goal of achieving carbon neutrality further stimulates investment and development.
Challenges in the Renewable Energy Market in Denmark Sector
Despite significant progress, the Danish renewable energy sector faces challenges. Intermittency of renewable energy sources poses a challenge for grid stability. Grid infrastructure limitations can hinder the integration of large-scale renewable energy projects. The high initial investment costs of renewable energy projects can present a barrier to entry for some investors. Competition from traditional fossil fuel sources also continues to impact market dynamics. The report quantifies the impact of these challenges on market growth.
Emerging Opportunities in Renewable Energy Market in Denmark
Several emerging opportunities exist within the Danish renewable energy market. The increasing integration of renewable energy into transportation and heating sectors presents a major growth area. Further development of smart grids and energy storage technologies is crucial for optimizing renewable energy integration. The development of innovative business models, such as community-owned renewable energy projects, opens avenues for increased participation and local engagement. The focus on green hydrogen production and utilization presents a significant future opportunity.
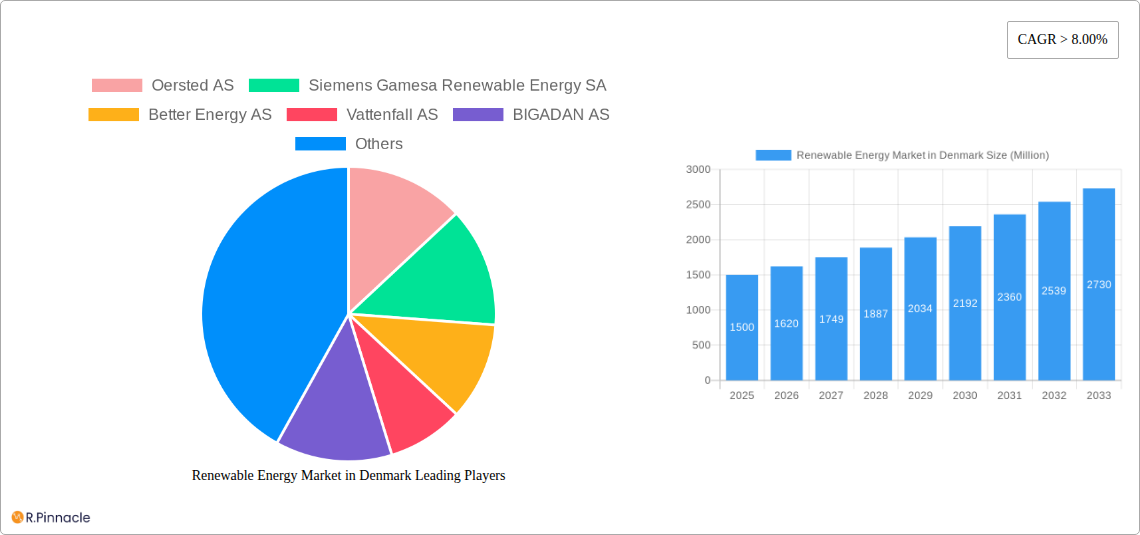
Leading Players in the Renewable Energy Market in Denmark Market
- Ørsted AS
- Siemens Gamesa Renewable Energy SA
- Better Energy AS
- Vattenfall AS
- BIGADAN AS
- Arcon-Sunmark AS
- Vestas Wind Systems AS
Key Developments in Renewable Energy Market in Denmark Industry
- 2022: Denmark's government commits to a majority stake in a GBP 25 Billion artificial 'energy island' project.
- 2023: The first phase of the artificial island wind energy hub project, costing approximately DKK 210 Billion, commences.
- Ongoing: The Alfa Laval Test & Training Centre in Aalborg leads efforts to reduce maritime greenhouse gas emissions by 2050, testing biofuels like those from MASH Energy.
Future Outlook for Renewable Energy Market in Denmark Market
The future of Denmark's renewable energy market looks bright. Continued government support, technological innovation, and increasing consumer demand will drive market growth. The successful implementation of large-scale projects, such as the artificial energy island, will significantly increase renewable energy capacity. The integration of renewable energy into various sectors and the development of new technologies will create further opportunities. The market is poised for sustained growth, driven by strong policy support and technological advancements.
Renewable Energy Market in Denmark Segmentation
-
1. Type
- 1.1. Solar
- 1.2. Wind
- 1.3. Other Types
Renewable Energy Market in Denmark Segmentation By Geography
-
1. North America
- 1.1. United States
- 1.2. Canada
- 1.3. Mexico
-
2. South America
- 2.1. Brazil
- 2.2. Argentina
- 2.3. Rest of South America
-
3. Europe
- 3.1. United Kingdom
- 3.2. Germany
- 3.3. France
- 3.4. Italy
- 3.5. Spain
- 3.6. Russia
- 3.7. Benelux
- 3.8. Nordics
- 3.9. Rest of Europe
-
4. Middle East & Africa
- 4.1. Turkey
- 4.2. Israel
- 4.3. GCC
- 4.4. North Africa
- 4.5. South Africa
- 4.6. Rest of Middle East & Africa
-
5. Asia Pacific
- 5.1. China
- 5.2. India
- 5.3. Japan
- 5.4. South Korea
- 5.5. ASEAN
- 5.6. Oceania
- 5.7. Rest of Asia Pacific
Renewable Energy Market in Denmark REPORT HIGHLIGHTS
| Aspects | Details |
|---|---|
| Study Period | 2019-2033 |
| Base Year | 2024 |
| Estimated Year | 2025 |
| Forecast Period | 2025-2033 |
| Historical Period | 2019-2024 |
| Growth Rate | CAGR of > 8.00% from 2019-2033 |
| Segmentation |
|
Table of Contents
- 1. Introduction
- 1.1. Research Scope
- 1.2. Market Segmentation
- 1.3. Research Methodology
- 1.4. Definitions and Assumptions
- 2. Executive Summary
- 2.1. Introduction
- 3. Market Dynamics
- 3.1. Introduction
- 3.2. Market Drivers
- 3.2.1. 4.; Declining Cost Of Wind Power Generation4.; Supportive Government Policies
- 3.3. Market Restrains
- 3.3.1. 4.; Penetration Of Solar Energy And Gas-Fired Power Plants
- 3.4. Market Trends
- 3.4.1. Wind Energy to Dominate the Market
- 4. Market Factor Analysis
- 4.1. Porters Five Forces
- 4.2. Supply/Value Chain
- 4.3. PESTEL analysis
- 4.4. Market Entropy
- 4.5. Patent/Trademark Analysis
- 5. Global Renewable Energy Market in Denmark Analysis, Insights and Forecast, 2019-2031
- 5.1. Market Analysis, Insights and Forecast - by Type
- 5.1.1. Solar
- 5.1.2. Wind
- 5.1.3. Other Types
- 5.2. Market Analysis, Insights and Forecast - by Region
- 5.2.1. North America
- 5.2.2. South America
- 5.2.3. Europe
- 5.2.4. Middle East & Africa
- 5.2.5. Asia Pacific
- 5.1. Market Analysis, Insights and Forecast - by Type
- 6. North America Renewable Energy Market in Denmark Analysis, Insights and Forecast, 2019-2031
- 6.1. Market Analysis, Insights and Forecast - by Type
- 6.1.1. Solar
- 6.1.2. Wind
- 6.1.3. Other Types
- 6.1. Market Analysis, Insights and Forecast - by Type
- 7. South America Renewable Energy Market in Denmark Analysis, Insights and Forecast, 2019-2031
- 7.1. Market Analysis, Insights and Forecast - by Type
- 7.1.1. Solar
- 7.1.2. Wind
- 7.1.3. Other Types
- 7.1. Market Analysis, Insights and Forecast - by Type
- 8. Europe Renewable Energy Market in Denmark Analysis, Insights and Forecast, 2019-2031
- 8.1. Market Analysis, Insights and Forecast - by Type
- 8.1.1. Solar
- 8.1.2. Wind
- 8.1.3. Other Types
- 8.1. Market Analysis, Insights and Forecast - by Type
- 9. Middle East & Africa Renewable Energy Market in Denmark Analysis, Insights and Forecast, 2019-2031
- 9.1. Market Analysis, Insights and Forecast - by Type
- 9.1.1. Solar
- 9.1.2. Wind
- 9.1.3. Other Types
- 9.1. Market Analysis, Insights and Forecast - by Type
- 10. Asia Pacific Renewable Energy Market in Denmark Analysis, Insights and Forecast, 2019-2031
- 10.1. Market Analysis, Insights and Forecast - by Type
- 10.1.1. Solar
- 10.1.2. Wind
- 10.1.3. Other Types
- 10.1. Market Analysis, Insights and Forecast - by Type
- 11. Competitive Analysis
- 11.1. Global Market Share Analysis 2024
- 11.2. Company Profiles
- 11.2.1 Oersted AS
- 11.2.1.1. Overview
- 11.2.1.2. Products
- 11.2.1.3. SWOT Analysis
- 11.2.1.4. Recent Developments
- 11.2.1.5. Financials (Based on Availability)
- 11.2.2 Siemens Gamesa Renewable Energy SA
- 11.2.2.1. Overview
- 11.2.2.2. Products
- 11.2.2.3. SWOT Analysis
- 11.2.2.4. Recent Developments
- 11.2.2.5. Financials (Based on Availability)
- 11.2.3 Better Energy AS
- 11.2.3.1. Overview
- 11.2.3.2. Products
- 11.2.3.3. SWOT Analysis
- 11.2.3.4. Recent Developments
- 11.2.3.5. Financials (Based on Availability)
- 11.2.4 Vattenfall AS
- 11.2.4.1. Overview
- 11.2.4.2. Products
- 11.2.4.3. SWOT Analysis
- 11.2.4.4. Recent Developments
- 11.2.4.5. Financials (Based on Availability)
- 11.2.5 BIGADAN AS
- 11.2.5.1. Overview
- 11.2.5.2. Products
- 11.2.5.3. SWOT Analysis
- 11.2.5.4. Recent Developments
- 11.2.5.5. Financials (Based on Availability)
- 11.2.6 Arcon-Sunmark AS
- 11.2.6.1. Overview
- 11.2.6.2. Products
- 11.2.6.3. SWOT Analysis
- 11.2.6.4. Recent Developments
- 11.2.6.5. Financials (Based on Availability)
- 11.2.7 Vestas Wind Systems AS
- 11.2.7.1. Overview
- 11.2.7.2. Products
- 11.2.7.3. SWOT Analysis
- 11.2.7.4. Recent Developments
- 11.2.7.5. Financials (Based on Availability)
- 11.2.1 Oersted AS
List of Figures
- Figure 1: Global Renewable Energy Market in Denmark Revenue Breakdown (Million, %) by Region 2024 & 2032
- Figure 2: Global Renewable Energy Market in Denmark Volume Breakdown (gigawatt, %) by Region 2024 & 2032
- Figure 3: Denmark Renewable Energy Market in Denmark Revenue (Million), by Country 2024 & 2032
- Figure 4: Denmark Renewable Energy Market in Denmark Volume (gigawatt), by Country 2024 & 2032
- Figure 5: Denmark Renewable Energy Market in Denmark Revenue Share (%), by Country 2024 & 2032
- Figure 6: Denmark Renewable Energy Market in Denmark Volume Share (%), by Country 2024 & 2032
- Figure 7: North America Renewable Energy Market in Denmark Revenue (Million), by Type 2024 & 2032
- Figure 8: North America Renewable Energy Market in Denmark Volume (gigawatt), by Type 2024 & 2032
- Figure 9: North America Renewable Energy Market in Denmark Revenue Share (%), by Type 2024 & 2032
- Figure 10: North America Renewable Energy Market in Denmark Volume Share (%), by Type 2024 & 2032
- Figure 11: North America Renewable Energy Market in Denmark Revenue (Million), by Country 2024 & 2032
- Figure 12: North America Renewable Energy Market in Denmark Volume (gigawatt), by Country 2024 & 2032
- Figure 13: North America Renewable Energy Market in Denmark Revenue Share (%), by Country 2024 & 2032
- Figure 14: North America Renewable Energy Market in Denmark Volume Share (%), by Country 2024 & 2032
- Figure 15: South America Renewable Energy Market in Denmark Revenue (Million), by Type 2024 & 2032
- Figure 16: South America Renewable Energy Market in Denmark Volume (gigawatt), by Type 2024 & 2032
- Figure 17: South America Renewable Energy Market in Denmark Revenue Share (%), by Type 2024 & 2032
- Figure 18: South America Renewable Energy Market in Denmark Volume Share (%), by Type 2024 & 2032
- Figure 19: South America Renewable Energy Market in Denmark Revenue (Million), by Country 2024 & 2032
- Figure 20: South America Renewable Energy Market in Denmark Volume (gigawatt), by Country 2024 & 2032
- Figure 21: South America Renewable Energy Market in Denmark Revenue Share (%), by Country 2024 & 2032
- Figure 22: South America Renewable Energy Market in Denmark Volume Share (%), by Country 2024 & 2032
- Figure 23: Europe Renewable Energy Market in Denmark Revenue (Million), by Type 2024 & 2032
- Figure 24: Europe Renewable Energy Market in Denmark Volume (gigawatt), by Type 2024 & 2032
- Figure 25: Europe Renewable Energy Market in Denmark Revenue Share (%), by Type 2024 & 2032
- Figure 26: Europe Renewable Energy Market in Denmark Volume Share (%), by Type 2024 & 2032
- Figure 27: Europe Renewable Energy Market in Denmark Revenue (Million), by Country 2024 & 2032
- Figure 28: Europe Renewable Energy Market in Denmark Volume (gigawatt), by Country 2024 & 2032
- Figure 29: Europe Renewable Energy Market in Denmark Revenue Share (%), by Country 2024 & 2032
- Figure 30: Europe Renewable Energy Market in Denmark Volume Share (%), by Country 2024 & 2032
- Figure 31: Middle East & Africa Renewable Energy Market in Denmark Revenue (Million), by Type 2024 & 2032
- Figure 32: Middle East & Africa Renewable Energy Market in Denmark Volume (gigawatt), by Type 2024 & 2032
- Figure 33: Middle East & Africa Renewable Energy Market in Denmark Revenue Share (%), by Type 2024 & 2032
- Figure 34: Middle East & Africa Renewable Energy Market in Denmark Volume Share (%), by Type 2024 & 2032
- Figure 35: Middle East & Africa Renewable Energy Market in Denmark Revenue (Million), by Country 2024 & 2032
- Figure 36: Middle East & Africa Renewable Energy Market in Denmark Volume (gigawatt), by Country 2024 & 2032
- Figure 37: Middle East & Africa Renewable Energy Market in Denmark Revenue Share (%), by Country 2024 & 2032
- Figure 38: Middle East & Africa Renewable Energy Market in Denmark Volume Share (%), by Country 2024 & 2032
- Figure 39: Asia Pacific Renewable Energy Market in Denmark Revenue (Million), by Type 2024 & 2032
- Figure 40: Asia Pacific Renewable Energy Market in Denmark Volume (gigawatt), by Type 2024 & 2032
- Figure 41: Asia Pacific Renewable Energy Market in Denmark Revenue Share (%), by Type 2024 & 2032
- Figure 42: Asia Pacific Renewable Energy Market in Denmark Volume Share (%), by Type 2024 & 2032
- Figure 43: Asia Pacific Renewable Energy Market in Denmark Revenue (Million), by Country 2024 & 2032
- Figure 44: Asia Pacific Renewable Energy Market in Denmark Volume (gigawatt), by Country 2024 & 2032
- Figure 45: Asia Pacific Renewable Energy Market in Denmark Revenue Share (%), by Country 2024 & 2032
- Figure 46: Asia Pacific Renewable Energy Market in Denmark Volume Share (%), by Country 2024 & 2032
List of Tables
- Table 1: Global Renewable Energy Market in Denmark Revenue Million Forecast, by Region 2019 & 2032
- Table 2: Global Renewable Energy Market in Denmark Volume gigawatt Forecast, by Region 2019 & 2032
- Table 3: Global Renewable Energy Market in Denmark Revenue Million Forecast, by Type 2019 & 2032
- Table 4: Global Renewable Energy Market in Denmark Volume gigawatt Forecast, by Type 2019 & 2032
- Table 5: Global Renewable Energy Market in Denmark Revenue Million Forecast, by Region 2019 & 2032
- Table 6: Global Renewable Energy Market in Denmark Volume gigawatt Forecast, by Region 2019 & 2032
- Table 7: Global Renewable Energy Market in Denmark Revenue Million Forecast, by Country 2019 & 2032
- Table 8: Global Renewable Energy Market in Denmark Volume gigawatt Forecast, by Country 2019 & 2032
- Table 9: Global Renewable Energy Market in Denmark Revenue Million Forecast, by Type 2019 & 2032
- Table 10: Global Renewable Energy Market in Denmark Volume gigawatt Forecast, by Type 2019 & 2032
- Table 11: Global Renewable Energy Market in Denmark Revenue Million Forecast, by Country 2019 & 2032
- Table 12: Global Renewable Energy Market in Denmark Volume gigawatt Forecast, by Country 2019 & 2032
- Table 13: United States Renewable Energy Market in Denmark Revenue (Million) Forecast, by Application 2019 & 2032
- Table 14: United States Renewable Energy Market in Denmark Volume (gigawatt) Forecast, by Application 2019 & 2032
- Table 15: Canada Renewable Energy Market in Denmark Revenue (Million) Forecast, by Application 2019 & 2032
- Table 16: Canada Renewable Energy Market in Denmark Volume (gigawatt) Forecast, by Application 2019 & 2032
- Table 17: Mexico Renewable Energy Market in Denmark Revenue (Million) Forecast, by Application 2019 & 2032
- Table 18: Mexico Renewable Energy Market in Denmark Volume (gigawatt) Forecast, by Application 2019 & 2032
- Table 19: Global Renewable Energy Market in Denmark Revenue Million Forecast, by Type 2019 & 2032
- Table 20: Global Renewable Energy Market in Denmark Volume gigawatt Forecast, by Type 2019 & 2032
- Table 21: Global Renewable Energy Market in Denmark Revenue Million Forecast, by Country 2019 & 2032
- Table 22: Global Renewable Energy Market in Denmark Volume gigawatt Forecast, by Country 2019 & 2032
- Table 23: Brazil Renewable Energy Market in Denmark Revenue (Million) Forecast, by Application 2019 & 2032
- Table 24: Brazil Renewable Energy Market in Denmark Volume (gigawatt) Forecast, by Application 2019 & 2032
- Table 25: Argentina Renewable Energy Market in Denmark Revenue (Million) Forecast, by Application 2019 & 2032
- Table 26: Argentina Renewable Energy Market in Denmark Volume (gigawatt) Forecast, by Application 2019 & 2032
- Table 27: Rest of South America Renewable Energy Market in Denmark Revenue (Million) Forecast, by Application 2019 & 2032
- Table 28: Rest of South America Renewable Energy Market in Denmark Volume (gigawatt) Forecast, by Application 2019 & 2032
- Table 29: Global Renewable Energy Market in Denmark Revenue Million Forecast, by Type 2019 & 2032
- Table 30: Global Renewable Energy Market in Denmark Volume gigawatt Forecast, by Type 2019 & 2032
- Table 31: Global Renewable Energy Market in Denmark Revenue Million Forecast, by Country 2019 & 2032
- Table 32: Global Renewable Energy Market in Denmark Volume gigawatt Forecast, by Country 2019 & 2032
- Table 33: United Kingdom Renewable Energy Market in Denmark Revenue (Million) Forecast, by Application 2019 & 2032
- Table 34: United Kingdom Renewable Energy Market in Denmark Volume (gigawatt) Forecast, by Application 2019 & 2032
- Table 35: Germany Renewable Energy Market in Denmark Revenue (Million) Forecast, by Application 2019 & 2032
- Table 36: Germany Renewable Energy Market in Denmark Volume (gigawatt) Forecast, by Application 2019 & 2032
- Table 37: France Renewable Energy Market in Denmark Revenue (Million) Forecast, by Application 2019 & 2032
- Table 38: France Renewable Energy Market in Denmark Volume (gigawatt) Forecast, by Application 2019 & 2032
- Table 39: Italy Renewable Energy Market in Denmark Revenue (Million) Forecast, by Application 2019 & 2032
- Table 40: Italy Renewable Energy Market in Denmark Volume (gigawatt) Forecast, by Application 2019 & 2032
- Table 41: Spain Renewable Energy Market in Denmark Revenue (Million) Forecast, by Application 2019 & 2032
- Table 42: Spain Renewable Energy Market in Denmark Volume (gigawatt) Forecast, by Application 2019 & 2032
- Table 43: Russia Renewable Energy Market in Denmark Revenue (Million) Forecast, by Application 2019 & 2032
- Table 44: Russia Renewable Energy Market in Denmark Volume (gigawatt) Forecast, by Application 2019 & 2032
- Table 45: Benelux Renewable Energy Market in Denmark Revenue (Million) Forecast, by Application 2019 & 2032
- Table 46: Benelux Renewable Energy Market in Denmark Volume (gigawatt) Forecast, by Application 2019 & 2032
- Table 47: Nordics Renewable Energy Market in Denmark Revenue (Million) Forecast, by Application 2019 & 2032
- Table 48: Nordics Renewable Energy Market in Denmark Volume (gigawatt) Forecast, by Application 2019 & 2032
- Table 49: Rest of Europe Renewable Energy Market in Denmark Revenue (Million) Forecast, by Application 2019 & 2032
- Table 50: Rest of Europe Renewable Energy Market in Denmark Volume (gigawatt) Forecast, by Application 2019 & 2032
- Table 51: Global Renewable Energy Market in Denmark Revenue Million Forecast, by Type 2019 & 2032
- Table 52: Global Renewable Energy Market in Denmark Volume gigawatt Forecast, by Type 2019 & 2032
- Table 53: Global Renewable Energy Market in Denmark Revenue Million Forecast, by Country 2019 & 2032
- Table 54: Global Renewable Energy Market in Denmark Volume gigawatt Forecast, by Country 2019 & 2032
- Table 55: Turkey Renewable Energy Market in Denmark Revenue (Million) Forecast, by Application 2019 & 2032
- Table 56: Turkey Renewable Energy Market in Denmark Volume (gigawatt) Forecast, by Application 2019 & 2032
- Table 57: Israel Renewable Energy Market in Denmark Revenue (Million) Forecast, by Application 2019 & 2032
- Table 58: Israel Renewable Energy Market in Denmark Volume (gigawatt) Forecast, by Application 2019 & 2032
- Table 59: GCC Renewable Energy Market in Denmark Revenue (Million) Forecast, by Application 2019 & 2032
- Table 60: GCC Renewable Energy Market in Denmark Volume (gigawatt) Forecast, by Application 2019 & 2032
- Table 61: North Africa Renewable Energy Market in Denmark Revenue (Million) Forecast, by Application 2019 & 2032
- Table 62: North Africa Renewable Energy Market in Denmark Volume (gigawatt) Forecast, by Application 2019 & 2032
- Table 63: South Africa Renewable Energy Market in Denmark Revenue (Million) Forecast, by Application 2019 & 2032
- Table 64: South Africa Renewable Energy Market in Denmark Volume (gigawatt) Forecast, by Application 2019 & 2032
- Table 65: Rest of Middle East & Africa Renewable Energy Market in Denmark Revenue (Million) Forecast, by Application 2019 & 2032
- Table 66: Rest of Middle East & Africa Renewable Energy Market in Denmark Volume (gigawatt) Forecast, by Application 2019 & 2032
- Table 67: Global Renewable Energy Market in Denmark Revenue Million Forecast, by Type 2019 & 2032
- Table 68: Global Renewable Energy Market in Denmark Volume gigawatt Forecast, by Type 2019 & 2032
- Table 69: Global Renewable Energy Market in Denmark Revenue Million Forecast, by Country 2019 & 2032
- Table 70: Global Renewable Energy Market in Denmark Volume gigawatt Forecast, by Country 2019 & 2032
- Table 71: China Renewable Energy Market in Denmark Revenue (Million) Forecast, by Application 2019 & 2032
- Table 72: China Renewable Energy Market in Denmark Volume (gigawatt) Forecast, by Application 2019 & 2032
- Table 73: India Renewable Energy Market in Denmark Revenue (Million) Forecast, by Application 2019 & 2032
- Table 74: India Renewable Energy Market in Denmark Volume (gigawatt) Forecast, by Application 2019 & 2032
- Table 75: Japan Renewable Energy Market in Denmark Revenue (Million) Forecast, by Application 2019 & 2032
- Table 76: Japan Renewable Energy Market in Denmark Volume (gigawatt) Forecast, by Application 2019 & 2032
- Table 77: South Korea Renewable Energy Market in Denmark Revenue (Million) Forecast, by Application 2019 & 2032
- Table 78: South Korea Renewable Energy Market in Denmark Volume (gigawatt) Forecast, by Application 2019 & 2032
- Table 79: ASEAN Renewable Energy Market in Denmark Revenue (Million) Forecast, by Application 2019 & 2032
- Table 80: ASEAN Renewable Energy Market in Denmark Volume (gigawatt) Forecast, by Application 2019 & 2032
- Table 81: Oceania Renewable Energy Market in Denmark Revenue (Million) Forecast, by Application 2019 & 2032
- Table 82: Oceania Renewable Energy Market in Denmark Volume (gigawatt) Forecast, by Application 2019 & 2032
- Table 83: Rest of Asia Pacific Renewable Energy Market in Denmark Revenue (Million) Forecast, by Application 2019 & 2032
- Table 84: Rest of Asia Pacific Renewable Energy Market in Denmark Volume (gigawatt) Forecast, by Application 2019 & 2032
Frequently Asked Questions
1. What is the projected Compound Annual Growth Rate (CAGR) of the Renewable Energy Market in Denmark?
The projected CAGR is approximately > 8.00%.
2. Which companies are prominent players in the Renewable Energy Market in Denmark?
Key companies in the market include Oersted AS, Siemens Gamesa Renewable Energy SA, Better Energy AS, Vattenfall AS, BIGADAN AS, Arcon-Sunmark AS, Vestas Wind Systems AS.
3. What are the main segments of the Renewable Energy Market in Denmark?
The market segments include Type.
4. Can you provide details about the market size?
The market size is estimated to be USD XX Million as of 2022.
5. What are some drivers contributing to market growth?
4.; Declining Cost Of Wind Power Generation4.; Supportive Government Policies.
6. What are the notable trends driving market growth?
Wind Energy to Dominate the Market.
7. Are there any restraints impacting market growth?
4.; Penetration Of Solar Energy And Gas-Fired Power Plants.
8. Can you provide examples of recent developments in the market?
Denmark is expected to construct an artificial island as a wind energy hub. The construction project, believed to be the biggest in Danish history, will link hundreds of wind turbines to deliver enough electricity for millions of households. The first phase of the project is expected to cost around 210 billion Danish crowns.
9. What pricing options are available for accessing the report?
Pricing options include single-user, multi-user, and enterprise licenses priced at USD 3800, USD 4500, and USD 5800 respectively.
10. Is the market size provided in terms of value or volume?
The market size is provided in terms of value, measured in Million and volume, measured in gigawatt.
11. Are there any specific market keywords associated with the report?
Yes, the market keyword associated with the report is "Renewable Energy Market in Denmark," which aids in identifying and referencing the specific market segment covered.
12. How do I determine which pricing option suits my needs best?
The pricing options vary based on user requirements and access needs. Individual users may opt for single-user licenses, while businesses requiring broader access may choose multi-user or enterprise licenses for cost-effective access to the report.
13. Are there any additional resources or data provided in the Renewable Energy Market in Denmark report?
While the report offers comprehensive insights, it's advisable to review the specific contents or supplementary materials provided to ascertain if additional resources or data are available.
14. How can I stay updated on further developments or reports in the Renewable Energy Market in Denmark?
To stay informed about further developments, trends, and reports in the Renewable Energy Market in Denmark, consider subscribing to industry newsletters, following relevant companies and organizations, or regularly checking reputable industry news sources and publications.
Methodology
Step 1 - Identification of Relevant Samples Size from Population Database


Step 2 - Approaches for Defining Global Market Size (Value, Volume* & Price*)

Note*: In applicable scenarios
Step 3 - Data Sources
Primary Research
- Web Analytics
- Survey Reports
- Research Institute
- Latest Research Reports
- Opinion Leaders
Secondary Research
- Annual Reports
- White Paper
- Latest Press Release
- Industry Association
- Paid Database
- Investor Presentations

Step 4 - Data Triangulation
Involves using different sources of information in order to increase the validity of a study
These sources are likely to be stakeholders in a program - participants, other researchers, program staff, other community members, and so on.
Then we put all data in single framework & apply various statistical tools to find out the dynamic on the market.
During the analysis stage, feedback from the stakeholder groups would be compared to determine areas of agreement as well as areas of divergence


