
Key Insights
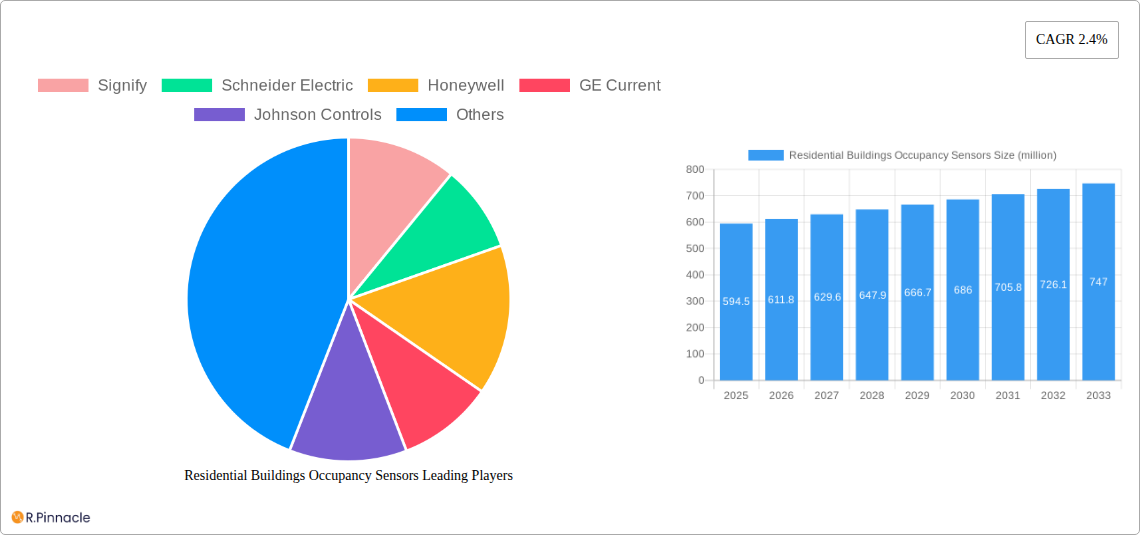
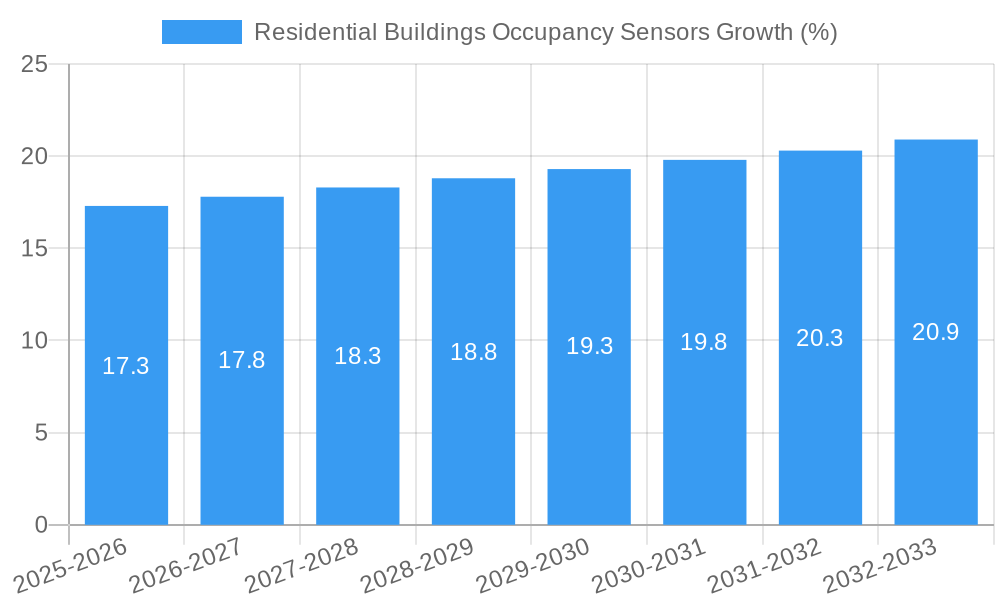
The global market for residential building occupancy sensors is experiencing steady growth, projected to reach $594.5 million in 2025 and maintain a Compound Annual Growth Rate (CAGR) of 2.4% from 2025 to 2033. This growth is driven by increasing demand for energy efficiency solutions, smart home technologies, and enhanced security features in residential buildings. Consumers are increasingly adopting smart home automation systems, integrating occupancy sensors for lighting control, HVAC optimization, and security applications. Furthermore, rising awareness of environmental sustainability and government initiatives promoting energy conservation are contributing to the adoption of these sensors. Key players like Signify, Schneider Electric, Honeywell, and others are driving innovation through the development of advanced sensor technologies, including integration with wireless communication protocols like Zigbee and Z-Wave for seamless connectivity within smart home ecosystems. The market is segmented by sensor type (infrared, ultrasonic, microwave, etc.), technology (wired, wireless), and application (lighting control, HVAC, security). Competition is intense, with established players and emerging companies vying for market share through technological advancements, strategic partnerships, and mergers and acquisitions.
The market's growth trajectory is expected to be influenced by factors such as fluctuating raw material prices, the complexity of installation, and potential privacy concerns related to data collection. However, ongoing technological improvements, decreasing sensor costs, and increasing consumer acceptance of smart home automation are poised to mitigate these challenges. Future growth will be significantly shaped by the development of more sophisticated sensors with improved accuracy and longer lifespans, along with greater integration with other smart home devices and cloud-based platforms. The market’s success hinges on continued technological innovation and effective marketing efforts that highlight the energy-saving and security benefits of occupancy sensors for residential applications. Expansion into emerging markets, particularly in developing countries with growing middle classes and increasing adoption of smart home technologies, will further contribute to future market growth.
Residential Buildings Occupancy Sensors Market Report: 2019-2033
This comprehensive report provides a detailed analysis of the global Residential Buildings Occupancy Sensors market, offering invaluable insights for industry professionals, investors, and strategic decision-makers. The study covers the period from 2019 to 2033, with a focus on the forecast period from 2025 to 2033 and a base year of 2025. The market is projected to reach $xx million by 2033, exhibiting a robust CAGR of xx%. This report leverages extensive primary and secondary research, incorporating data from key players such as Signify, Schneider Electric, Honeywell, GE Current, Johnson Controls, Legrand, Crestron Electronics, Lutron Electronics, Acuity Brands, OPTEX, Leviton Manufacturing Co., Inc, Enerlites, Hubbell, and ATSS.
Residential Buildings Occupancy Sensors Market Structure & Innovation Trends
This section analyzes the competitive landscape, encompassing market concentration, key innovation drivers, regulatory frameworks impacting the industry, prevalent product substitutes, end-user demographics, and significant M&A activities. The market is moderately concentrated, with the top five players holding approximately xx% of the market share in 2025. Several factors are driving innovation, including advancements in sensor technology (e.g., IoT integration, AI-powered analytics), stringent energy efficiency regulations, and increasing consumer demand for smart home solutions. M&A activity has been significant, with deal values exceeding $xx million in the past five years, largely driven by companies seeking to expand their product portfolios and market reach.
- Market Concentration: Moderately concentrated, with top 5 players holding approximately xx% market share (2025).
- Innovation Drivers: Advancements in sensor technology, energy efficiency regulations, growing smart home adoption.
- Regulatory Frameworks: Vary by region, generally promoting energy conservation and smart building technologies.
- Product Substitutes: Limited, primarily other energy-saving technologies with overlapping functionalities.
- End-User Demographics: Growing adoption among homeowners prioritizing energy efficiency and smart home features.
- M&A Activity: Significant activity, with deal values exceeding $xx million over the past five years.
Residential Buildings Occupancy Sensors Market Dynamics & Trends
This section delves into the market's growth drivers, technological disruptions, evolving consumer preferences, and competitive dynamics. The market is experiencing strong growth, fueled by rising energy costs, increasing awareness of energy efficiency, and the expanding adoption of smart home technology. Key technological disruptions include the integration of IoT and AI, enabling more sophisticated occupancy detection and energy management. Consumer preferences are shifting towards more integrated and user-friendly solutions, emphasizing ease of installation and seamless integration with other smart home devices. The competitive landscape is characterized by both established players and emerging entrants, leading to increased innovation and competitive pricing.
Dominant Regions & Segments in Residential Buildings Occupancy Sensors
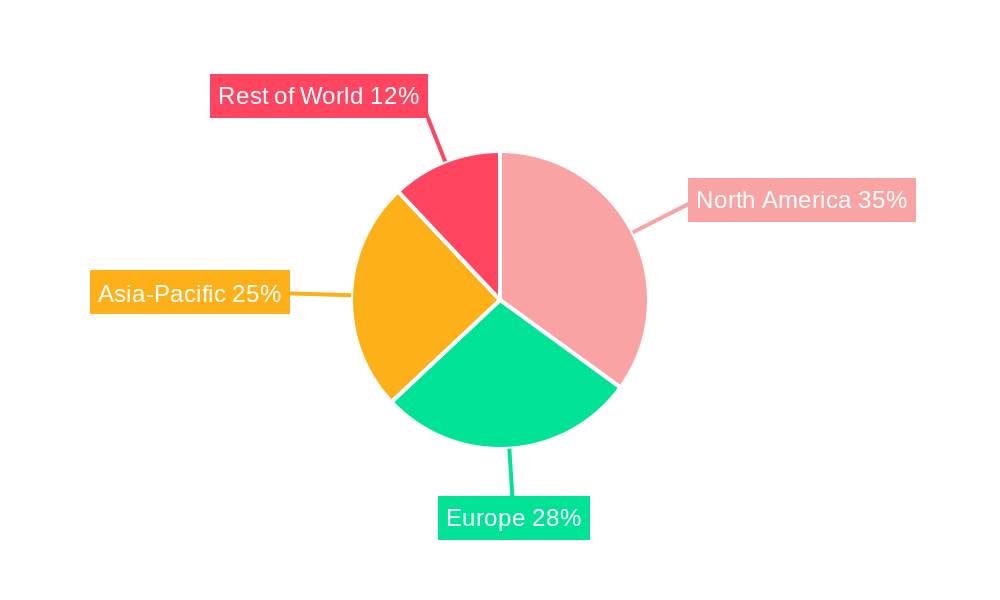
North America currently holds the largest market share, driven by high adoption rates of smart home technology and stringent energy efficiency standards. Factors contributing to this dominance include robust economic conditions, well-developed infrastructure supporting smart home deployments, and supportive government policies promoting energy conservation. The residential segment is the most dominant, accounting for over xx% of the total market in 2025.
- North America Dominance: Driven by high smart home adoption, energy efficiency standards, and economic factors.
- Strong economic conditions supporting technology adoption.
- Well-developed infrastructure for smart home deployment.
- Supportive government policies focused on energy conservation.
- Residential Segment Dominance: High adoption rates due to consumer demand for energy efficiency and smart home integration.
Residential Buildings Occupancy Sensors Product Innovations
Recent innovations focus on improved accuracy, energy efficiency, and integration capabilities. New products are incorporating advanced sensor technologies, such as PIR sensors, ultrasonic sensors, and image sensors, to enhance detection accuracy and reduce false triggers. Emphasis is placed on seamless integration with smart home ecosystems and platforms, enabling remote monitoring and control. This addresses the market need for user-friendly and convenient solutions, driving adoption among consumers.
Report Scope & Segmentation Analysis
This report segments the market by sensor type (PIR, ultrasonic, etc.), communication protocol (Zigbee, Z-Wave, Wi-Fi), application (lighting control, HVAC control, security systems), and region (North America, Europe, Asia-Pacific, etc.). Each segment's growth projections, market size, and competitive dynamics are meticulously analyzed, offering insights into market opportunities and challenges.
Key Drivers of Residential Buildings Occupancy Sensors Growth
Several factors drive the market's growth. Increasing energy costs and growing awareness of energy efficiency are prompting consumers and businesses to adopt energy-saving solutions. Stringent government regulations promoting energy conservation are also driving adoption. The integration of these sensors into smart home systems provides added convenience and functionality, further bolstering demand.
Challenges in the Residential Buildings Occupancy Sensors Sector
Challenges include the high initial cost of installation, concerns about privacy and data security, and the need for robust cybersecurity measures to prevent malicious attacks. Interoperability issues with various smart home platforms and the complexity of integration can also hinder adoption. Supply chain disruptions can impact the availability and pricing of components.
Emerging Opportunities in Residential Buildings Occupancy Sensors
Opportunities exist in the expansion of smart home integration, the development of more sophisticated sensor technologies, and the penetration of emerging markets. The integration of AI and machine learning into occupancy sensing systems can provide enhanced energy efficiency and personalized comfort settings. New markets, particularly in developing economies, present significant growth potential.
Leading Players in the Residential Buildings Occupancy Sensors Market
- Signify
- Schneider Electric
- Honeywell
- GE Current
- Johnson Controls
- Legrand
- Crestron Electronics
- Lutron Electronics
- Acuity Brands
- OPTEX
- Leviton Manufacturing Co.,Inc
- Enerlites
- Hubbell
- ATSS
Key Developments in Residential Buildings Occupancy Sensors Industry
- Jan 2023: Signify launches a new line of occupancy sensors with enhanced AI capabilities.
- Mar 2022: Schneider Electric acquires a smaller occupancy sensor manufacturer, expanding its product portfolio.
- Oct 2021: Honeywell introduces an occupancy sensor integrated with its smart home platform. (Further developments to be added based on available data)
Future Outlook for Residential Buildings Occupancy Sensors Market
The market is poised for continued strong growth, driven by technological advancements, rising energy costs, and the increasing popularity of smart home solutions. Strategic partnerships and acquisitions will shape the competitive landscape, with a focus on innovation and integration capabilities. Opportunities exist for companies to expand their product offerings and penetrate new markets, particularly in developing countries where the adoption of smart home technologies is growing rapidly.
Residential Buildings Occupancy Sensors Segmentation
-
1. Application
- 1.1. Lighting Systems
- 1.2. HVAC Systems
- 1.3. Security and Surveillance Systems
- 1.4. Others
-
2. Types
- 2.1. PIR (Passive Infrared) Sensors
- 2.2. Ultrasonic Sensors
- 2.3. Dual-technology Occupancy Sensors
- 2.4. Others
Residential Buildings Occupancy Sensors Segmentation By Geography
-
1. North America
- 1.1. United States
- 1.2. Canada
- 1.3. Mexico
-
2. South America
- 2.1. Brazil
- 2.2. Argentina
- 2.3. Rest of South America
-
3. Europe
- 3.1. United Kingdom
- 3.2. Germany
- 3.3. France
- 3.4. Italy
- 3.5. Spain
- 3.6. Russia
- 3.7. Benelux
- 3.8. Nordics
- 3.9. Rest of Europe
-
4. Middle East & Africa
- 4.1. Turkey
- 4.2. Israel
- 4.3. GCC
- 4.4. North Africa
- 4.5. South Africa
- 4.6. Rest of Middle East & Africa
-
5. Asia Pacific
- 5.1. China
- 5.2. India
- 5.3. Japan
- 5.4. South Korea
- 5.5. ASEAN
- 5.6. Oceania
- 5.7. Rest of Asia Pacific
Residential Buildings Occupancy Sensors REPORT HIGHLIGHTS
| Aspects | Details |
|---|---|
| Study Period | 2019-2033 |
| Base Year | 2024 |
| Estimated Year | 2025 |
| Forecast Period | 2025-2033 |
| Historical Period | 2019-2024 |
| Growth Rate | CAGR of 2.4% from 2019-2033 |
| Segmentation |
|
Table of Contents
- 1. Introduction
- 1.1. Research Scope
- 1.2. Market Segmentation
- 1.3. Research Methodology
- 1.4. Definitions and Assumptions
- 2. Executive Summary
- 2.1. Introduction
- 3. Market Dynamics
- 3.1. Introduction
- 3.2. Market Drivers
- 3.3. Market Restrains
- 3.4. Market Trends
- 4. Market Factor Analysis
- 4.1. Porters Five Forces
- 4.2. Supply/Value Chain
- 4.3. PESTEL analysis
- 4.4. Market Entropy
- 4.5. Patent/Trademark Analysis
- 5. Global Residential Buildings Occupancy Sensors Analysis, Insights and Forecast, 2019-2031
- 5.1. Market Analysis, Insights and Forecast - by Application
- 5.1.1. Lighting Systems
- 5.1.2. HVAC Systems
- 5.1.3. Security and Surveillance Systems
- 5.1.4. Others
- 5.2. Market Analysis, Insights and Forecast - by Types
- 5.2.1. PIR (Passive Infrared) Sensors
- 5.2.2. Ultrasonic Sensors
- 5.2.3. Dual-technology Occupancy Sensors
- 5.2.4. Others
- 5.3. Market Analysis, Insights and Forecast - by Region
- 5.3.1. North America
- 5.3.2. South America
- 5.3.3. Europe
- 5.3.4. Middle East & Africa
- 5.3.5. Asia Pacific
- 5.1. Market Analysis, Insights and Forecast - by Application
- 6. North America Residential Buildings Occupancy Sensors Analysis, Insights and Forecast, 2019-2031
- 6.1. Market Analysis, Insights and Forecast - by Application
- 6.1.1. Lighting Systems
- 6.1.2. HVAC Systems
- 6.1.3. Security and Surveillance Systems
- 6.1.4. Others
- 6.2. Market Analysis, Insights and Forecast - by Types
- 6.2.1. PIR (Passive Infrared) Sensors
- 6.2.2. Ultrasonic Sensors
- 6.2.3. Dual-technology Occupancy Sensors
- 6.2.4. Others
- 6.1. Market Analysis, Insights and Forecast - by Application
- 7. South America Residential Buildings Occupancy Sensors Analysis, Insights and Forecast, 2019-2031
- 7.1. Market Analysis, Insights and Forecast - by Application
- 7.1.1. Lighting Systems
- 7.1.2. HVAC Systems
- 7.1.3. Security and Surveillance Systems
- 7.1.4. Others
- 7.2. Market Analysis, Insights and Forecast - by Types
- 7.2.1. PIR (Passive Infrared) Sensors
- 7.2.2. Ultrasonic Sensors
- 7.2.3. Dual-technology Occupancy Sensors
- 7.2.4. Others
- 7.1. Market Analysis, Insights and Forecast - by Application
- 8. Europe Residential Buildings Occupancy Sensors Analysis, Insights and Forecast, 2019-2031
- 8.1. Market Analysis, Insights and Forecast - by Application
- 8.1.1. Lighting Systems
- 8.1.2. HVAC Systems
- 8.1.3. Security and Surveillance Systems
- 8.1.4. Others
- 8.2. Market Analysis, Insights and Forecast - by Types
- 8.2.1. PIR (Passive Infrared) Sensors
- 8.2.2. Ultrasonic Sensors
- 8.2.3. Dual-technology Occupancy Sensors
- 8.2.4. Others
- 8.1. Market Analysis, Insights and Forecast - by Application
- 9. Middle East & Africa Residential Buildings Occupancy Sensors Analysis, Insights and Forecast, 2019-2031
- 9.1. Market Analysis, Insights and Forecast - by Application
- 9.1.1. Lighting Systems
- 9.1.2. HVAC Systems
- 9.1.3. Security and Surveillance Systems
- 9.1.4. Others
- 9.2. Market Analysis, Insights and Forecast - by Types
- 9.2.1. PIR (Passive Infrared) Sensors
- 9.2.2. Ultrasonic Sensors
- 9.2.3. Dual-technology Occupancy Sensors
- 9.2.4. Others
- 9.1. Market Analysis, Insights and Forecast - by Application
- 10. Asia Pacific Residential Buildings Occupancy Sensors Analysis, Insights and Forecast, 2019-2031
- 10.1. Market Analysis, Insights and Forecast - by Application
- 10.1.1. Lighting Systems
- 10.1.2. HVAC Systems
- 10.1.3. Security and Surveillance Systems
- 10.1.4. Others
- 10.2. Market Analysis, Insights and Forecast - by Types
- 10.2.1. PIR (Passive Infrared) Sensors
- 10.2.2. Ultrasonic Sensors
- 10.2.3. Dual-technology Occupancy Sensors
- 10.2.4. Others
- 10.1. Market Analysis, Insights and Forecast - by Application
- 11. Competitive Analysis
- 11.1. Global Market Share Analysis 2024
- 11.2. Company Profiles
- 11.2.1 Signify
- 11.2.1.1. Overview
- 11.2.1.2. Products
- 11.2.1.3. SWOT Analysis
- 11.2.1.4. Recent Developments
- 11.2.1.5. Financials (Based on Availability)
- 11.2.2 Schneider Electric
- 11.2.2.1. Overview
- 11.2.2.2. Products
- 11.2.2.3. SWOT Analysis
- 11.2.2.4. Recent Developments
- 11.2.2.5. Financials (Based on Availability)
- 11.2.3 Honeywell
- 11.2.3.1. Overview
- 11.2.3.2. Products
- 11.2.3.3. SWOT Analysis
- 11.2.3.4. Recent Developments
- 11.2.3.5. Financials (Based on Availability)
- 11.2.4 GE Current
- 11.2.4.1. Overview
- 11.2.4.2. Products
- 11.2.4.3. SWOT Analysis
- 11.2.4.4. Recent Developments
- 11.2.4.5. Financials (Based on Availability)
- 11.2.5 Johnson Controls
- 11.2.5.1. Overview
- 11.2.5.2. Products
- 11.2.5.3. SWOT Analysis
- 11.2.5.4. Recent Developments
- 11.2.5.5. Financials (Based on Availability)
- 11.2.6 Legrand
- 11.2.6.1. Overview
- 11.2.6.2. Products
- 11.2.6.3. SWOT Analysis
- 11.2.6.4. Recent Developments
- 11.2.6.5. Financials (Based on Availability)
- 11.2.7 Crestron Electronics
- 11.2.7.1. Overview
- 11.2.7.2. Products
- 11.2.7.3. SWOT Analysis
- 11.2.7.4. Recent Developments
- 11.2.7.5. Financials (Based on Availability)
- 11.2.8 Lutron Electronics
- 11.2.8.1. Overview
- 11.2.8.2. Products
- 11.2.8.3. SWOT Analysis
- 11.2.8.4. Recent Developments
- 11.2.8.5. Financials (Based on Availability)
- 11.2.9 Acuity Brands
- 11.2.9.1. Overview
- 11.2.9.2. Products
- 11.2.9.3. SWOT Analysis
- 11.2.9.4. Recent Developments
- 11.2.9.5. Financials (Based on Availability)
- 11.2.10 OPTEX
- 11.2.10.1. Overview
- 11.2.10.2. Products
- 11.2.10.3. SWOT Analysis
- 11.2.10.4. Recent Developments
- 11.2.10.5. Financials (Based on Availability)
- 11.2.11 Leviton Manufacturing Co.
- 11.2.11.1. Overview
- 11.2.11.2. Products
- 11.2.11.3. SWOT Analysis
- 11.2.11.4. Recent Developments
- 11.2.11.5. Financials (Based on Availability)
- 11.2.12 Inc
- 11.2.12.1. Overview
- 11.2.12.2. Products
- 11.2.12.3. SWOT Analysis
- 11.2.12.4. Recent Developments
- 11.2.12.5. Financials (Based on Availability)
- 11.2.13 Enerlites
- 11.2.13.1. Overview
- 11.2.13.2. Products
- 11.2.13.3. SWOT Analysis
- 11.2.13.4. Recent Developments
- 11.2.13.5. Financials (Based on Availability)
- 11.2.14 Hubbell
- 11.2.14.1. Overview
- 11.2.14.2. Products
- 11.2.14.3. SWOT Analysis
- 11.2.14.4. Recent Developments
- 11.2.14.5. Financials (Based on Availability)
- 11.2.15 ATSS
- 11.2.15.1. Overview
- 11.2.15.2. Products
- 11.2.15.3. SWOT Analysis
- 11.2.15.4. Recent Developments
- 11.2.15.5. Financials (Based on Availability)
- 11.2.1 Signify
List of Figures
- Figure 1: Global Residential Buildings Occupancy Sensors Revenue Breakdown (million, %) by Region 2024 & 2032
- Figure 2: Global Residential Buildings Occupancy Sensors Volume Breakdown (K, %) by Region 2024 & 2032
- Figure 3: North America Residential Buildings Occupancy Sensors Revenue (million), by Application 2024 & 2032
- Figure 4: North America Residential Buildings Occupancy Sensors Volume (K), by Application 2024 & 2032
- Figure 5: North America Residential Buildings Occupancy Sensors Revenue Share (%), by Application 2024 & 2032
- Figure 6: North America Residential Buildings Occupancy Sensors Volume Share (%), by Application 2024 & 2032
- Figure 7: North America Residential Buildings Occupancy Sensors Revenue (million), by Types 2024 & 2032
- Figure 8: North America Residential Buildings Occupancy Sensors Volume (K), by Types 2024 & 2032
- Figure 9: North America Residential Buildings Occupancy Sensors Revenue Share (%), by Types 2024 & 2032
- Figure 10: North America Residential Buildings Occupancy Sensors Volume Share (%), by Types 2024 & 2032
- Figure 11: North America Residential Buildings Occupancy Sensors Revenue (million), by Country 2024 & 2032
- Figure 12: North America Residential Buildings Occupancy Sensors Volume (K), by Country 2024 & 2032
- Figure 13: North America Residential Buildings Occupancy Sensors Revenue Share (%), by Country 2024 & 2032
- Figure 14: North America Residential Buildings Occupancy Sensors Volume Share (%), by Country 2024 & 2032
- Figure 15: South America Residential Buildings Occupancy Sensors Revenue (million), by Application 2024 & 2032
- Figure 16: South America Residential Buildings Occupancy Sensors Volume (K), by Application 2024 & 2032
- Figure 17: South America Residential Buildings Occupancy Sensors Revenue Share (%), by Application 2024 & 2032
- Figure 18: South America Residential Buildings Occupancy Sensors Volume Share (%), by Application 2024 & 2032
- Figure 19: South America Residential Buildings Occupancy Sensors Revenue (million), by Types 2024 & 2032
- Figure 20: South America Residential Buildings Occupancy Sensors Volume (K), by Types 2024 & 2032
- Figure 21: South America Residential Buildings Occupancy Sensors Revenue Share (%), by Types 2024 & 2032
- Figure 22: South America Residential Buildings Occupancy Sensors Volume Share (%), by Types 2024 & 2032
- Figure 23: South America Residential Buildings Occupancy Sensors Revenue (million), by Country 2024 & 2032
- Figure 24: South America Residential Buildings Occupancy Sensors Volume (K), by Country 2024 & 2032
- Figure 25: South America Residential Buildings Occupancy Sensors Revenue Share (%), by Country 2024 & 2032
- Figure 26: South America Residential Buildings Occupancy Sensors Volume Share (%), by Country 2024 & 2032
- Figure 27: Europe Residential Buildings Occupancy Sensors Revenue (million), by Application 2024 & 2032
- Figure 28: Europe Residential Buildings Occupancy Sensors Volume (K), by Application 2024 & 2032
- Figure 29: Europe Residential Buildings Occupancy Sensors Revenue Share (%), by Application 2024 & 2032
- Figure 30: Europe Residential Buildings Occupancy Sensors Volume Share (%), by Application 2024 & 2032
- Figure 31: Europe Residential Buildings Occupancy Sensors Revenue (million), by Types 2024 & 2032
- Figure 32: Europe Residential Buildings Occupancy Sensors Volume (K), by Types 2024 & 2032
- Figure 33: Europe Residential Buildings Occupancy Sensors Revenue Share (%), by Types 2024 & 2032
- Figure 34: Europe Residential Buildings Occupancy Sensors Volume Share (%), by Types 2024 & 2032
- Figure 35: Europe Residential Buildings Occupancy Sensors Revenue (million), by Country 2024 & 2032
- Figure 36: Europe Residential Buildings Occupancy Sensors Volume (K), by Country 2024 & 2032
- Figure 37: Europe Residential Buildings Occupancy Sensors Revenue Share (%), by Country 2024 & 2032
- Figure 38: Europe Residential Buildings Occupancy Sensors Volume Share (%), by Country 2024 & 2032
- Figure 39: Middle East & Africa Residential Buildings Occupancy Sensors Revenue (million), by Application 2024 & 2032
- Figure 40: Middle East & Africa Residential Buildings Occupancy Sensors Volume (K), by Application 2024 & 2032
- Figure 41: Middle East & Africa Residential Buildings Occupancy Sensors Revenue Share (%), by Application 2024 & 2032
- Figure 42: Middle East & Africa Residential Buildings Occupancy Sensors Volume Share (%), by Application 2024 & 2032
- Figure 43: Middle East & Africa Residential Buildings Occupancy Sensors Revenue (million), by Types 2024 & 2032
- Figure 44: Middle East & Africa Residential Buildings Occupancy Sensors Volume (K), by Types 2024 & 2032
- Figure 45: Middle East & Africa Residential Buildings Occupancy Sensors Revenue Share (%), by Types 2024 & 2032
- Figure 46: Middle East & Africa Residential Buildings Occupancy Sensors Volume Share (%), by Types 2024 & 2032
- Figure 47: Middle East & Africa Residential Buildings Occupancy Sensors Revenue (million), by Country 2024 & 2032
- Figure 48: Middle East & Africa Residential Buildings Occupancy Sensors Volume (K), by Country 2024 & 2032
- Figure 49: Middle East & Africa Residential Buildings Occupancy Sensors Revenue Share (%), by Country 2024 & 2032
- Figure 50: Middle East & Africa Residential Buildings Occupancy Sensors Volume Share (%), by Country 2024 & 2032
- Figure 51: Asia Pacific Residential Buildings Occupancy Sensors Revenue (million), by Application 2024 & 2032
- Figure 52: Asia Pacific Residential Buildings Occupancy Sensors Volume (K), by Application 2024 & 2032
- Figure 53: Asia Pacific Residential Buildings Occupancy Sensors Revenue Share (%), by Application 2024 & 2032
- Figure 54: Asia Pacific Residential Buildings Occupancy Sensors Volume Share (%), by Application 2024 & 2032
- Figure 55: Asia Pacific Residential Buildings Occupancy Sensors Revenue (million), by Types 2024 & 2032
- Figure 56: Asia Pacific Residential Buildings Occupancy Sensors Volume (K), by Types 2024 & 2032
- Figure 57: Asia Pacific Residential Buildings Occupancy Sensors Revenue Share (%), by Types 2024 & 2032
- Figure 58: Asia Pacific Residential Buildings Occupancy Sensors Volume Share (%), by Types 2024 & 2032
- Figure 59: Asia Pacific Residential Buildings Occupancy Sensors Revenue (million), by Country 2024 & 2032
- Figure 60: Asia Pacific Residential Buildings Occupancy Sensors Volume (K), by Country 2024 & 2032
- Figure 61: Asia Pacific Residential Buildings Occupancy Sensors Revenue Share (%), by Country 2024 & 2032
- Figure 62: Asia Pacific Residential Buildings Occupancy Sensors Volume Share (%), by Country 2024 & 2032
List of Tables
- Table 1: Global Residential Buildings Occupancy Sensors Revenue million Forecast, by Region 2019 & 2032
- Table 2: Global Residential Buildings Occupancy Sensors Volume K Forecast, by Region 2019 & 2032
- Table 3: Global Residential Buildings Occupancy Sensors Revenue million Forecast, by Application 2019 & 2032
- Table 4: Global Residential Buildings Occupancy Sensors Volume K Forecast, by Application 2019 & 2032
- Table 5: Global Residential Buildings Occupancy Sensors Revenue million Forecast, by Types 2019 & 2032
- Table 6: Global Residential Buildings Occupancy Sensors Volume K Forecast, by Types 2019 & 2032
- Table 7: Global Residential Buildings Occupancy Sensors Revenue million Forecast, by Region 2019 & 2032
- Table 8: Global Residential Buildings Occupancy Sensors Volume K Forecast, by Region 2019 & 2032
- Table 9: Global Residential Buildings Occupancy Sensors Revenue million Forecast, by Application 2019 & 2032
- Table 10: Global Residential Buildings Occupancy Sensors Volume K Forecast, by Application 2019 & 2032
- Table 11: Global Residential Buildings Occupancy Sensors Revenue million Forecast, by Types 2019 & 2032
- Table 12: Global Residential Buildings Occupancy Sensors Volume K Forecast, by Types 2019 & 2032
- Table 13: Global Residential Buildings Occupancy Sensors Revenue million Forecast, by Country 2019 & 2032
- Table 14: Global Residential Buildings Occupancy Sensors Volume K Forecast, by Country 2019 & 2032
- Table 15: United States Residential Buildings Occupancy Sensors Revenue (million) Forecast, by Application 2019 & 2032
- Table 16: United States Residential Buildings Occupancy Sensors Volume (K) Forecast, by Application 2019 & 2032
- Table 17: Canada Residential Buildings Occupancy Sensors Revenue (million) Forecast, by Application 2019 & 2032
- Table 18: Canada Residential Buildings Occupancy Sensors Volume (K) Forecast, by Application 2019 & 2032
- Table 19: Mexico Residential Buildings Occupancy Sensors Revenue (million) Forecast, by Application 2019 & 2032
- Table 20: Mexico Residential Buildings Occupancy Sensors Volume (K) Forecast, by Application 2019 & 2032
- Table 21: Global Residential Buildings Occupancy Sensors Revenue million Forecast, by Application 2019 & 2032
- Table 22: Global Residential Buildings Occupancy Sensors Volume K Forecast, by Application 2019 & 2032
- Table 23: Global Residential Buildings Occupancy Sensors Revenue million Forecast, by Types 2019 & 2032
- Table 24: Global Residential Buildings Occupancy Sensors Volume K Forecast, by Types 2019 & 2032
- Table 25: Global Residential Buildings Occupancy Sensors Revenue million Forecast, by Country 2019 & 2032
- Table 26: Global Residential Buildings Occupancy Sensors Volume K Forecast, by Country 2019 & 2032
- Table 27: Brazil Residential Buildings Occupancy Sensors Revenue (million) Forecast, by Application 2019 & 2032
- Table 28: Brazil Residential Buildings Occupancy Sensors Volume (K) Forecast, by Application 2019 & 2032
- Table 29: Argentina Residential Buildings Occupancy Sensors Revenue (million) Forecast, by Application 2019 & 2032
- Table 30: Argentina Residential Buildings Occupancy Sensors Volume (K) Forecast, by Application 2019 & 2032
- Table 31: Rest of South America Residential Buildings Occupancy Sensors Revenue (million) Forecast, by Application 2019 & 2032
- Table 32: Rest of South America Residential Buildings Occupancy Sensors Volume (K) Forecast, by Application 2019 & 2032
- Table 33: Global Residential Buildings Occupancy Sensors Revenue million Forecast, by Application 2019 & 2032
- Table 34: Global Residential Buildings Occupancy Sensors Volume K Forecast, by Application 2019 & 2032
- Table 35: Global Residential Buildings Occupancy Sensors Revenue million Forecast, by Types 2019 & 2032
- Table 36: Global Residential Buildings Occupancy Sensors Volume K Forecast, by Types 2019 & 2032
- Table 37: Global Residential Buildings Occupancy Sensors Revenue million Forecast, by Country 2019 & 2032
- Table 38: Global Residential Buildings Occupancy Sensors Volume K Forecast, by Country 2019 & 2032
- Table 39: United Kingdom Residential Buildings Occupancy Sensors Revenue (million) Forecast, by Application 2019 & 2032
- Table 40: United Kingdom Residential Buildings Occupancy Sensors Volume (K) Forecast, by Application 2019 & 2032
- Table 41: Germany Residential Buildings Occupancy Sensors Revenue (million) Forecast, by Application 2019 & 2032
- Table 42: Germany Residential Buildings Occupancy Sensors Volume (K) Forecast, by Application 2019 & 2032
- Table 43: France Residential Buildings Occupancy Sensors Revenue (million) Forecast, by Application 2019 & 2032
- Table 44: France Residential Buildings Occupancy Sensors Volume (K) Forecast, by Application 2019 & 2032
- Table 45: Italy Residential Buildings Occupancy Sensors Revenue (million) Forecast, by Application 2019 & 2032
- Table 46: Italy Residential Buildings Occupancy Sensors Volume (K) Forecast, by Application 2019 & 2032
- Table 47: Spain Residential Buildings Occupancy Sensors Revenue (million) Forecast, by Application 2019 & 2032
- Table 48: Spain Residential Buildings Occupancy Sensors Volume (K) Forecast, by Application 2019 & 2032
- Table 49: Russia Residential Buildings Occupancy Sensors Revenue (million) Forecast, by Application 2019 & 2032
- Table 50: Russia Residential Buildings Occupancy Sensors Volume (K) Forecast, by Application 2019 & 2032
- Table 51: Benelux Residential Buildings Occupancy Sensors Revenue (million) Forecast, by Application 2019 & 2032
- Table 52: Benelux Residential Buildings Occupancy Sensors Volume (K) Forecast, by Application 2019 & 2032
- Table 53: Nordics Residential Buildings Occupancy Sensors Revenue (million) Forecast, by Application 2019 & 2032
- Table 54: Nordics Residential Buildings Occupancy Sensors Volume (K) Forecast, by Application 2019 & 2032
- Table 55: Rest of Europe Residential Buildings Occupancy Sensors Revenue (million) Forecast, by Application 2019 & 2032
- Table 56: Rest of Europe Residential Buildings Occupancy Sensors Volume (K) Forecast, by Application 2019 & 2032
- Table 57: Global Residential Buildings Occupancy Sensors Revenue million Forecast, by Application 2019 & 2032
- Table 58: Global Residential Buildings Occupancy Sensors Volume K Forecast, by Application 2019 & 2032
- Table 59: Global Residential Buildings Occupancy Sensors Revenue million Forecast, by Types 2019 & 2032
- Table 60: Global Residential Buildings Occupancy Sensors Volume K Forecast, by Types 2019 & 2032
- Table 61: Global Residential Buildings Occupancy Sensors Revenue million Forecast, by Country 2019 & 2032
- Table 62: Global Residential Buildings Occupancy Sensors Volume K Forecast, by Country 2019 & 2032
- Table 63: Turkey Residential Buildings Occupancy Sensors Revenue (million) Forecast, by Application 2019 & 2032
- Table 64: Turkey Residential Buildings Occupancy Sensors Volume (K) Forecast, by Application 2019 & 2032
- Table 65: Israel Residential Buildings Occupancy Sensors Revenue (million) Forecast, by Application 2019 & 2032
- Table 66: Israel Residential Buildings Occupancy Sensors Volume (K) Forecast, by Application 2019 & 2032
- Table 67: GCC Residential Buildings Occupancy Sensors Revenue (million) Forecast, by Application 2019 & 2032
- Table 68: GCC Residential Buildings Occupancy Sensors Volume (K) Forecast, by Application 2019 & 2032
- Table 69: North Africa Residential Buildings Occupancy Sensors Revenue (million) Forecast, by Application 2019 & 2032
- Table 70: North Africa Residential Buildings Occupancy Sensors Volume (K) Forecast, by Application 2019 & 2032
- Table 71: South Africa Residential Buildings Occupancy Sensors Revenue (million) Forecast, by Application 2019 & 2032
- Table 72: South Africa Residential Buildings Occupancy Sensors Volume (K) Forecast, by Application 2019 & 2032
- Table 73: Rest of Middle East & Africa Residential Buildings Occupancy Sensors Revenue (million) Forecast, by Application 2019 & 2032
- Table 74: Rest of Middle East & Africa Residential Buildings Occupancy Sensors Volume (K) Forecast, by Application 2019 & 2032
- Table 75: Global Residential Buildings Occupancy Sensors Revenue million Forecast, by Application 2019 & 2032
- Table 76: Global Residential Buildings Occupancy Sensors Volume K Forecast, by Application 2019 & 2032
- Table 77: Global Residential Buildings Occupancy Sensors Revenue million Forecast, by Types 2019 & 2032
- Table 78: Global Residential Buildings Occupancy Sensors Volume K Forecast, by Types 2019 & 2032
- Table 79: Global Residential Buildings Occupancy Sensors Revenue million Forecast, by Country 2019 & 2032
- Table 80: Global Residential Buildings Occupancy Sensors Volume K Forecast, by Country 2019 & 2032
- Table 81: China Residential Buildings Occupancy Sensors Revenue (million) Forecast, by Application 2019 & 2032
- Table 82: China Residential Buildings Occupancy Sensors Volume (K) Forecast, by Application 2019 & 2032
- Table 83: India Residential Buildings Occupancy Sensors Revenue (million) Forecast, by Application 2019 & 2032
- Table 84: India Residential Buildings Occupancy Sensors Volume (K) Forecast, by Application 2019 & 2032
- Table 85: Japan Residential Buildings Occupancy Sensors Revenue (million) Forecast, by Application 2019 & 2032
- Table 86: Japan Residential Buildings Occupancy Sensors Volume (K) Forecast, by Application 2019 & 2032
- Table 87: South Korea Residential Buildings Occupancy Sensors Revenue (million) Forecast, by Application 2019 & 2032
- Table 88: South Korea Residential Buildings Occupancy Sensors Volume (K) Forecast, by Application 2019 & 2032
- Table 89: ASEAN Residential Buildings Occupancy Sensors Revenue (million) Forecast, by Application 2019 & 2032
- Table 90: ASEAN Residential Buildings Occupancy Sensors Volume (K) Forecast, by Application 2019 & 2032
- Table 91: Oceania Residential Buildings Occupancy Sensors Revenue (million) Forecast, by Application 2019 & 2032
- Table 92: Oceania Residential Buildings Occupancy Sensors Volume (K) Forecast, by Application 2019 & 2032
- Table 93: Rest of Asia Pacific Residential Buildings Occupancy Sensors Revenue (million) Forecast, by Application 2019 & 2032
- Table 94: Rest of Asia Pacific Residential Buildings Occupancy Sensors Volume (K) Forecast, by Application 2019 & 2032
Frequently Asked Questions
1. What is the projected Compound Annual Growth Rate (CAGR) of the Residential Buildings Occupancy Sensors?
The projected CAGR is approximately 2.4%.
2. Which companies are prominent players in the Residential Buildings Occupancy Sensors?
Key companies in the market include Signify, Schneider Electric, Honeywell, GE Current, Johnson Controls, Legrand, Crestron Electronics, Lutron Electronics, Acuity Brands, OPTEX, Leviton Manufacturing Co., Inc, Enerlites, Hubbell, ATSS.
3. What are the main segments of the Residential Buildings Occupancy Sensors?
The market segments include Application, Types.
4. Can you provide details about the market size?
The market size is estimated to be USD 594.5 million as of 2022.
5. What are some drivers contributing to market growth?
N/A
6. What are the notable trends driving market growth?
N/A
7. Are there any restraints impacting market growth?
N/A
8. Can you provide examples of recent developments in the market?
N/A
9. What pricing options are available for accessing the report?
Pricing options include single-user, multi-user, and enterprise licenses priced at USD 3350.00, USD 5025.00, and USD 6700.00 respectively.
10. Is the market size provided in terms of value or volume?
The market size is provided in terms of value, measured in million and volume, measured in K.
11. Are there any specific market keywords associated with the report?
Yes, the market keyword associated with the report is "Residential Buildings Occupancy Sensors," which aids in identifying and referencing the specific market segment covered.
12. How do I determine which pricing option suits my needs best?
The pricing options vary based on user requirements and access needs. Individual users may opt for single-user licenses, while businesses requiring broader access may choose multi-user or enterprise licenses for cost-effective access to the report.
13. Are there any additional resources or data provided in the Residential Buildings Occupancy Sensors report?
While the report offers comprehensive insights, it's advisable to review the specific contents or supplementary materials provided to ascertain if additional resources or data are available.
14. How can I stay updated on further developments or reports in the Residential Buildings Occupancy Sensors?
To stay informed about further developments, trends, and reports in the Residential Buildings Occupancy Sensors, consider subscribing to industry newsletters, following relevant companies and organizations, or regularly checking reputable industry news sources and publications.
Methodology
Step 1 - Identification of Relevant Samples Size from Population Database


Step 2 - Approaches for Defining Global Market Size (Value, Volume* & Price*)

Note*: In applicable scenarios
Step 3 - Data Sources
Primary Research
- Web Analytics
- Survey Reports
- Research Institute
- Latest Research Reports
- Opinion Leaders
Secondary Research
- Annual Reports
- White Paper
- Latest Press Release
- Industry Association
- Paid Database
- Investor Presentations

Step 4 - Data Triangulation
Involves using different sources of information in order to increase the validity of a study
These sources are likely to be stakeholders in a program - participants, other researchers, program staff, other community members, and so on.
Then we put all data in single framework & apply various statistical tools to find out the dynamic on the market.
During the analysis stage, feedback from the stakeholder groups would be compared to determine areas of agreement as well as areas of divergence


