
Key Insights
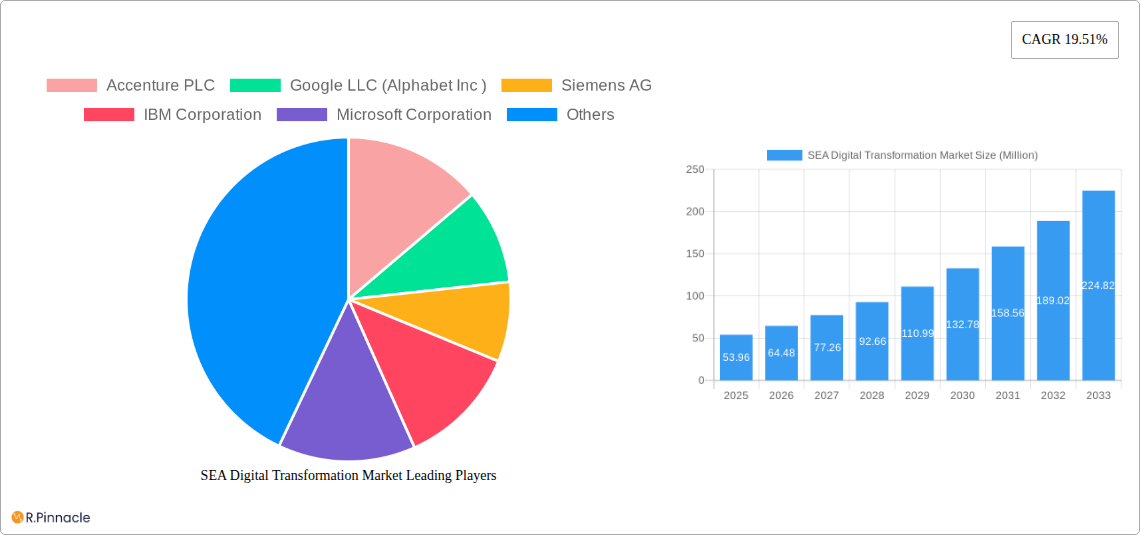
The Southeast Asia (SEA) digital transformation market is experiencing robust growth, projected to reach a substantial size driven by increasing digital literacy, expanding internet and mobile penetration, and government initiatives promoting digital economies. The market's Compound Annual Growth Rate (CAGR) of 19.51% from 2019 to 2033 indicates a significant upward trajectory, surpassing $53.96 million in 2025. Key drivers include the adoption of cloud computing, big data analytics, artificial intelligence (AI), and the Internet of Things (IoT) across various sectors like finance, healthcare, and e-commerce. Businesses in SEA are increasingly investing in digital solutions to enhance operational efficiency, improve customer experiences, and gain a competitive edge in a rapidly evolving marketplace. The market is segmented by technology (cloud computing, AI, cybersecurity, etc.), industry (finance, retail, healthcare, etc.), and country (Singapore, Indonesia, Thailand, etc.), each presenting unique growth opportunities. While data privacy concerns and the digital skills gap pose challenges, the overall market outlook remains positive, fueled by substantial investments from both domestic and international players, including prominent technology giants like Google, Microsoft, and Amazon Web Services.
Significant growth is expected across all segments, with cloud computing and AI poised to lead the charge. The increasing adoption of digital technologies by small and medium-sized enterprises (SMEs) will further propel market expansion. Government support through infrastructure development and regulatory frameworks aimed at fostering digital innovation will also play a crucial role in shaping the market's future trajectory. Competition among technology providers remains intense, demanding strategic partnerships and continuous innovation to capture market share. The forecast period (2025-2033) presents significant opportunities for businesses to leverage the digital transformation wave in SEA, particularly focusing on addressing the specific needs and challenges of each country within the region. The market’s success hinges on continued investment in digital infrastructure and workforce development to fully realize its transformative potential.
Southeast Asia (SEA) Digital Transformation Market Report: 2019-2033
This comprehensive report provides a detailed analysis of the SEA digital transformation market, offering invaluable insights for industry professionals, investors, and strategists. Covering the period 2019-2033, with a focus on 2025, this report unveils market dynamics, key players, emerging trends, and future growth potential. The report leverages extensive data analysis and expert insights to deliver actionable recommendations for navigating the evolving SEA digital landscape.
SEA Digital Transformation Market Market Structure & Innovation Trends
The SEA digital transformation market exhibits a moderately concentrated structure, with several multinational corporations holding significant market share. Accenture, Google, Microsoft, and IBM are prominent players, commanding a combined xx% of the market in 2025 (estimated). However, the market also accommodates numerous smaller, specialized players, particularly in niche segments. Innovation is driven primarily by advancements in cloud computing, artificial intelligence (AI), and the Internet of Things (IoT), coupled with increasing government initiatives promoting digitalization.
- Market Concentration: xx% held by top 5 players in 2025 (estimated).
- Innovation Drivers: Cloud computing, AI, IoT, 5G deployment.
- Regulatory Frameworks: Varying across SEA nations, impacting data privacy and cybersecurity.
- M&A Activity: Significant M&A activity observed in 2019-2024, with total deal value exceeding USD xx Million. Notable deals include [Insert examples if available, otherwise use “several strategic acquisitions and mergers within the cloud and software segments.”].
- Product Substitutes: Open-source alternatives and regional providers pose competitive challenges to established players.
- End-User Demographics: Focus is shifting towards SMEs and government sectors.
SEA Digital Transformation Market Market Dynamics & Trends
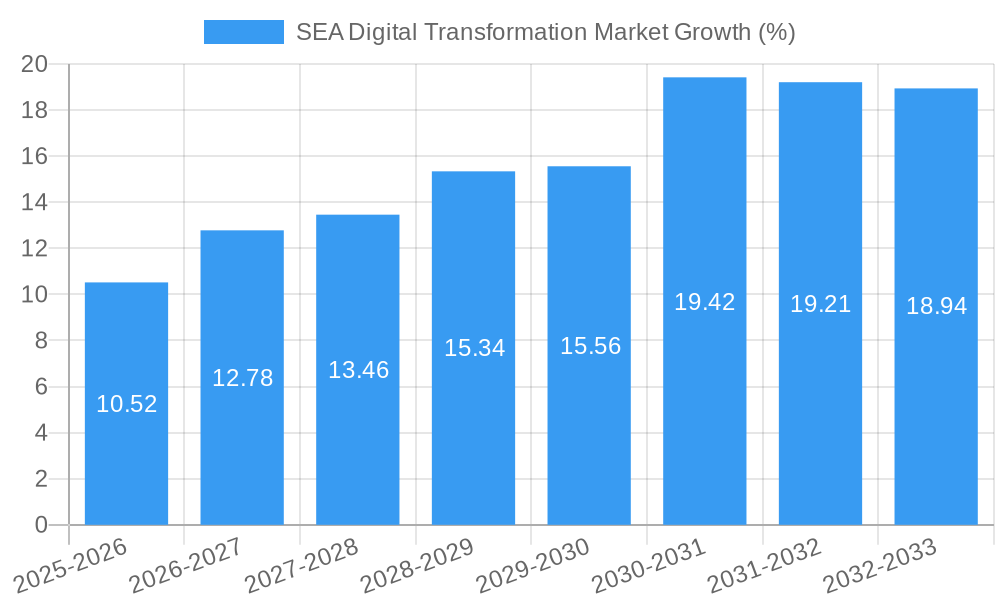
The SEA digital transformation market is experiencing robust growth, driven by factors such as rising internet and smartphone penetration, increasing government investments in digital infrastructure, and the expanding adoption of cloud-based solutions across various industries. The Compound Annual Growth Rate (CAGR) is projected at xx% during the forecast period (2025-2033), with market penetration reaching xx% by 2033. Technological disruptions, particularly in AI and blockchain, are reshaping industry dynamics, fostering innovation and creating new market opportunities. Consumer preferences are evolving towards personalized experiences and seamless digital interactions, influencing the demand for advanced digital solutions. Intense competition among established players and emerging startups is driving innovation and lowering prices, creating benefits for consumers.
Dominant Regions & Segments in SEA Digital Transformation Market
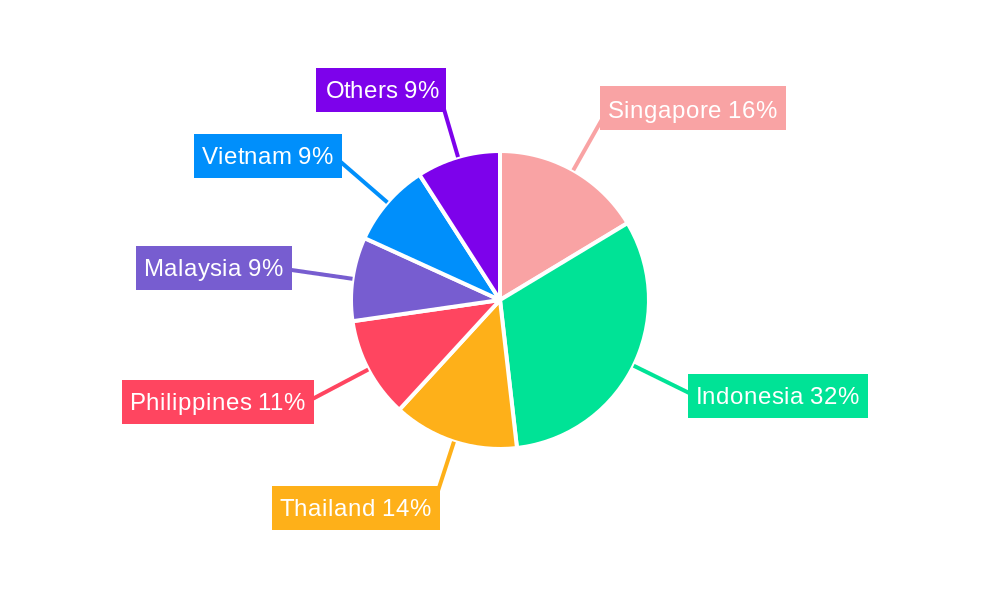
Singapore, with its advanced digital infrastructure and pro-business environment, holds a dominant position in the SEA digital transformation market. Other key markets include Malaysia, Indonesia, and Thailand. The financial services sector is currently a leading segment, followed by telecommunications and retail.
- Singapore's Dominance:
- Advanced digital infrastructure.
- Strong government support for digital innovation.
- High internet and smartphone penetration.
- Hub for Fintech and regional headquarters.
- Other Key Markets: Malaysia, Indonesia, and Thailand are witnessing rapid growth, driven by government initiatives and rising digital adoption.
The dominance of Singapore stems from its proactive government policies, sophisticated infrastructure, and highly skilled workforce. These factors attract significant foreign investment and foster innovation within the digital transformation sector. The financial services sector's leading position is primarily due to the region's rapidly evolving fintech landscape and the increased reliance on digital technologies for financial transactions.
SEA Digital Transformation Market Product Innovations
Recent product innovations focus on AI-powered solutions for enhanced efficiency and customer experience. Cloud-based platforms offer scalability and cost-effectiveness, driving adoption across industries. The integration of IoT devices with cloud platforms creates opportunities for real-time data analytics and automation. These innovations are improving business processes and consumer engagement, increasing their market relevance.
Report Scope & Segmentation Analysis
This report segments the SEA digital transformation market by technology (cloud computing, AI, IoT, cybersecurity), industry vertical (finance, telecommunications, retail, healthcare), and country. Each segment's growth projections, market size estimates, and competitive dynamics are analyzed. Growth projections vary across segments, with cloud computing and AI expected to experience the highest growth rates. Competitive dynamics are characterized by both fierce competition among established players and the emergence of innovative startups.
Key Drivers of SEA Digital Transformation Market Growth
The SEA digital transformation market is propelled by several key drivers, including:
- Government Initiatives: Significant investments in digital infrastructure and supportive policies are driving market growth.
- Technological Advancements: The rapid development of cloud computing, AI, and IoT is fueling demand for digital transformation solutions.
- Economic Growth: Rising disposable incomes and increasing internet penetration are boosting demand for digital services and products.
Challenges in the SEA Digital Transformation Market Sector
Several factors hinder the SEA digital transformation market's growth:
- Digital Divide: Uneven access to technology and digital literacy across SEA nations creates disparities.
- Cybersecurity Risks: Increasing cyber threats pose significant challenges to businesses and governments.
- Data Privacy Concerns: Growing concerns about data privacy and protection influence regulatory frameworks. These challenges affect market penetration and consumer trust.
Emerging Opportunities in SEA Digital Transformation Market
Several emerging opportunities present significant potential for growth:
- Fintech Innovation: The rapidly growing fintech sector offers vast opportunities for digital solutions.
- E-commerce Expansion: The rising popularity of e-commerce presents growth potential for digital marketing and logistics solutions.
- Smart City Initiatives: Government investments in smart city projects create demand for related technologies.
Leading Players in the SEA Digital Transformation Market Market
- Accenture PLC
- Google LLC (Alphabet Inc)
- Siemens AG
- IBM Corporation
- Microsoft Corporation
- Cognex Corporation
- Hewlett Packard Enterprise
- SAP SE
- EMC Corporation (Dell EMC)
- Oracle Corporation
- Adobe Inc
- Amazon Web Services Inc (Amazon com Inc)
- Apple Inc
- Salesforce com Inc
- Cisco Systems Inc
Key Developments in SEA Digital Transformation Market Industry
- July 2024: The Monetary Authority of Singapore (MAS) pledged USD 134.3 Million to boost AI and quantum technology adoption in the financial sector.
- May 2024: Microsoft committed USD 2.2 Billion to Malaysia for cloud, AI infrastructure, training, and national AI center development.
Future Outlook for SEA Digital Transformation Market Market
The SEA digital transformation market is poised for continued robust growth, driven by sustained government support, technological advancements, and rising digital adoption. Strategic investments in digital infrastructure and talent development will be crucial for maximizing market potential. The focus will shift to emerging technologies such as blockchain, extended reality (XR), and the metaverse, presenting exciting opportunities for innovative players.
SEA Digital Transformation Market Segmentation
-
1. Type
-
1.1. Analytic
- 1.1.1. Current
- 1.1.2. Key Grow
- 1.1.3. Use Case Analysis
- 1.1.4. Market Outlook
- 1.2. Extended Reality (XR)
- 1.3. IoT
- 1.4. Industrial Robotics
- 1.5. Blockchain
- 1.6. Additive Manufacturing/3D Printing
- 1.7. Cybersecurity
- 1.8. Cloud and Edge Computing
-
1.9. Others (Digital Twin, Mobility, and Connectivity)
- 1.9.1. Market B
-
1.1. Analytic
-
2. End-user Industry
- 2.1. Manufacturing
- 2.2. Oil, Gas, and Utilities
- 2.3. Retail & e-commerce
- 2.4. Transportation and Logistics
- 2.5. Healthcare
- 2.6. BFSI
- 2.7. Telecom and IT
- 2.8. Government and Public Sector
- 2.9. Other En
SEA Digital Transformation Market Segmentation By Geography
-
1. North America
- 1.1. United States
- 1.2. Canada
- 1.3. Mexico
-
2. South America
- 2.1. Brazil
- 2.2. Argentina
- 2.3. Rest of South America
-
3. Europe
- 3.1. United Kingdom
- 3.2. Germany
- 3.3. France
- 3.4. Italy
- 3.5. Spain
- 3.6. Russia
- 3.7. Benelux
- 3.8. Nordics
- 3.9. Rest of Europe
-
4. Middle East & Africa
- 4.1. Turkey
- 4.2. Israel
- 4.3. GCC
- 4.4. North Africa
- 4.5. South Africa
- 4.6. Rest of Middle East & Africa
-
5. Asia Pacific
- 5.1. China
- 5.2. India
- 5.3. Japan
- 5.4. South Korea
- 5.5. ASEAN
- 5.6. Oceania
- 5.7. Rest of Asia Pacific
SEA Digital Transformation Market REPORT HIGHLIGHTS
| Aspects | Details |
|---|---|
| Study Period | 2019-2033 |
| Base Year | 2024 |
| Estimated Year | 2025 |
| Forecast Period | 2025-2033 |
| Historical Period | 2019-2024 |
| Growth Rate | CAGR of 19.51% from 2019-2033 |
| Segmentation |
|
Table of Contents
- 1. Introduction
- 1.1. Research Scope
- 1.2. Market Segmentation
- 1.3. Research Methodology
- 1.4. Definitions and Assumptions
- 2. Executive Summary
- 2.1. Introduction
- 3. Market Dynamics
- 3.1. Introduction
- 3.2. Market Drivers
- 3.2.1. Increase in the Adoption of Big Data Analytics and Other Technologies to Drive the Market; The Rapid Proliferation of Mobile Devices and Apps
- 3.3. Market Restrains
- 3.3.1. Increase in the Adoption of Big Data Analytics and Other Technologies to Drive the Market; The Rapid Proliferation of Mobile Devices and Apps
- 3.4. Market Trends
- 3.4.1. Increase in the Adoption of Big Data Analytics and Other Technologies to Drive the Market
- 4. Market Factor Analysis
- 4.1. Porters Five Forces
- 4.2. Supply/Value Chain
- 4.3. PESTEL analysis
- 4.4. Market Entropy
- 4.5. Patent/Trademark Analysis
- 5. Global SEA Digital Transformation Market Analysis, Insights and Forecast, 2019-2031
- 5.1. Market Analysis, Insights and Forecast - by Type
- 5.1.1. Analytic
- 5.1.1.1. Current
- 5.1.1.2. Key Grow
- 5.1.1.3. Use Case Analysis
- 5.1.1.4. Market Outlook
- 5.1.2. Extended Reality (XR)
- 5.1.3. IoT
- 5.1.4. Industrial Robotics
- 5.1.5. Blockchain
- 5.1.6. Additive Manufacturing/3D Printing
- 5.1.7. Cybersecurity
- 5.1.8. Cloud and Edge Computing
- 5.1.9. Others (Digital Twin, Mobility, and Connectivity)
- 5.1.9.1. Market B
- 5.1.1. Analytic
- 5.2. Market Analysis, Insights and Forecast - by End-user Industry
- 5.2.1. Manufacturing
- 5.2.2. Oil, Gas, and Utilities
- 5.2.3. Retail & e-commerce
- 5.2.4. Transportation and Logistics
- 5.2.5. Healthcare
- 5.2.6. BFSI
- 5.2.7. Telecom and IT
- 5.2.8. Government and Public Sector
- 5.2.9. Other En
- 5.3. Market Analysis, Insights and Forecast - by Region
- 5.3.1. North America
- 5.3.2. South America
- 5.3.3. Europe
- 5.3.4. Middle East & Africa
- 5.3.5. Asia Pacific
- 5.1. Market Analysis, Insights and Forecast - by Type
- 6. North America SEA Digital Transformation Market Analysis, Insights and Forecast, 2019-2031
- 6.1. Market Analysis, Insights and Forecast - by Type
- 6.1.1. Analytic
- 6.1.1.1. Current
- 6.1.1.2. Key Grow
- 6.1.1.3. Use Case Analysis
- 6.1.1.4. Market Outlook
- 6.1.2. Extended Reality (XR)
- 6.1.3. IoT
- 6.1.4. Industrial Robotics
- 6.1.5. Blockchain
- 6.1.6. Additive Manufacturing/3D Printing
- 6.1.7. Cybersecurity
- 6.1.8. Cloud and Edge Computing
- 6.1.9. Others (Digital Twin, Mobility, and Connectivity)
- 6.1.9.1. Market B
- 6.1.1. Analytic
- 6.2. Market Analysis, Insights and Forecast - by End-user Industry
- 6.2.1. Manufacturing
- 6.2.2. Oil, Gas, and Utilities
- 6.2.3. Retail & e-commerce
- 6.2.4. Transportation and Logistics
- 6.2.5. Healthcare
- 6.2.6. BFSI
- 6.2.7. Telecom and IT
- 6.2.8. Government and Public Sector
- 6.2.9. Other En
- 6.1. Market Analysis, Insights and Forecast - by Type
- 7. South America SEA Digital Transformation Market Analysis, Insights and Forecast, 2019-2031
- 7.1. Market Analysis, Insights and Forecast - by Type
- 7.1.1. Analytic
- 7.1.1.1. Current
- 7.1.1.2. Key Grow
- 7.1.1.3. Use Case Analysis
- 7.1.1.4. Market Outlook
- 7.1.2. Extended Reality (XR)
- 7.1.3. IoT
- 7.1.4. Industrial Robotics
- 7.1.5. Blockchain
- 7.1.6. Additive Manufacturing/3D Printing
- 7.1.7. Cybersecurity
- 7.1.8. Cloud and Edge Computing
- 7.1.9. Others (Digital Twin, Mobility, and Connectivity)
- 7.1.9.1. Market B
- 7.1.1. Analytic
- 7.2. Market Analysis, Insights and Forecast - by End-user Industry
- 7.2.1. Manufacturing
- 7.2.2. Oil, Gas, and Utilities
- 7.2.3. Retail & e-commerce
- 7.2.4. Transportation and Logistics
- 7.2.5. Healthcare
- 7.2.6. BFSI
- 7.2.7. Telecom and IT
- 7.2.8. Government and Public Sector
- 7.2.9. Other En
- 7.1. Market Analysis, Insights and Forecast - by Type
- 8. Europe SEA Digital Transformation Market Analysis, Insights and Forecast, 2019-2031
- 8.1. Market Analysis, Insights and Forecast - by Type
- 8.1.1. Analytic
- 8.1.1.1. Current
- 8.1.1.2. Key Grow
- 8.1.1.3. Use Case Analysis
- 8.1.1.4. Market Outlook
- 8.1.2. Extended Reality (XR)
- 8.1.3. IoT
- 8.1.4. Industrial Robotics
- 8.1.5. Blockchain
- 8.1.6. Additive Manufacturing/3D Printing
- 8.1.7. Cybersecurity
- 8.1.8. Cloud and Edge Computing
- 8.1.9. Others (Digital Twin, Mobility, and Connectivity)
- 8.1.9.1. Market B
- 8.1.1. Analytic
- 8.2. Market Analysis, Insights and Forecast - by End-user Industry
- 8.2.1. Manufacturing
- 8.2.2. Oil, Gas, and Utilities
- 8.2.3. Retail & e-commerce
- 8.2.4. Transportation and Logistics
- 8.2.5. Healthcare
- 8.2.6. BFSI
- 8.2.7. Telecom and IT
- 8.2.8. Government and Public Sector
- 8.2.9. Other En
- 8.1. Market Analysis, Insights and Forecast - by Type
- 9. Middle East & Africa SEA Digital Transformation Market Analysis, Insights and Forecast, 2019-2031
- 9.1. Market Analysis, Insights and Forecast - by Type
- 9.1.1. Analytic
- 9.1.1.1. Current
- 9.1.1.2. Key Grow
- 9.1.1.3. Use Case Analysis
- 9.1.1.4. Market Outlook
- 9.1.2. Extended Reality (XR)
- 9.1.3. IoT
- 9.1.4. Industrial Robotics
- 9.1.5. Blockchain
- 9.1.6. Additive Manufacturing/3D Printing
- 9.1.7. Cybersecurity
- 9.1.8. Cloud and Edge Computing
- 9.1.9. Others (Digital Twin, Mobility, and Connectivity)
- 9.1.9.1. Market B
- 9.1.1. Analytic
- 9.2. Market Analysis, Insights and Forecast - by End-user Industry
- 9.2.1. Manufacturing
- 9.2.2. Oil, Gas, and Utilities
- 9.2.3. Retail & e-commerce
- 9.2.4. Transportation and Logistics
- 9.2.5. Healthcare
- 9.2.6. BFSI
- 9.2.7. Telecom and IT
- 9.2.8. Government and Public Sector
- 9.2.9. Other En
- 9.1. Market Analysis, Insights and Forecast - by Type
- 10. Asia Pacific SEA Digital Transformation Market Analysis, Insights and Forecast, 2019-2031
- 10.1. Market Analysis, Insights and Forecast - by Type
- 10.1.1. Analytic
- 10.1.1.1. Current
- 10.1.1.2. Key Grow
- 10.1.1.3. Use Case Analysis
- 10.1.1.4. Market Outlook
- 10.1.2. Extended Reality (XR)
- 10.1.3. IoT
- 10.1.4. Industrial Robotics
- 10.1.5. Blockchain
- 10.1.6. Additive Manufacturing/3D Printing
- 10.1.7. Cybersecurity
- 10.1.8. Cloud and Edge Computing
- 10.1.9. Others (Digital Twin, Mobility, and Connectivity)
- 10.1.9.1. Market B
- 10.1.1. Analytic
- 10.2. Market Analysis, Insights and Forecast - by End-user Industry
- 10.2.1. Manufacturing
- 10.2.2. Oil, Gas, and Utilities
- 10.2.3. Retail & e-commerce
- 10.2.4. Transportation and Logistics
- 10.2.5. Healthcare
- 10.2.6. BFSI
- 10.2.7. Telecom and IT
- 10.2.8. Government and Public Sector
- 10.2.9. Other En
- 10.1. Market Analysis, Insights and Forecast - by Type
- 11. Competitive Analysis
- 11.1. Global Market Share Analysis 2024
- 11.2. Company Profiles
- 11.2.1 Accenture PLC
- 11.2.1.1. Overview
- 11.2.1.2. Products
- 11.2.1.3. SWOT Analysis
- 11.2.1.4. Recent Developments
- 11.2.1.5. Financials (Based on Availability)
- 11.2.2 Google LLC (Alphabet Inc )
- 11.2.2.1. Overview
- 11.2.2.2. Products
- 11.2.2.3. SWOT Analysis
- 11.2.2.4. Recent Developments
- 11.2.2.5. Financials (Based on Availability)
- 11.2.3 Siemens AG
- 11.2.3.1. Overview
- 11.2.3.2. Products
- 11.2.3.3. SWOT Analysis
- 11.2.3.4. Recent Developments
- 11.2.3.5. Financials (Based on Availability)
- 11.2.4 IBM Corporation
- 11.2.4.1. Overview
- 11.2.4.2. Products
- 11.2.4.3. SWOT Analysis
- 11.2.4.4. Recent Developments
- 11.2.4.5. Financials (Based on Availability)
- 11.2.5 Microsoft Corporation
- 11.2.5.1. Overview
- 11.2.5.2. Products
- 11.2.5.3. SWOT Analysis
- 11.2.5.4. Recent Developments
- 11.2.5.5. Financials (Based on Availability)
- 11.2.6 Cognex Corporation
- 11.2.6.1. Overview
- 11.2.6.2. Products
- 11.2.6.3. SWOT Analysis
- 11.2.6.4. Recent Developments
- 11.2.6.5. Financials (Based on Availability)
- 11.2.7 Hewlett Packard Enterprise
- 11.2.7.1. Overview
- 11.2.7.2. Products
- 11.2.7.3. SWOT Analysis
- 11.2.7.4. Recent Developments
- 11.2.7.5. Financials (Based on Availability)
- 11.2.8 SAP SE
- 11.2.8.1. Overview
- 11.2.8.2. Products
- 11.2.8.3. SWOT Analysis
- 11.2.8.4. Recent Developments
- 11.2.8.5. Financials (Based on Availability)
- 11.2.9 EMC Corporation (Dell EMC)
- 11.2.9.1. Overview
- 11.2.9.2. Products
- 11.2.9.3. SWOT Analysis
- 11.2.9.4. Recent Developments
- 11.2.9.5. Financials (Based on Availability)
- 11.2.10 Oracle Corporation
- 11.2.10.1. Overview
- 11.2.10.2. Products
- 11.2.10.3. SWOT Analysis
- 11.2.10.4. Recent Developments
- 11.2.10.5. Financials (Based on Availability)
- 11.2.11 Adobe Inc
- 11.2.11.1. Overview
- 11.2.11.2. Products
- 11.2.11.3. SWOT Analysis
- 11.2.11.4. Recent Developments
- 11.2.11.5. Financials (Based on Availability)
- 11.2.12 Amazon Web Services Inc (Amazon com Inc )
- 11.2.12.1. Overview
- 11.2.12.2. Products
- 11.2.12.3. SWOT Analysis
- 11.2.12.4. Recent Developments
- 11.2.12.5. Financials (Based on Availability)
- 11.2.13 Apple Inc
- 11.2.13.1. Overview
- 11.2.13.2. Products
- 11.2.13.3. SWOT Analysis
- 11.2.13.4. Recent Developments
- 11.2.13.5. Financials (Based on Availability)
- 11.2.14 Salesforce com Inc
- 11.2.14.1. Overview
- 11.2.14.2. Products
- 11.2.14.3. SWOT Analysis
- 11.2.14.4. Recent Developments
- 11.2.14.5. Financials (Based on Availability)
- 11.2.15 Cisco Systems Inc
- 11.2.15.1. Overview
- 11.2.15.2. Products
- 11.2.15.3. SWOT Analysis
- 11.2.15.4. Recent Developments
- 11.2.15.5. Financials (Based on Availability)
- 11.2.1 Accenture PLC
List of Figures
- Figure 1: Global SEA Digital Transformation Market Revenue Breakdown (Million, %) by Region 2024 & 2032
- Figure 2: Global SEA Digital Transformation Market Volume Breakdown (Billion, %) by Region 2024 & 2032
- Figure 3: North America SEA Digital Transformation Market Revenue (Million), by Type 2024 & 2032
- Figure 4: North America SEA Digital Transformation Market Volume (Billion), by Type 2024 & 2032
- Figure 5: North America SEA Digital Transformation Market Revenue Share (%), by Type 2024 & 2032
- Figure 6: North America SEA Digital Transformation Market Volume Share (%), by Type 2024 & 2032
- Figure 7: North America SEA Digital Transformation Market Revenue (Million), by End-user Industry 2024 & 2032
- Figure 8: North America SEA Digital Transformation Market Volume (Billion), by End-user Industry 2024 & 2032
- Figure 9: North America SEA Digital Transformation Market Revenue Share (%), by End-user Industry 2024 & 2032
- Figure 10: North America SEA Digital Transformation Market Volume Share (%), by End-user Industry 2024 & 2032
- Figure 11: North America SEA Digital Transformation Market Revenue (Million), by Country 2024 & 2032
- Figure 12: North America SEA Digital Transformation Market Volume (Billion), by Country 2024 & 2032
- Figure 13: North America SEA Digital Transformation Market Revenue Share (%), by Country 2024 & 2032
- Figure 14: North America SEA Digital Transformation Market Volume Share (%), by Country 2024 & 2032
- Figure 15: South America SEA Digital Transformation Market Revenue (Million), by Type 2024 & 2032
- Figure 16: South America SEA Digital Transformation Market Volume (Billion), by Type 2024 & 2032
- Figure 17: South America SEA Digital Transformation Market Revenue Share (%), by Type 2024 & 2032
- Figure 18: South America SEA Digital Transformation Market Volume Share (%), by Type 2024 & 2032
- Figure 19: South America SEA Digital Transformation Market Revenue (Million), by End-user Industry 2024 & 2032
- Figure 20: South America SEA Digital Transformation Market Volume (Billion), by End-user Industry 2024 & 2032
- Figure 21: South America SEA Digital Transformation Market Revenue Share (%), by End-user Industry 2024 & 2032
- Figure 22: South America SEA Digital Transformation Market Volume Share (%), by End-user Industry 2024 & 2032
- Figure 23: South America SEA Digital Transformation Market Revenue (Million), by Country 2024 & 2032
- Figure 24: South America SEA Digital Transformation Market Volume (Billion), by Country 2024 & 2032
- Figure 25: South America SEA Digital Transformation Market Revenue Share (%), by Country 2024 & 2032
- Figure 26: South America SEA Digital Transformation Market Volume Share (%), by Country 2024 & 2032
- Figure 27: Europe SEA Digital Transformation Market Revenue (Million), by Type 2024 & 2032
- Figure 28: Europe SEA Digital Transformation Market Volume (Billion), by Type 2024 & 2032
- Figure 29: Europe SEA Digital Transformation Market Revenue Share (%), by Type 2024 & 2032
- Figure 30: Europe SEA Digital Transformation Market Volume Share (%), by Type 2024 & 2032
- Figure 31: Europe SEA Digital Transformation Market Revenue (Million), by End-user Industry 2024 & 2032
- Figure 32: Europe SEA Digital Transformation Market Volume (Billion), by End-user Industry 2024 & 2032
- Figure 33: Europe SEA Digital Transformation Market Revenue Share (%), by End-user Industry 2024 & 2032
- Figure 34: Europe SEA Digital Transformation Market Volume Share (%), by End-user Industry 2024 & 2032
- Figure 35: Europe SEA Digital Transformation Market Revenue (Million), by Country 2024 & 2032
- Figure 36: Europe SEA Digital Transformation Market Volume (Billion), by Country 2024 & 2032
- Figure 37: Europe SEA Digital Transformation Market Revenue Share (%), by Country 2024 & 2032
- Figure 38: Europe SEA Digital Transformation Market Volume Share (%), by Country 2024 & 2032
- Figure 39: Middle East & Africa SEA Digital Transformation Market Revenue (Million), by Type 2024 & 2032
- Figure 40: Middle East & Africa SEA Digital Transformation Market Volume (Billion), by Type 2024 & 2032
- Figure 41: Middle East & Africa SEA Digital Transformation Market Revenue Share (%), by Type 2024 & 2032
- Figure 42: Middle East & Africa SEA Digital Transformation Market Volume Share (%), by Type 2024 & 2032
- Figure 43: Middle East & Africa SEA Digital Transformation Market Revenue (Million), by End-user Industry 2024 & 2032
- Figure 44: Middle East & Africa SEA Digital Transformation Market Volume (Billion), by End-user Industry 2024 & 2032
- Figure 45: Middle East & Africa SEA Digital Transformation Market Revenue Share (%), by End-user Industry 2024 & 2032
- Figure 46: Middle East & Africa SEA Digital Transformation Market Volume Share (%), by End-user Industry 2024 & 2032
- Figure 47: Middle East & Africa SEA Digital Transformation Market Revenue (Million), by Country 2024 & 2032
- Figure 48: Middle East & Africa SEA Digital Transformation Market Volume (Billion), by Country 2024 & 2032
- Figure 49: Middle East & Africa SEA Digital Transformation Market Revenue Share (%), by Country 2024 & 2032
- Figure 50: Middle East & Africa SEA Digital Transformation Market Volume Share (%), by Country 2024 & 2032
- Figure 51: Asia Pacific SEA Digital Transformation Market Revenue (Million), by Type 2024 & 2032
- Figure 52: Asia Pacific SEA Digital Transformation Market Volume (Billion), by Type 2024 & 2032
- Figure 53: Asia Pacific SEA Digital Transformation Market Revenue Share (%), by Type 2024 & 2032
- Figure 54: Asia Pacific SEA Digital Transformation Market Volume Share (%), by Type 2024 & 2032
- Figure 55: Asia Pacific SEA Digital Transformation Market Revenue (Million), by End-user Industry 2024 & 2032
- Figure 56: Asia Pacific SEA Digital Transformation Market Volume (Billion), by End-user Industry 2024 & 2032
- Figure 57: Asia Pacific SEA Digital Transformation Market Revenue Share (%), by End-user Industry 2024 & 2032
- Figure 58: Asia Pacific SEA Digital Transformation Market Volume Share (%), by End-user Industry 2024 & 2032
- Figure 59: Asia Pacific SEA Digital Transformation Market Revenue (Million), by Country 2024 & 2032
- Figure 60: Asia Pacific SEA Digital Transformation Market Volume (Billion), by Country 2024 & 2032
- Figure 61: Asia Pacific SEA Digital Transformation Market Revenue Share (%), by Country 2024 & 2032
- Figure 62: Asia Pacific SEA Digital Transformation Market Volume Share (%), by Country 2024 & 2032
List of Tables
- Table 1: Global SEA Digital Transformation Market Revenue Million Forecast, by Region 2019 & 2032
- Table 2: Global SEA Digital Transformation Market Volume Billion Forecast, by Region 2019 & 2032
- Table 3: Global SEA Digital Transformation Market Revenue Million Forecast, by Type 2019 & 2032
- Table 4: Global SEA Digital Transformation Market Volume Billion Forecast, by Type 2019 & 2032
- Table 5: Global SEA Digital Transformation Market Revenue Million Forecast, by End-user Industry 2019 & 2032
- Table 6: Global SEA Digital Transformation Market Volume Billion Forecast, by End-user Industry 2019 & 2032
- Table 7: Global SEA Digital Transformation Market Revenue Million Forecast, by Region 2019 & 2032
- Table 8: Global SEA Digital Transformation Market Volume Billion Forecast, by Region 2019 & 2032
- Table 9: Global SEA Digital Transformation Market Revenue Million Forecast, by Type 2019 & 2032
- Table 10: Global SEA Digital Transformation Market Volume Billion Forecast, by Type 2019 & 2032
- Table 11: Global SEA Digital Transformation Market Revenue Million Forecast, by End-user Industry 2019 & 2032
- Table 12: Global SEA Digital Transformation Market Volume Billion Forecast, by End-user Industry 2019 & 2032
- Table 13: Global SEA Digital Transformation Market Revenue Million Forecast, by Country 2019 & 2032
- Table 14: Global SEA Digital Transformation Market Volume Billion Forecast, by Country 2019 & 2032
- Table 15: United States SEA Digital Transformation Market Revenue (Million) Forecast, by Application 2019 & 2032
- Table 16: United States SEA Digital Transformation Market Volume (Billion) Forecast, by Application 2019 & 2032
- Table 17: Canada SEA Digital Transformation Market Revenue (Million) Forecast, by Application 2019 & 2032
- Table 18: Canada SEA Digital Transformation Market Volume (Billion) Forecast, by Application 2019 & 2032
- Table 19: Mexico SEA Digital Transformation Market Revenue (Million) Forecast, by Application 2019 & 2032
- Table 20: Mexico SEA Digital Transformation Market Volume (Billion) Forecast, by Application 2019 & 2032
- Table 21: Global SEA Digital Transformation Market Revenue Million Forecast, by Type 2019 & 2032
- Table 22: Global SEA Digital Transformation Market Volume Billion Forecast, by Type 2019 & 2032
- Table 23: Global SEA Digital Transformation Market Revenue Million Forecast, by End-user Industry 2019 & 2032
- Table 24: Global SEA Digital Transformation Market Volume Billion Forecast, by End-user Industry 2019 & 2032
- Table 25: Global SEA Digital Transformation Market Revenue Million Forecast, by Country 2019 & 2032
- Table 26: Global SEA Digital Transformation Market Volume Billion Forecast, by Country 2019 & 2032
- Table 27: Brazil SEA Digital Transformation Market Revenue (Million) Forecast, by Application 2019 & 2032
- Table 28: Brazil SEA Digital Transformation Market Volume (Billion) Forecast, by Application 2019 & 2032
- Table 29: Argentina SEA Digital Transformation Market Revenue (Million) Forecast, by Application 2019 & 2032
- Table 30: Argentina SEA Digital Transformation Market Volume (Billion) Forecast, by Application 2019 & 2032
- Table 31: Rest of South America SEA Digital Transformation Market Revenue (Million) Forecast, by Application 2019 & 2032
- Table 32: Rest of South America SEA Digital Transformation Market Volume (Billion) Forecast, by Application 2019 & 2032
- Table 33: Global SEA Digital Transformation Market Revenue Million Forecast, by Type 2019 & 2032
- Table 34: Global SEA Digital Transformation Market Volume Billion Forecast, by Type 2019 & 2032
- Table 35: Global SEA Digital Transformation Market Revenue Million Forecast, by End-user Industry 2019 & 2032
- Table 36: Global SEA Digital Transformation Market Volume Billion Forecast, by End-user Industry 2019 & 2032
- Table 37: Global SEA Digital Transformation Market Revenue Million Forecast, by Country 2019 & 2032
- Table 38: Global SEA Digital Transformation Market Volume Billion Forecast, by Country 2019 & 2032
- Table 39: United Kingdom SEA Digital Transformation Market Revenue (Million) Forecast, by Application 2019 & 2032
- Table 40: United Kingdom SEA Digital Transformation Market Volume (Billion) Forecast, by Application 2019 & 2032
- Table 41: Germany SEA Digital Transformation Market Revenue (Million) Forecast, by Application 2019 & 2032
- Table 42: Germany SEA Digital Transformation Market Volume (Billion) Forecast, by Application 2019 & 2032
- Table 43: France SEA Digital Transformation Market Revenue (Million) Forecast, by Application 2019 & 2032
- Table 44: France SEA Digital Transformation Market Volume (Billion) Forecast, by Application 2019 & 2032
- Table 45: Italy SEA Digital Transformation Market Revenue (Million) Forecast, by Application 2019 & 2032
- Table 46: Italy SEA Digital Transformation Market Volume (Billion) Forecast, by Application 2019 & 2032
- Table 47: Spain SEA Digital Transformation Market Revenue (Million) Forecast, by Application 2019 & 2032
- Table 48: Spain SEA Digital Transformation Market Volume (Billion) Forecast, by Application 2019 & 2032
- Table 49: Russia SEA Digital Transformation Market Revenue (Million) Forecast, by Application 2019 & 2032
- Table 50: Russia SEA Digital Transformation Market Volume (Billion) Forecast, by Application 2019 & 2032
- Table 51: Benelux SEA Digital Transformation Market Revenue (Million) Forecast, by Application 2019 & 2032
- Table 52: Benelux SEA Digital Transformation Market Volume (Billion) Forecast, by Application 2019 & 2032
- Table 53: Nordics SEA Digital Transformation Market Revenue (Million) Forecast, by Application 2019 & 2032
- Table 54: Nordics SEA Digital Transformation Market Volume (Billion) Forecast, by Application 2019 & 2032
- Table 55: Rest of Europe SEA Digital Transformation Market Revenue (Million) Forecast, by Application 2019 & 2032
- Table 56: Rest of Europe SEA Digital Transformation Market Volume (Billion) Forecast, by Application 2019 & 2032
- Table 57: Global SEA Digital Transformation Market Revenue Million Forecast, by Type 2019 & 2032
- Table 58: Global SEA Digital Transformation Market Volume Billion Forecast, by Type 2019 & 2032
- Table 59: Global SEA Digital Transformation Market Revenue Million Forecast, by End-user Industry 2019 & 2032
- Table 60: Global SEA Digital Transformation Market Volume Billion Forecast, by End-user Industry 2019 & 2032
- Table 61: Global SEA Digital Transformation Market Revenue Million Forecast, by Country 2019 & 2032
- Table 62: Global SEA Digital Transformation Market Volume Billion Forecast, by Country 2019 & 2032
- Table 63: Turkey SEA Digital Transformation Market Revenue (Million) Forecast, by Application 2019 & 2032
- Table 64: Turkey SEA Digital Transformation Market Volume (Billion) Forecast, by Application 2019 & 2032
- Table 65: Israel SEA Digital Transformation Market Revenue (Million) Forecast, by Application 2019 & 2032
- Table 66: Israel SEA Digital Transformation Market Volume (Billion) Forecast, by Application 2019 & 2032
- Table 67: GCC SEA Digital Transformation Market Revenue (Million) Forecast, by Application 2019 & 2032
- Table 68: GCC SEA Digital Transformation Market Volume (Billion) Forecast, by Application 2019 & 2032
- Table 69: North Africa SEA Digital Transformation Market Revenue (Million) Forecast, by Application 2019 & 2032
- Table 70: North Africa SEA Digital Transformation Market Volume (Billion) Forecast, by Application 2019 & 2032
- Table 71: South Africa SEA Digital Transformation Market Revenue (Million) Forecast, by Application 2019 & 2032
- Table 72: South Africa SEA Digital Transformation Market Volume (Billion) Forecast, by Application 2019 & 2032
- Table 73: Rest of Middle East & Africa SEA Digital Transformation Market Revenue (Million) Forecast, by Application 2019 & 2032
- Table 74: Rest of Middle East & Africa SEA Digital Transformation Market Volume (Billion) Forecast, by Application 2019 & 2032
- Table 75: Global SEA Digital Transformation Market Revenue Million Forecast, by Type 2019 & 2032
- Table 76: Global SEA Digital Transformation Market Volume Billion Forecast, by Type 2019 & 2032
- Table 77: Global SEA Digital Transformation Market Revenue Million Forecast, by End-user Industry 2019 & 2032
- Table 78: Global SEA Digital Transformation Market Volume Billion Forecast, by End-user Industry 2019 & 2032
- Table 79: Global SEA Digital Transformation Market Revenue Million Forecast, by Country 2019 & 2032
- Table 80: Global SEA Digital Transformation Market Volume Billion Forecast, by Country 2019 & 2032
- Table 81: China SEA Digital Transformation Market Revenue (Million) Forecast, by Application 2019 & 2032
- Table 82: China SEA Digital Transformation Market Volume (Billion) Forecast, by Application 2019 & 2032
- Table 83: India SEA Digital Transformation Market Revenue (Million) Forecast, by Application 2019 & 2032
- Table 84: India SEA Digital Transformation Market Volume (Billion) Forecast, by Application 2019 & 2032
- Table 85: Japan SEA Digital Transformation Market Revenue (Million) Forecast, by Application 2019 & 2032
- Table 86: Japan SEA Digital Transformation Market Volume (Billion) Forecast, by Application 2019 & 2032
- Table 87: South Korea SEA Digital Transformation Market Revenue (Million) Forecast, by Application 2019 & 2032
- Table 88: South Korea SEA Digital Transformation Market Volume (Billion) Forecast, by Application 2019 & 2032
- Table 89: ASEAN SEA Digital Transformation Market Revenue (Million) Forecast, by Application 2019 & 2032
- Table 90: ASEAN SEA Digital Transformation Market Volume (Billion) Forecast, by Application 2019 & 2032
- Table 91: Oceania SEA Digital Transformation Market Revenue (Million) Forecast, by Application 2019 & 2032
- Table 92: Oceania SEA Digital Transformation Market Volume (Billion) Forecast, by Application 2019 & 2032
- Table 93: Rest of Asia Pacific SEA Digital Transformation Market Revenue (Million) Forecast, by Application 2019 & 2032
- Table 94: Rest of Asia Pacific SEA Digital Transformation Market Volume (Billion) Forecast, by Application 2019 & 2032
Frequently Asked Questions
1. What is the projected Compound Annual Growth Rate (CAGR) of the SEA Digital Transformation Market?
The projected CAGR is approximately 19.51%.
2. Which companies are prominent players in the SEA Digital Transformation Market?
Key companies in the market include Accenture PLC, Google LLC (Alphabet Inc ), Siemens AG, IBM Corporation, Microsoft Corporation, Cognex Corporation, Hewlett Packard Enterprise, SAP SE, EMC Corporation (Dell EMC), Oracle Corporation, Adobe Inc, Amazon Web Services Inc (Amazon com Inc ), Apple Inc, Salesforce com Inc, Cisco Systems Inc.
3. What are the main segments of the SEA Digital Transformation Market?
The market segments include Type, End-user Industry.
4. Can you provide details about the market size?
The market size is estimated to be USD 53.96 Million as of 2022.
5. What are some drivers contributing to market growth?
Increase in the Adoption of Big Data Analytics and Other Technologies to Drive the Market; The Rapid Proliferation of Mobile Devices and Apps.
6. What are the notable trends driving market growth?
Increase in the Adoption of Big Data Analytics and Other Technologies to Drive the Market.
7. Are there any restraints impacting market growth?
Increase in the Adoption of Big Data Analytics and Other Technologies to Drive the Market; The Rapid Proliferation of Mobile Devices and Apps.
8. Can you provide examples of recent developments in the market?
July 2024: The Monetary Authority of Singapore (MAS) has pledged an extra SGD 100 million (USD 134.3 million) to bolster financial institutions' expertise in quantum and artificial intelligence (AI) technologies. This funding, part of the Financial Sector Technology and Innovation Grant Scheme (FTSI 3.0), will specifically cover both manpower expenses and technology solutions in these cutting-edge fields. MAS anticipates that this injection will enhance innovation in quantum and AI within the financial sector and accelerate their adoption.
9. What pricing options are available for accessing the report?
Pricing options include single-user, multi-user, and enterprise licenses priced at USD 3800, USD 4500, and USD 5800 respectively.
10. Is the market size provided in terms of value or volume?
The market size is provided in terms of value, measured in Million and volume, measured in Billion.
11. Are there any specific market keywords associated with the report?
Yes, the market keyword associated with the report is "SEA Digital Transformation Market," which aids in identifying and referencing the specific market segment covered.
12. How do I determine which pricing option suits my needs best?
The pricing options vary based on user requirements and access needs. Individual users may opt for single-user licenses, while businesses requiring broader access may choose multi-user or enterprise licenses for cost-effective access to the report.
13. Are there any additional resources or data provided in the SEA Digital Transformation Market report?
While the report offers comprehensive insights, it's advisable to review the specific contents or supplementary materials provided to ascertain if additional resources or data are available.
14. How can I stay updated on further developments or reports in the SEA Digital Transformation Market?
To stay informed about further developments, trends, and reports in the SEA Digital Transformation Market, consider subscribing to industry newsletters, following relevant companies and organizations, or regularly checking reputable industry news sources and publications.
Methodology
Step 1 - Identification of Relevant Samples Size from Population Database


Step 2 - Approaches for Defining Global Market Size (Value, Volume* & Price*)

Note*: In applicable scenarios
Step 3 - Data Sources
Primary Research
- Web Analytics
- Survey Reports
- Research Institute
- Latest Research Reports
- Opinion Leaders
Secondary Research
- Annual Reports
- White Paper
- Latest Press Release
- Industry Association
- Paid Database
- Investor Presentations

Step 4 - Data Triangulation
Involves using different sources of information in order to increase the validity of a study
These sources are likely to be stakeholders in a program - participants, other researchers, program staff, other community members, and so on.
Then we put all data in single framework & apply various statistical tools to find out the dynamic on the market.
During the analysis stage, feedback from the stakeholder groups would be compared to determine areas of agreement as well as areas of divergence


