
Key Insights
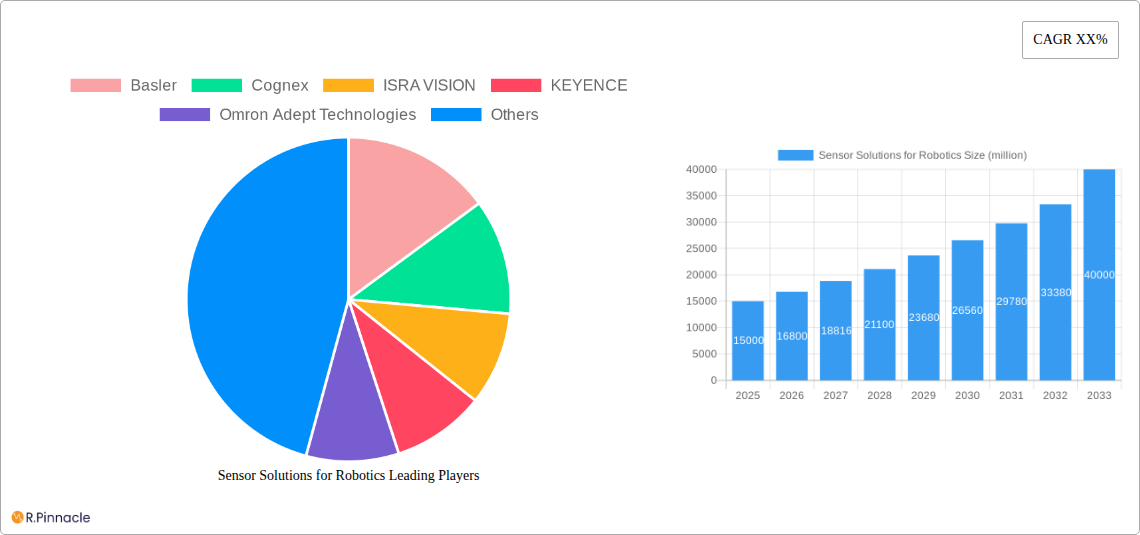
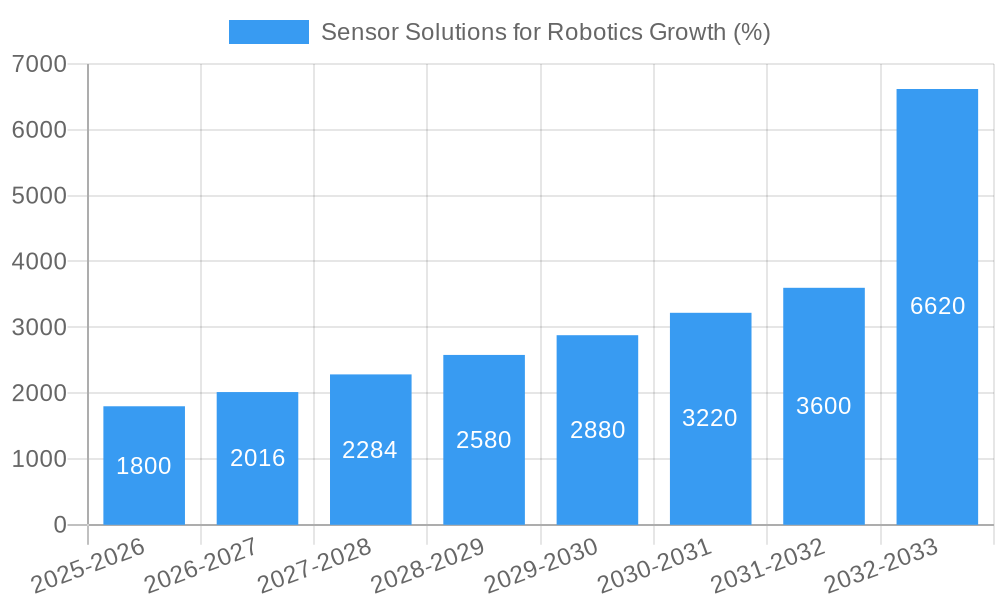
The global market for sensor solutions in robotics is experiencing robust growth, driven by the increasing adoption of automation across various industries. The market, estimated at $15 billion in 2025, is projected to expand at a Compound Annual Growth Rate (CAGR) of 12% from 2025 to 2033, reaching approximately $40 billion by 2033. This surge is fueled by several key factors. Firstly, the rising demand for sophisticated robotic systems in manufacturing, logistics, and healthcare is creating a significant need for advanced sensor technologies enabling precise perception, navigation, and manipulation. Secondly, technological advancements, such as the miniaturization of sensors, improved sensor fusion techniques, and the development of AI-powered sensor data processing, are enhancing the capabilities and reliability of robotic systems. Furthermore, the increasing affordability of robotic solutions and the growing awareness of their potential to increase productivity and efficiency are accelerating market penetration across diverse sectors.
However, despite the positive outlook, the market faces some challenges. The high initial investment costs associated with integrating sensor solutions into robotic systems can be a barrier for small and medium-sized enterprises (SMEs). Furthermore, the complexity of integrating and calibrating diverse sensor types can present technical hurdles, particularly in complex robotic applications. Nevertheless, ongoing innovation and the development of user-friendly integration solutions are expected to mitigate these challenges and pave the way for broader adoption. Key players like Basler, Cognex, and SICK AG are actively shaping market trends through continuous innovation and strategic partnerships, while new entrants are focusing on niche applications and cost-effective solutions. The diverse range of sensor technologies, including vision systems, proximity sensors, force sensors and LiDAR, are further fueling the market's expansion across various segments.
Sensor Solutions for Robotics Market Report: 2019-2033
This comprehensive report provides an in-depth analysis of the global Sensor Solutions for Robotics market, projecting a multi-million-dollar valuation by 2033. The study covers the period from 2019 to 2033, with 2025 serving as the base and estimated year. The report offers actionable insights for industry professionals, investors, and stakeholders seeking to understand the market dynamics, growth drivers, and future opportunities. Leveraging extensive data analysis, this report identifies key trends and provides forecasts for market segments and regional growth.
Sensor Solutions for Robotics Market Structure & Innovation Trends
This section analyzes the competitive landscape, innovation drivers, and regulatory factors influencing the Sensor Solutions for Robotics market. The market is characterized by a moderately concentrated structure with several key players holding significant market share. By 2025, the top five players—Cognex, SICK AG, Keyence, Basler, and Omron Adept Technologies—are estimated to collectively hold approximately xx% of the market share. Innovation is driven by advancements in sensor technologies, such as LiDAR, vision systems, and 3D cameras, increasing the sophistication and functionality of robotic systems. Regulatory frameworks, particularly those related to safety and data privacy, are increasingly influencing market developments. Product substitutes, such as alternative automation solutions, pose a moderate competitive threat. The market demonstrates significant end-user diversity across various industries, including manufacturing, logistics, healthcare, and agriculture. M&A activity in the sector is relatively high, with deal values exceeding $xx million in the historical period (2019-2024), driven by the consolidation of technology and expansion of market reach. Key M&A transactions include (examples of mergers and acquisitions will be listed here with deal values if available).
- Market Concentration: Moderately Concentrated
- Key Players Market Share (2025 Estimate): Cognex (xx%), SICK AG (xx%), Keyence (xx%), Basler (xx%), Omron Adept Technologies (xx%)
- M&A Deal Value (2019-2024): > $xx million
Sensor Solutions for Robotics Market Dynamics & Trends
The Sensor Solutions for Robotics market is experiencing robust growth, driven by several key factors. The increasing adoption of automation in various industries, fueled by the need for increased efficiency and productivity, is a major catalyst. Technological advancements in sensor technology, such as improved accuracy, resolution, and processing speeds, are further enhancing the capabilities of robotic systems. Consumer preference for high-quality, reliable, and cost-effective robotic solutions is shaping market demand. Intense competition among key players is leading to product innovation and price reductions. The Compound Annual Growth Rate (CAGR) for the forecast period (2025-2033) is estimated at xx%, indicating a significant expansion of the market. Market penetration is projected to increase from xx% in 2025 to xx% by 2033, demonstrating substantial growth potential.
Dominant Regions & Segments in Sensor Solutions for Robotics
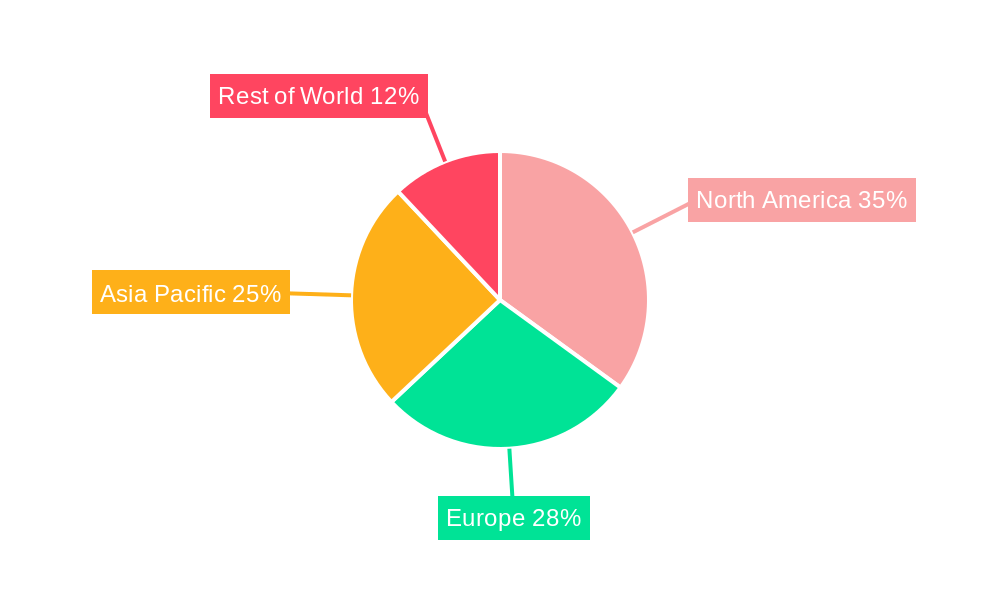
The North American region is currently the dominant market for sensor solutions in robotics, driven by factors such as strong industrial automation adoption, robust technological advancements, and significant investments in R&D. Key drivers contributing to the region's dominance include:
- Robust industrial base: A highly developed manufacturing sector fosters high demand for advanced robotic systems.
- Favorable regulatory environment: Supportive government policies and regulations encourage automation adoption.
- High levels of technological innovation: Significant R&D investments drive technological advancements in the field.
Analysis of Regional Dominance (North America): North America leads due to its mature automation market, high technological expertise, and substantial investments in robotics. This is further compounded by the high concentration of major sensor manufacturers in the region. However, Asia-Pacific is expected to witness significant growth in the forecast period, driven by increasing industrialization and government initiatives promoting automation across various sectors. Europe also holds a considerable market share due to its advanced manufacturing sector and focus on Industry 4.0 initiatives.
Sensor Solutions for Robotics Product Innovations
Recent years have witnessed significant advancements in sensor technology for robotics. The development of high-resolution 3D vision systems, sophisticated LiDAR sensors, and advanced force/torque sensors has revolutionized the capabilities of robotic systems. These innovations have expanded robotic applications beyond traditional manufacturing processes into new areas like healthcare, logistics, and agriculture. The integration of artificial intelligence (AI) and machine learning (ML) further enhances sensor performance and facilitates autonomous operation. Competitive advantages are largely derived from sensor accuracy, processing speed, reliability, and cost-effectiveness.
Report Scope & Segmentation Analysis
This report segments the Sensor Solutions for Robotics market based on several key factors. These include sensor type (vision sensors, proximity sensors, force/torque sensors, etc.), robot type (industrial robots, collaborative robots, mobile robots), application (material handling, welding, assembly, inspection, etc.), and end-user industry (automotive, electronics, food & beverage, etc.). Each segment is analyzed individually, providing detailed growth projections, market size estimations, and competitive dynamics. The market is expected to experience significant growth across all segments, driven by the increasing demand for advanced robotic systems in various industries.
Key Drivers of Sensor Solutions for Robotics Growth
The growth of the Sensor Solutions for Robotics market is fueled by several key factors. The increasing demand for automation across industries, particularly in manufacturing, logistics, and healthcare, is a primary driver. Advancements in sensor technologies are leading to more precise, reliable, and cost-effective robotic solutions. Favorable government policies and initiatives supporting automation adoption are also contributing to market growth. Moreover, the growing need for improved efficiency, productivity, and quality control in various manufacturing processes is boosting the demand for advanced robotic systems with sophisticated sensor integration. The development of collaborative robots (cobots) is also driving market expansion, as they require advanced sensing capabilities for safe and efficient human-robot interaction.
Challenges in the Sensor Solutions for Robotics Sector
The Sensor Solutions for Robotics sector faces several challenges. High initial investment costs associated with adopting robotic systems can hinder market penetration, especially among small and medium-sized enterprises (SMEs). Supply chain disruptions and the availability of specialized components can pose significant obstacles. Competition in the market is fierce, with many companies vying for market share. Stringent safety regulations, data privacy concerns, and the need for skilled labor to operate and maintain these systems also pose challenges. These challenges, while substantial, are not insurmountable and are being actively addressed by industry players and policymakers.
Emerging Opportunities in Sensor Solutions for Robotics
The Sensor Solutions for Robotics market presents significant emerging opportunities. The rising adoption of AI and ML in robotics is driving the demand for more intelligent sensors capable of processing large amounts of data. The growth of the collaborative robot market presents a significant opportunity for sensor manufacturers to develop specialized sensors for safe human-robot interaction. New markets, such as agriculture, healthcare, and construction, are emerging as potential growth areas for robotic systems integrating advanced sensor solutions. The development of miniaturized and low-cost sensors is expanding the potential applications of robotics across various industries.
Leading Players in the Sensor Solutions for Robotics Market
- Basler
- Cognex
- ISRA VISION
- KEYENCE
- Omron Adept Technologies
- FANUC
- FARO Technologies
- Matrox
- MVTec Software
- National Instruments
- Robotic VISION Technologies
- SICK AG
- Teledyne Technologies
- Tordivel
- Visio Nerf
- Datalogic
Key Developments in Sensor Solutions for Robotics Industry
- January 2023: Cognex launched a new high-resolution 3D vision system.
- March 2022: SICK AG and a key competitor announced a strategic partnership to develop advanced sensor technologies.
- (Add more key developments with dates)
Future Outlook for Sensor Solutions for Robotics Market
The future outlook for the Sensor Solutions for Robotics market is highly positive. Continued advancements in sensor technologies, coupled with increasing adoption of automation across diverse industries, will drive significant market growth in the coming years. The integration of AI and ML will further enhance sensor capabilities, leading to more intelligent and autonomous robotic systems. New application areas and emerging markets will offer significant growth opportunities for sensor manufacturers. The overall market is poised for substantial expansion, driven by a convergence of technological innovation, industrial demand, and favorable market conditions.
Sensor Solutions for Robotics Segmentation
-
1. Application
- 1.1. Automotive
- 1.2. Electronics & Semiconductor
- 1.3. Pharmaceuticals
- 1.4. Food & Packaging
- 1.5. Others
-
2. Types
- 2.1. 2D Robotic Vision Sensor
- 2.2. 3D Robotic Vision Sensor
- 2.3. Others
Sensor Solutions for Robotics Segmentation By Geography
-
1. North America
- 1.1. United States
- 1.2. Canada
- 1.3. Mexico
-
2. South America
- 2.1. Brazil
- 2.2. Argentina
- 2.3. Rest of South America
-
3. Europe
- 3.1. United Kingdom
- 3.2. Germany
- 3.3. France
- 3.4. Italy
- 3.5. Spain
- 3.6. Russia
- 3.7. Benelux
- 3.8. Nordics
- 3.9. Rest of Europe
-
4. Middle East & Africa
- 4.1. Turkey
- 4.2. Israel
- 4.3. GCC
- 4.4. North Africa
- 4.5. South Africa
- 4.6. Rest of Middle East & Africa
-
5. Asia Pacific
- 5.1. China
- 5.2. India
- 5.3. Japan
- 5.4. South Korea
- 5.5. ASEAN
- 5.6. Oceania
- 5.7. Rest of Asia Pacific
Sensor Solutions for Robotics REPORT HIGHLIGHTS
| Aspects | Details |
|---|---|
| Study Period | 2019-2033 |
| Base Year | 2024 |
| Estimated Year | 2025 |
| Forecast Period | 2025-2033 |
| Historical Period | 2019-2024 |
| Growth Rate | CAGR of XX% from 2019-2033 |
| Segmentation |
|
Table of Contents
- 1. Introduction
- 1.1. Research Scope
- 1.2. Market Segmentation
- 1.3. Research Methodology
- 1.4. Definitions and Assumptions
- 2. Executive Summary
- 2.1. Introduction
- 3. Market Dynamics
- 3.1. Introduction
- 3.2. Market Drivers
- 3.3. Market Restrains
- 3.4. Market Trends
- 4. Market Factor Analysis
- 4.1. Porters Five Forces
- 4.2. Supply/Value Chain
- 4.3. PESTEL analysis
- 4.4. Market Entropy
- 4.5. Patent/Trademark Analysis
- 5. Global Sensor Solutions for Robotics Analysis, Insights and Forecast, 2019-2031
- 5.1. Market Analysis, Insights and Forecast - by Application
- 5.1.1. Automotive
- 5.1.2. Electronics & Semiconductor
- 5.1.3. Pharmaceuticals
- 5.1.4. Food & Packaging
- 5.1.5. Others
- 5.2. Market Analysis, Insights and Forecast - by Types
- 5.2.1. 2D Robotic Vision Sensor
- 5.2.2. 3D Robotic Vision Sensor
- 5.2.3. Others
- 5.3. Market Analysis, Insights and Forecast - by Region
- 5.3.1. North America
- 5.3.2. South America
- 5.3.3. Europe
- 5.3.4. Middle East & Africa
- 5.3.5. Asia Pacific
- 5.1. Market Analysis, Insights and Forecast - by Application
- 6. North America Sensor Solutions for Robotics Analysis, Insights and Forecast, 2019-2031
- 6.1. Market Analysis, Insights and Forecast - by Application
- 6.1.1. Automotive
- 6.1.2. Electronics & Semiconductor
- 6.1.3. Pharmaceuticals
- 6.1.4. Food & Packaging
- 6.1.5. Others
- 6.2. Market Analysis, Insights and Forecast - by Types
- 6.2.1. 2D Robotic Vision Sensor
- 6.2.2. 3D Robotic Vision Sensor
- 6.2.3. Others
- 6.1. Market Analysis, Insights and Forecast - by Application
- 7. South America Sensor Solutions for Robotics Analysis, Insights and Forecast, 2019-2031
- 7.1. Market Analysis, Insights and Forecast - by Application
- 7.1.1. Automotive
- 7.1.2. Electronics & Semiconductor
- 7.1.3. Pharmaceuticals
- 7.1.4. Food & Packaging
- 7.1.5. Others
- 7.2. Market Analysis, Insights and Forecast - by Types
- 7.2.1. 2D Robotic Vision Sensor
- 7.2.2. 3D Robotic Vision Sensor
- 7.2.3. Others
- 7.1. Market Analysis, Insights and Forecast - by Application
- 8. Europe Sensor Solutions for Robotics Analysis, Insights and Forecast, 2019-2031
- 8.1. Market Analysis, Insights and Forecast - by Application
- 8.1.1. Automotive
- 8.1.2. Electronics & Semiconductor
- 8.1.3. Pharmaceuticals
- 8.1.4. Food & Packaging
- 8.1.5. Others
- 8.2. Market Analysis, Insights and Forecast - by Types
- 8.2.1. 2D Robotic Vision Sensor
- 8.2.2. 3D Robotic Vision Sensor
- 8.2.3. Others
- 8.1. Market Analysis, Insights and Forecast - by Application
- 9. Middle East & Africa Sensor Solutions for Robotics Analysis, Insights and Forecast, 2019-2031
- 9.1. Market Analysis, Insights and Forecast - by Application
- 9.1.1. Automotive
- 9.1.2. Electronics & Semiconductor
- 9.1.3. Pharmaceuticals
- 9.1.4. Food & Packaging
- 9.1.5. Others
- 9.2. Market Analysis, Insights and Forecast - by Types
- 9.2.1. 2D Robotic Vision Sensor
- 9.2.2. 3D Robotic Vision Sensor
- 9.2.3. Others
- 9.1. Market Analysis, Insights and Forecast - by Application
- 10. Asia Pacific Sensor Solutions for Robotics Analysis, Insights and Forecast, 2019-2031
- 10.1. Market Analysis, Insights and Forecast - by Application
- 10.1.1. Automotive
- 10.1.2. Electronics & Semiconductor
- 10.1.3. Pharmaceuticals
- 10.1.4. Food & Packaging
- 10.1.5. Others
- 10.2. Market Analysis, Insights and Forecast - by Types
- 10.2.1. 2D Robotic Vision Sensor
- 10.2.2. 3D Robotic Vision Sensor
- 10.2.3. Others
- 10.1. Market Analysis, Insights and Forecast - by Application
- 11. Competitive Analysis
- 11.1. Global Market Share Analysis 2024
- 11.2. Company Profiles
- 11.2.1 Basler
- 11.2.1.1. Overview
- 11.2.1.2. Products
- 11.2.1.3. SWOT Analysis
- 11.2.1.4. Recent Developments
- 11.2.1.5. Financials (Based on Availability)
- 11.2.2 Cognex
- 11.2.2.1. Overview
- 11.2.2.2. Products
- 11.2.2.3. SWOT Analysis
- 11.2.2.4. Recent Developments
- 11.2.2.5. Financials (Based on Availability)
- 11.2.3 ISRA VISION
- 11.2.3.1. Overview
- 11.2.3.2. Products
- 11.2.3.3. SWOT Analysis
- 11.2.3.4. Recent Developments
- 11.2.3.5. Financials (Based on Availability)
- 11.2.4 KEYENCE
- 11.2.4.1. Overview
- 11.2.4.2. Products
- 11.2.4.3. SWOT Analysis
- 11.2.4.4. Recent Developments
- 11.2.4.5. Financials (Based on Availability)
- 11.2.5 Omron Adept Technologies
- 11.2.5.1. Overview
- 11.2.5.2. Products
- 11.2.5.3. SWOT Analysis
- 11.2.5.4. Recent Developments
- 11.2.5.5. Financials (Based on Availability)
- 11.2.6 FANUC
- 11.2.6.1. Overview
- 11.2.6.2. Products
- 11.2.6.3. SWOT Analysis
- 11.2.6.4. Recent Developments
- 11.2.6.5. Financials (Based on Availability)
- 11.2.7 FARO Technologies
- 11.2.7.1. Overview
- 11.2.7.2. Products
- 11.2.7.3. SWOT Analysis
- 11.2.7.4. Recent Developments
- 11.2.7.5. Financials (Based on Availability)
- 11.2.8 Matrox
- 11.2.8.1. Overview
- 11.2.8.2. Products
- 11.2.8.3. SWOT Analysis
- 11.2.8.4. Recent Developments
- 11.2.8.5. Financials (Based on Availability)
- 11.2.9 MVTec Software
- 11.2.9.1. Overview
- 11.2.9.2. Products
- 11.2.9.3. SWOT Analysis
- 11.2.9.4. Recent Developments
- 11.2.9.5. Financials (Based on Availability)
- 11.2.10 National Instruments
- 11.2.10.1. Overview
- 11.2.10.2. Products
- 11.2.10.3. SWOT Analysis
- 11.2.10.4. Recent Developments
- 11.2.10.5. Financials (Based on Availability)
- 11.2.11 Robotic VISION Technologies
- 11.2.11.1. Overview
- 11.2.11.2. Products
- 11.2.11.3. SWOT Analysis
- 11.2.11.4. Recent Developments
- 11.2.11.5. Financials (Based on Availability)
- 11.2.12 SICK AG
- 11.2.12.1. Overview
- 11.2.12.2. Products
- 11.2.12.3. SWOT Analysis
- 11.2.12.4. Recent Developments
- 11.2.12.5. Financials (Based on Availability)
- 11.2.13 Teledyne Technologies
- 11.2.13.1. Overview
- 11.2.13.2. Products
- 11.2.13.3. SWOT Analysis
- 11.2.13.4. Recent Developments
- 11.2.13.5. Financials (Based on Availability)
- 11.2.14 Tordivel
- 11.2.14.1. Overview
- 11.2.14.2. Products
- 11.2.14.3. SWOT Analysis
- 11.2.14.4. Recent Developments
- 11.2.14.5. Financials (Based on Availability)
- 11.2.15 Visio Nerf
- 11.2.15.1. Overview
- 11.2.15.2. Products
- 11.2.15.3. SWOT Analysis
- 11.2.15.4. Recent Developments
- 11.2.15.5. Financials (Based on Availability)
- 11.2.16 Datalogic
- 11.2.16.1. Overview
- 11.2.16.2. Products
- 11.2.16.3. SWOT Analysis
- 11.2.16.4. Recent Developments
- 11.2.16.5. Financials (Based on Availability)
- 11.2.1 Basler
List of Figures
- Figure 1: Global Sensor Solutions for Robotics Revenue Breakdown (million, %) by Region 2024 & 2032
- Figure 2: Global Sensor Solutions for Robotics Volume Breakdown (K, %) by Region 2024 & 2032
- Figure 3: North America Sensor Solutions for Robotics Revenue (million), by Application 2024 & 2032
- Figure 4: North America Sensor Solutions for Robotics Volume (K), by Application 2024 & 2032
- Figure 5: North America Sensor Solutions for Robotics Revenue Share (%), by Application 2024 & 2032
- Figure 6: North America Sensor Solutions for Robotics Volume Share (%), by Application 2024 & 2032
- Figure 7: North America Sensor Solutions for Robotics Revenue (million), by Types 2024 & 2032
- Figure 8: North America Sensor Solutions for Robotics Volume (K), by Types 2024 & 2032
- Figure 9: North America Sensor Solutions for Robotics Revenue Share (%), by Types 2024 & 2032
- Figure 10: North America Sensor Solutions for Robotics Volume Share (%), by Types 2024 & 2032
- Figure 11: North America Sensor Solutions for Robotics Revenue (million), by Country 2024 & 2032
- Figure 12: North America Sensor Solutions for Robotics Volume (K), by Country 2024 & 2032
- Figure 13: North America Sensor Solutions for Robotics Revenue Share (%), by Country 2024 & 2032
- Figure 14: North America Sensor Solutions for Robotics Volume Share (%), by Country 2024 & 2032
- Figure 15: South America Sensor Solutions for Robotics Revenue (million), by Application 2024 & 2032
- Figure 16: South America Sensor Solutions for Robotics Volume (K), by Application 2024 & 2032
- Figure 17: South America Sensor Solutions for Robotics Revenue Share (%), by Application 2024 & 2032
- Figure 18: South America Sensor Solutions for Robotics Volume Share (%), by Application 2024 & 2032
- Figure 19: South America Sensor Solutions for Robotics Revenue (million), by Types 2024 & 2032
- Figure 20: South America Sensor Solutions for Robotics Volume (K), by Types 2024 & 2032
- Figure 21: South America Sensor Solutions for Robotics Revenue Share (%), by Types 2024 & 2032
- Figure 22: South America Sensor Solutions for Robotics Volume Share (%), by Types 2024 & 2032
- Figure 23: South America Sensor Solutions for Robotics Revenue (million), by Country 2024 & 2032
- Figure 24: South America Sensor Solutions for Robotics Volume (K), by Country 2024 & 2032
- Figure 25: South America Sensor Solutions for Robotics Revenue Share (%), by Country 2024 & 2032
- Figure 26: South America Sensor Solutions for Robotics Volume Share (%), by Country 2024 & 2032
- Figure 27: Europe Sensor Solutions for Robotics Revenue (million), by Application 2024 & 2032
- Figure 28: Europe Sensor Solutions for Robotics Volume (K), by Application 2024 & 2032
- Figure 29: Europe Sensor Solutions for Robotics Revenue Share (%), by Application 2024 & 2032
- Figure 30: Europe Sensor Solutions for Robotics Volume Share (%), by Application 2024 & 2032
- Figure 31: Europe Sensor Solutions for Robotics Revenue (million), by Types 2024 & 2032
- Figure 32: Europe Sensor Solutions for Robotics Volume (K), by Types 2024 & 2032
- Figure 33: Europe Sensor Solutions for Robotics Revenue Share (%), by Types 2024 & 2032
- Figure 34: Europe Sensor Solutions for Robotics Volume Share (%), by Types 2024 & 2032
- Figure 35: Europe Sensor Solutions for Robotics Revenue (million), by Country 2024 & 2032
- Figure 36: Europe Sensor Solutions for Robotics Volume (K), by Country 2024 & 2032
- Figure 37: Europe Sensor Solutions for Robotics Revenue Share (%), by Country 2024 & 2032
- Figure 38: Europe Sensor Solutions for Robotics Volume Share (%), by Country 2024 & 2032
- Figure 39: Middle East & Africa Sensor Solutions for Robotics Revenue (million), by Application 2024 & 2032
- Figure 40: Middle East & Africa Sensor Solutions for Robotics Volume (K), by Application 2024 & 2032
- Figure 41: Middle East & Africa Sensor Solutions for Robotics Revenue Share (%), by Application 2024 & 2032
- Figure 42: Middle East & Africa Sensor Solutions for Robotics Volume Share (%), by Application 2024 & 2032
- Figure 43: Middle East & Africa Sensor Solutions for Robotics Revenue (million), by Types 2024 & 2032
- Figure 44: Middle East & Africa Sensor Solutions for Robotics Volume (K), by Types 2024 & 2032
- Figure 45: Middle East & Africa Sensor Solutions for Robotics Revenue Share (%), by Types 2024 & 2032
- Figure 46: Middle East & Africa Sensor Solutions for Robotics Volume Share (%), by Types 2024 & 2032
- Figure 47: Middle East & Africa Sensor Solutions for Robotics Revenue (million), by Country 2024 & 2032
- Figure 48: Middle East & Africa Sensor Solutions for Robotics Volume (K), by Country 2024 & 2032
- Figure 49: Middle East & Africa Sensor Solutions for Robotics Revenue Share (%), by Country 2024 & 2032
- Figure 50: Middle East & Africa Sensor Solutions for Robotics Volume Share (%), by Country 2024 & 2032
- Figure 51: Asia Pacific Sensor Solutions for Robotics Revenue (million), by Application 2024 & 2032
- Figure 52: Asia Pacific Sensor Solutions for Robotics Volume (K), by Application 2024 & 2032
- Figure 53: Asia Pacific Sensor Solutions for Robotics Revenue Share (%), by Application 2024 & 2032
- Figure 54: Asia Pacific Sensor Solutions for Robotics Volume Share (%), by Application 2024 & 2032
- Figure 55: Asia Pacific Sensor Solutions for Robotics Revenue (million), by Types 2024 & 2032
- Figure 56: Asia Pacific Sensor Solutions for Robotics Volume (K), by Types 2024 & 2032
- Figure 57: Asia Pacific Sensor Solutions for Robotics Revenue Share (%), by Types 2024 & 2032
- Figure 58: Asia Pacific Sensor Solutions for Robotics Volume Share (%), by Types 2024 & 2032
- Figure 59: Asia Pacific Sensor Solutions for Robotics Revenue (million), by Country 2024 & 2032
- Figure 60: Asia Pacific Sensor Solutions for Robotics Volume (K), by Country 2024 & 2032
- Figure 61: Asia Pacific Sensor Solutions for Robotics Revenue Share (%), by Country 2024 & 2032
- Figure 62: Asia Pacific Sensor Solutions for Robotics Volume Share (%), by Country 2024 & 2032
List of Tables
- Table 1: Global Sensor Solutions for Robotics Revenue million Forecast, by Region 2019 & 2032
- Table 2: Global Sensor Solutions for Robotics Volume K Forecast, by Region 2019 & 2032
- Table 3: Global Sensor Solutions for Robotics Revenue million Forecast, by Application 2019 & 2032
- Table 4: Global Sensor Solutions for Robotics Volume K Forecast, by Application 2019 & 2032
- Table 5: Global Sensor Solutions for Robotics Revenue million Forecast, by Types 2019 & 2032
- Table 6: Global Sensor Solutions for Robotics Volume K Forecast, by Types 2019 & 2032
- Table 7: Global Sensor Solutions for Robotics Revenue million Forecast, by Region 2019 & 2032
- Table 8: Global Sensor Solutions for Robotics Volume K Forecast, by Region 2019 & 2032
- Table 9: Global Sensor Solutions for Robotics Revenue million Forecast, by Application 2019 & 2032
- Table 10: Global Sensor Solutions for Robotics Volume K Forecast, by Application 2019 & 2032
- Table 11: Global Sensor Solutions for Robotics Revenue million Forecast, by Types 2019 & 2032
- Table 12: Global Sensor Solutions for Robotics Volume K Forecast, by Types 2019 & 2032
- Table 13: Global Sensor Solutions for Robotics Revenue million Forecast, by Country 2019 & 2032
- Table 14: Global Sensor Solutions for Robotics Volume K Forecast, by Country 2019 & 2032
- Table 15: United States Sensor Solutions for Robotics Revenue (million) Forecast, by Application 2019 & 2032
- Table 16: United States Sensor Solutions for Robotics Volume (K) Forecast, by Application 2019 & 2032
- Table 17: Canada Sensor Solutions for Robotics Revenue (million) Forecast, by Application 2019 & 2032
- Table 18: Canada Sensor Solutions for Robotics Volume (K) Forecast, by Application 2019 & 2032
- Table 19: Mexico Sensor Solutions for Robotics Revenue (million) Forecast, by Application 2019 & 2032
- Table 20: Mexico Sensor Solutions for Robotics Volume (K) Forecast, by Application 2019 & 2032
- Table 21: Global Sensor Solutions for Robotics Revenue million Forecast, by Application 2019 & 2032
- Table 22: Global Sensor Solutions for Robotics Volume K Forecast, by Application 2019 & 2032
- Table 23: Global Sensor Solutions for Robotics Revenue million Forecast, by Types 2019 & 2032
- Table 24: Global Sensor Solutions for Robotics Volume K Forecast, by Types 2019 & 2032
- Table 25: Global Sensor Solutions for Robotics Revenue million Forecast, by Country 2019 & 2032
- Table 26: Global Sensor Solutions for Robotics Volume K Forecast, by Country 2019 & 2032
- Table 27: Brazil Sensor Solutions for Robotics Revenue (million) Forecast, by Application 2019 & 2032
- Table 28: Brazil Sensor Solutions for Robotics Volume (K) Forecast, by Application 2019 & 2032
- Table 29: Argentina Sensor Solutions for Robotics Revenue (million) Forecast, by Application 2019 & 2032
- Table 30: Argentina Sensor Solutions for Robotics Volume (K) Forecast, by Application 2019 & 2032
- Table 31: Rest of South America Sensor Solutions for Robotics Revenue (million) Forecast, by Application 2019 & 2032
- Table 32: Rest of South America Sensor Solutions for Robotics Volume (K) Forecast, by Application 2019 & 2032
- Table 33: Global Sensor Solutions for Robotics Revenue million Forecast, by Application 2019 & 2032
- Table 34: Global Sensor Solutions for Robotics Volume K Forecast, by Application 2019 & 2032
- Table 35: Global Sensor Solutions for Robotics Revenue million Forecast, by Types 2019 & 2032
- Table 36: Global Sensor Solutions for Robotics Volume K Forecast, by Types 2019 & 2032
- Table 37: Global Sensor Solutions for Robotics Revenue million Forecast, by Country 2019 & 2032
- Table 38: Global Sensor Solutions for Robotics Volume K Forecast, by Country 2019 & 2032
- Table 39: United Kingdom Sensor Solutions for Robotics Revenue (million) Forecast, by Application 2019 & 2032
- Table 40: United Kingdom Sensor Solutions for Robotics Volume (K) Forecast, by Application 2019 & 2032
- Table 41: Germany Sensor Solutions for Robotics Revenue (million) Forecast, by Application 2019 & 2032
- Table 42: Germany Sensor Solutions for Robotics Volume (K) Forecast, by Application 2019 & 2032
- Table 43: France Sensor Solutions for Robotics Revenue (million) Forecast, by Application 2019 & 2032
- Table 44: France Sensor Solutions for Robotics Volume (K) Forecast, by Application 2019 & 2032
- Table 45: Italy Sensor Solutions for Robotics Revenue (million) Forecast, by Application 2019 & 2032
- Table 46: Italy Sensor Solutions for Robotics Volume (K) Forecast, by Application 2019 & 2032
- Table 47: Spain Sensor Solutions for Robotics Revenue (million) Forecast, by Application 2019 & 2032
- Table 48: Spain Sensor Solutions for Robotics Volume (K) Forecast, by Application 2019 & 2032
- Table 49: Russia Sensor Solutions for Robotics Revenue (million) Forecast, by Application 2019 & 2032
- Table 50: Russia Sensor Solutions for Robotics Volume (K) Forecast, by Application 2019 & 2032
- Table 51: Benelux Sensor Solutions for Robotics Revenue (million) Forecast, by Application 2019 & 2032
- Table 52: Benelux Sensor Solutions for Robotics Volume (K) Forecast, by Application 2019 & 2032
- Table 53: Nordics Sensor Solutions for Robotics Revenue (million) Forecast, by Application 2019 & 2032
- Table 54: Nordics Sensor Solutions for Robotics Volume (K) Forecast, by Application 2019 & 2032
- Table 55: Rest of Europe Sensor Solutions for Robotics Revenue (million) Forecast, by Application 2019 & 2032
- Table 56: Rest of Europe Sensor Solutions for Robotics Volume (K) Forecast, by Application 2019 & 2032
- Table 57: Global Sensor Solutions for Robotics Revenue million Forecast, by Application 2019 & 2032
- Table 58: Global Sensor Solutions for Robotics Volume K Forecast, by Application 2019 & 2032
- Table 59: Global Sensor Solutions for Robotics Revenue million Forecast, by Types 2019 & 2032
- Table 60: Global Sensor Solutions for Robotics Volume K Forecast, by Types 2019 & 2032
- Table 61: Global Sensor Solutions for Robotics Revenue million Forecast, by Country 2019 & 2032
- Table 62: Global Sensor Solutions for Robotics Volume K Forecast, by Country 2019 & 2032
- Table 63: Turkey Sensor Solutions for Robotics Revenue (million) Forecast, by Application 2019 & 2032
- Table 64: Turkey Sensor Solutions for Robotics Volume (K) Forecast, by Application 2019 & 2032
- Table 65: Israel Sensor Solutions for Robotics Revenue (million) Forecast, by Application 2019 & 2032
- Table 66: Israel Sensor Solutions for Robotics Volume (K) Forecast, by Application 2019 & 2032
- Table 67: GCC Sensor Solutions for Robotics Revenue (million) Forecast, by Application 2019 & 2032
- Table 68: GCC Sensor Solutions for Robotics Volume (K) Forecast, by Application 2019 & 2032
- Table 69: North Africa Sensor Solutions for Robotics Revenue (million) Forecast, by Application 2019 & 2032
- Table 70: North Africa Sensor Solutions for Robotics Volume (K) Forecast, by Application 2019 & 2032
- Table 71: South Africa Sensor Solutions for Robotics Revenue (million) Forecast, by Application 2019 & 2032
- Table 72: South Africa Sensor Solutions for Robotics Volume (K) Forecast, by Application 2019 & 2032
- Table 73: Rest of Middle East & Africa Sensor Solutions for Robotics Revenue (million) Forecast, by Application 2019 & 2032
- Table 74: Rest of Middle East & Africa Sensor Solutions for Robotics Volume (K) Forecast, by Application 2019 & 2032
- Table 75: Global Sensor Solutions for Robotics Revenue million Forecast, by Application 2019 & 2032
- Table 76: Global Sensor Solutions for Robotics Volume K Forecast, by Application 2019 & 2032
- Table 77: Global Sensor Solutions for Robotics Revenue million Forecast, by Types 2019 & 2032
- Table 78: Global Sensor Solutions for Robotics Volume K Forecast, by Types 2019 & 2032
- Table 79: Global Sensor Solutions for Robotics Revenue million Forecast, by Country 2019 & 2032
- Table 80: Global Sensor Solutions for Robotics Volume K Forecast, by Country 2019 & 2032
- Table 81: China Sensor Solutions for Robotics Revenue (million) Forecast, by Application 2019 & 2032
- Table 82: China Sensor Solutions for Robotics Volume (K) Forecast, by Application 2019 & 2032
- Table 83: India Sensor Solutions for Robotics Revenue (million) Forecast, by Application 2019 & 2032
- Table 84: India Sensor Solutions for Robotics Volume (K) Forecast, by Application 2019 & 2032
- Table 85: Japan Sensor Solutions for Robotics Revenue (million) Forecast, by Application 2019 & 2032
- Table 86: Japan Sensor Solutions for Robotics Volume (K) Forecast, by Application 2019 & 2032
- Table 87: South Korea Sensor Solutions for Robotics Revenue (million) Forecast, by Application 2019 & 2032
- Table 88: South Korea Sensor Solutions for Robotics Volume (K) Forecast, by Application 2019 & 2032
- Table 89: ASEAN Sensor Solutions for Robotics Revenue (million) Forecast, by Application 2019 & 2032
- Table 90: ASEAN Sensor Solutions for Robotics Volume (K) Forecast, by Application 2019 & 2032
- Table 91: Oceania Sensor Solutions for Robotics Revenue (million) Forecast, by Application 2019 & 2032
- Table 92: Oceania Sensor Solutions for Robotics Volume (K) Forecast, by Application 2019 & 2032
- Table 93: Rest of Asia Pacific Sensor Solutions for Robotics Revenue (million) Forecast, by Application 2019 & 2032
- Table 94: Rest of Asia Pacific Sensor Solutions for Robotics Volume (K) Forecast, by Application 2019 & 2032
Frequently Asked Questions
1. What is the projected Compound Annual Growth Rate (CAGR) of the Sensor Solutions for Robotics?
The projected CAGR is approximately XX%.
2. Which companies are prominent players in the Sensor Solutions for Robotics?
Key companies in the market include Basler, Cognex, ISRA VISION, KEYENCE, Omron Adept Technologies, FANUC, FARO Technologies, Matrox, MVTec Software, National Instruments, Robotic VISION Technologies, SICK AG, Teledyne Technologies, Tordivel, Visio Nerf, Datalogic.
3. What are the main segments of the Sensor Solutions for Robotics?
The market segments include Application, Types.
4. Can you provide details about the market size?
The market size is estimated to be USD XXX million as of 2022.
5. What are some drivers contributing to market growth?
N/A
6. What are the notable trends driving market growth?
N/A
7. Are there any restraints impacting market growth?
N/A
8. Can you provide examples of recent developments in the market?
N/A
9. What pricing options are available for accessing the report?
Pricing options include single-user, multi-user, and enterprise licenses priced at USD 3350.00, USD 5025.00, and USD 6700.00 respectively.
10. Is the market size provided in terms of value or volume?
The market size is provided in terms of value, measured in million and volume, measured in K.
11. Are there any specific market keywords associated with the report?
Yes, the market keyword associated with the report is "Sensor Solutions for Robotics," which aids in identifying and referencing the specific market segment covered.
12. How do I determine which pricing option suits my needs best?
The pricing options vary based on user requirements and access needs. Individual users may opt for single-user licenses, while businesses requiring broader access may choose multi-user or enterprise licenses for cost-effective access to the report.
13. Are there any additional resources or data provided in the Sensor Solutions for Robotics report?
While the report offers comprehensive insights, it's advisable to review the specific contents or supplementary materials provided to ascertain if additional resources or data are available.
14. How can I stay updated on further developments or reports in the Sensor Solutions for Robotics?
To stay informed about further developments, trends, and reports in the Sensor Solutions for Robotics, consider subscribing to industry newsletters, following relevant companies and organizations, or regularly checking reputable industry news sources and publications.
Methodology
Step 1 - Identification of Relevant Samples Size from Population Database


Step 2 - Approaches for Defining Global Market Size (Value, Volume* & Price*)

Note*: In applicable scenarios
Step 3 - Data Sources
Primary Research
- Web Analytics
- Survey Reports
- Research Institute
- Latest Research Reports
- Opinion Leaders
Secondary Research
- Annual Reports
- White Paper
- Latest Press Release
- Industry Association
- Paid Database
- Investor Presentations

Step 4 - Data Triangulation
Involves using different sources of information in order to increase the validity of a study
These sources are likely to be stakeholders in a program - participants, other researchers, program staff, other community members, and so on.
Then we put all data in single framework & apply various statistical tools to find out the dynamic on the market.
During the analysis stage, feedback from the stakeholder groups would be compared to determine areas of agreement as well as areas of divergence


