
Key Insights
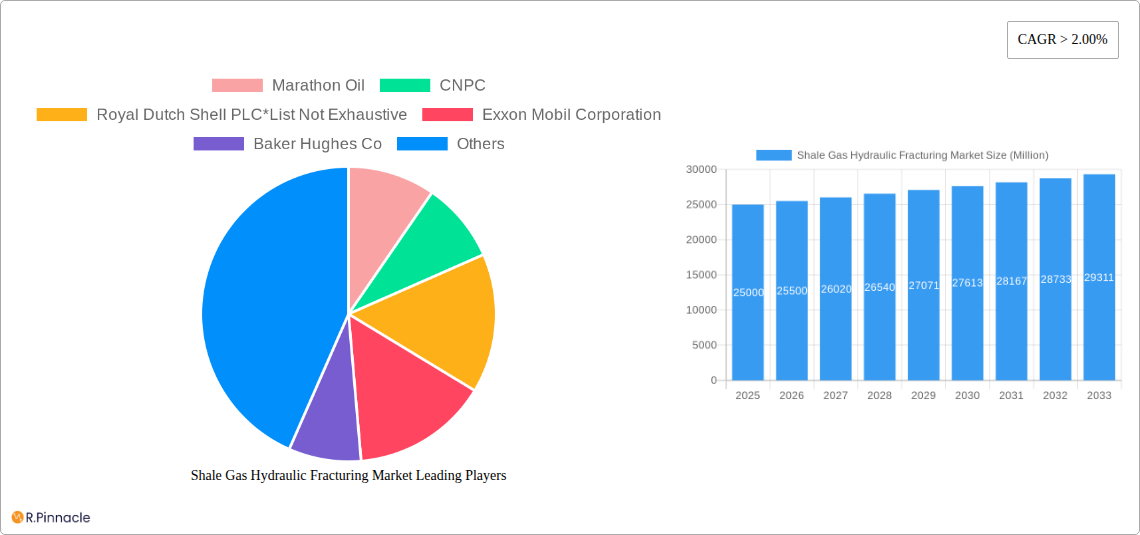
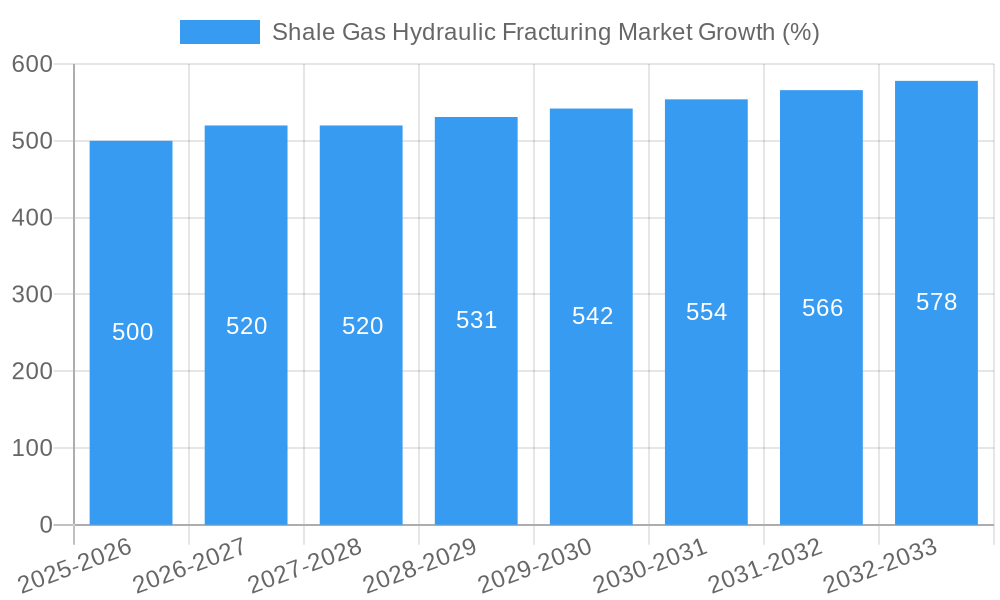
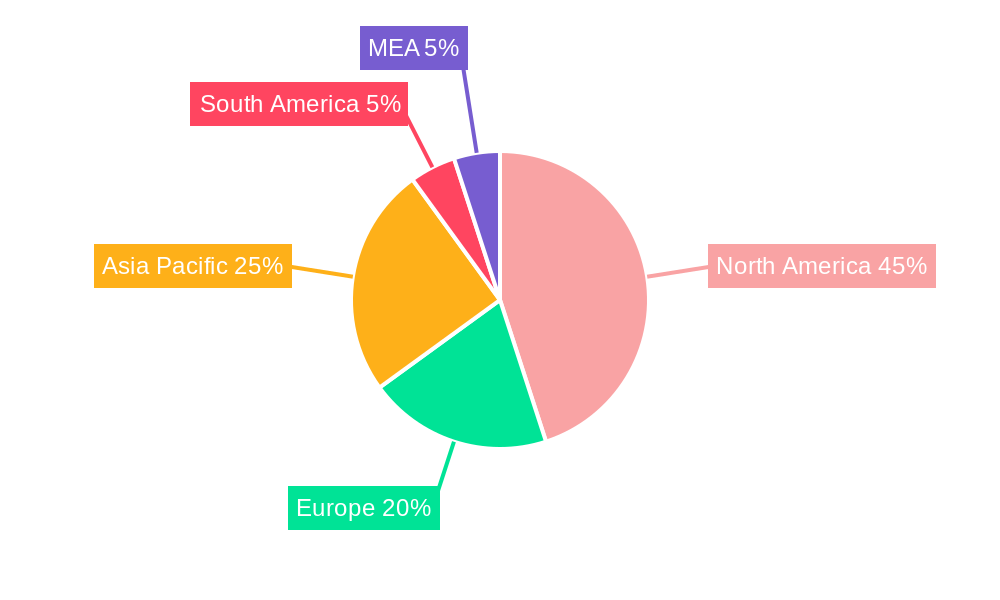
The global shale gas hydraulic fracturing market is experiencing robust growth, driven by the increasing demand for natural gas as a cleaner-burning fossil fuel and the ongoing energy transition. A compound annual growth rate (CAGR) exceeding 2.00% indicates a steadily expanding market, projected to reach significant value by 2033. This growth is fueled by technological advancements in horizontal and directional drilling techniques, leading to enhanced extraction efficiency and reduced operational costs. Furthermore, supportive government policies in several key regions, aimed at boosting domestic energy production and reducing reliance on imports, are fostering market expansion. The market is segmented by well type, with horizontal and directional drilling dominating due to their higher yield potential. Major players like Marathon Oil, CNPC, Royal Dutch Shell, ExxonMobil, Chevron, Sinopec, and BP are actively involved, driving innovation and competition. However, environmental concerns surrounding water usage, induced seismicity, and methane emissions pose significant restraints, demanding stricter regulations and the adoption of environmentally friendly practices. North America, particularly the United States and Canada, currently holds a substantial market share, fueled by extensive shale gas reserves and established infrastructure. However, Asia-Pacific and other regions are witnessing increasing activity, contributing to the overall market expansion.
The market's future trajectory hinges on several factors. The continued development of more efficient and environmentally sustainable fracturing technologies will be crucial for sustained growth. Government regulations and public perception will play a vital role in shaping market dynamics. The increasing focus on reducing carbon emissions might drive investment in carbon capture and storage technologies, further influencing the market's evolution. Geopolitical factors and energy price fluctuations will also significantly impact market demand and investment decisions. Competitive pressures among established players and emerging companies will continuously reshape the market landscape. Therefore, a comprehensive understanding of these dynamics is critical for stakeholders to navigate the opportunities and challenges presented by this dynamic market.
Shale Gas Hydraulic Fracturing Market Report: 2019-2033 Forecast
This comprehensive report provides an in-depth analysis of the global Shale Gas Hydraulic Fracturing market, offering actionable insights for industry professionals, investors, and strategic decision-makers. Covering the period from 2019 to 2033, with a focus on 2025 as the base and estimated year, this report meticulously examines market structure, dynamics, dominant segments, and key players. The study unveils significant growth opportunities and challenges within the sector, providing a crucial roadmap for navigating this dynamic landscape. With a detailed segmentation analysis of Well Types (Horizontal and Directional, Vertical) and a thorough examination of leading companies like Marathon Oil, CNPC, Royal Dutch Shell PLC, Exxon Mobil Corporation, Baker Hughes Co, ExxonMobil, Chevron Corporation, Sinopec Ltd, and BP PLC (list not exhaustive), this report is your essential resource for understanding and capitalizing on the shale gas hydraulic fracturing market.
Shale Gas Hydraulic Fracturing Market Structure & Innovation Trends
The shale gas hydraulic fracturing market exhibits a moderately concentrated structure, with a few major players holding significant market share. The market share held by the top five companies fluctuated between xx% and xx% during the historical period (2019-2024). Innovation is primarily driven by the need for enhanced efficiency, reduced environmental impact, and improved recovery rates. Regulatory frameworks vary significantly across different regions, impacting operational costs and technological adoption. Competition from alternative energy sources presents a challenge, while M&A activities are frequent, with deal values ranging from $xx Million to $xx Million in recent years, signifying consolidation efforts and expansion strategies. End-user demographics encompass both energy producers and service providers, with evolving demands influencing market trends.
Shale Gas Hydraulic Fracturing Market Dynamics & Trends
The shale gas hydraulic fracturing market is projected to experience a CAGR of xx% during the forecast period (2025-2033), fueled by increasing global energy demand and the sustained exploration and production of shale gas resources. Technological disruptions, particularly in areas like automation and data analytics, are streamlining operations and boosting efficiency. Consumer preferences, increasingly focused on sustainability, are pushing companies toward environmentally friendly practices. Competitive dynamics are intensely focused on technological advancements, cost optimization, and securing access to key resources. Market penetration of advanced fracturing technologies, such as slickwater fracturing and complex completion designs, is anticipated to reach xx% by 2033.
Dominant Regions & Segments in Shale Gas Hydraulic Fracturing Market
North America currently dominates the shale gas hydraulic fracturing market, driven by abundant shale gas reserves and well-established infrastructure.
Key Drivers in North America:
- Abundant shale gas reserves (e.g., Marcellus, Permian basins).
- Favorable regulatory environment (although evolving).
- Well-developed infrastructure for production and transportation.
- Strong technological expertise and innovation.
The Horizontal and Directional well type segment significantly outpaces the Vertical well type, holding approximately xx% of the market share in 2025. This dominance is primarily due to higher recovery rates and efficiency compared to vertical wells. This trend is expected to continue throughout the forecast period. The dominance of North America and the Horizontal/Directional segment is attributable to a combination of factors, including favorable geological conditions, supportive government policies, and advanced technological capabilities.
Shale Gas Hydraulic Fracturing Market Product Innovations
Recent product innovations focus on enhancing the efficiency and sustainability of hydraulic fracturing. This includes the development of advanced fracturing fluids, improved proppant technologies, and the adoption of digital tools for optimizing well completion designs. These innovations deliver enhanced reservoir stimulation, improved production rates, and minimized environmental impact, thereby aligning perfectly with both industry needs and increasing environmental concerns.
Report Scope & Segmentation Analysis
This report segments the shale gas hydraulic fracturing market primarily by Well Type:
Horizontal and Directional: This segment is characterized by higher initial investment costs but offers significantly higher production volumes and longer well life compared to vertical wells. Market size for this segment is projected to reach $xx Million by 2033.
Vertical: This segment represents a more traditional approach, characterized by lower initial investment but lower production volumes. The market size for vertical wells is estimated to reach $xx Million by 2033, exhibiting a slower growth rate than the horizontal segment.
Key Drivers of Shale Gas Hydraulic Fracturing Market Growth
The growth of the shale gas hydraulic fracturing market is driven by several factors, including the rising global demand for natural gas, technological advancements leading to improved efficiency and cost reductions, and supportive government policies in some key regions. Advances in horizontal drilling and hydraulic fracturing techniques have unlocked vast reserves of previously inaccessible shale gas, fueling production growth and expanding market opportunities.
Challenges in the Shale Gas Hydraulic Fracturing Market Sector
The shale gas hydraulic fracturing market faces significant challenges, including stringent environmental regulations, fluctuations in energy prices, water scarcity issues, and potential community opposition in some regions. These factors create uncertainties for investors and can impact the profitability of projects. Furthermore, the intense competition among operators and service providers puts constant pressure on pricing and margins.
Emerging Opportunities in Shale Gas Hydraulic Fracturing Market
Emerging opportunities lie in the development and adoption of more sustainable fracturing technologies, the expansion into new geographical areas with untapped shale gas reserves, and the increasing use of digital technologies to optimize well design and operational efficiency. The growing demand for natural gas as a transition fuel presents a significant long-term growth opportunity.
Leading Players in the Shale Gas Hydraulic Fracturing Market Market
- Marathon Oil
- CNPC
- Royal Dutch Shell PLC
- Exxon Mobil Corporation
- Baker Hughes Co
- ExxonMobil
- Chevron Corporation
- Sinopec Ltd
- BP PLC
Key Developments in Shale Gas Hydraulic Fracturing Market Industry
- January 2023: Company X launched a new environmentally friendly fracturing fluid.
- March 2024: Merger between Company Y and Company Z, expanding their combined market share.
- June 2024: Government Z introduces new regulations impacting hydraulic fracturing operations. (Further developments can be added here).
Future Outlook for Shale Gas Hydraulic Fracturing Market Market
The future of the shale gas hydraulic fracturing market appears positive, driven by sustained global energy demand and technological advancements that enhance efficiency and sustainability. Continued innovation in fracturing techniques, coupled with strategic investments in infrastructure development and exploration activities, will underpin market expansion. However, the long-term outlook remains contingent upon the evolving regulatory landscape and the competitive dynamics within the energy sector.
Shale Gas Hydraulic Fracturing Market Segmentation
-
1. Well Type
- 1.1. Horizontal and Directional
- 1.2. Vertical
Shale Gas Hydraulic Fracturing Market Segmentation By Geography
- 1. North America
- 2. Asia Pacific
- 3. Europe
- 4. South America
- 5. Middle East and Africa
Shale Gas Hydraulic Fracturing Market REPORT HIGHLIGHTS
| Aspects | Details |
|---|---|
| Study Period | 2019-2033 |
| Base Year | 2024 |
| Estimated Year | 2025 |
| Forecast Period | 2025-2033 |
| Historical Period | 2019-2024 |
| Growth Rate | CAGR of > 2.00% from 2019-2033 |
| Segmentation |
|
Table of Contents
- 1. Introduction
- 1.1. Research Scope
- 1.2. Market Segmentation
- 1.3. Research Methodology
- 1.4. Definitions and Assumptions
- 2. Executive Summary
- 2.1. Introduction
- 3. Market Dynamics
- 3.1. Introduction
- 3.2. Market Drivers
- 3.2.1. Increasing Demand from Industrial Applications4.; Growing Infrastructure Across the World
- 3.3. Market Restrains
- 3.3.1. A Rise in Concerns Related to Carbon Emissions and a Shift Towards Electric Vehicles and Renewable Sources of Energy
- 3.4. Market Trends
- 3.4.1. Horizontal and Directional Well Type to Witness a Significant Growth
- 4. Market Factor Analysis
- 4.1. Porters Five Forces
- 4.2. Supply/Value Chain
- 4.3. PESTEL analysis
- 4.4. Market Entropy
- 4.5. Patent/Trademark Analysis
- 5. Global Shale Gas Hydraulic Fracturing Market Analysis, Insights and Forecast, 2019-2031
- 5.1. Market Analysis, Insights and Forecast - by Well Type
- 5.1.1. Horizontal and Directional
- 5.1.2. Vertical
- 5.2. Market Analysis, Insights and Forecast - by Region
- 5.2.1. North America
- 5.2.2. Asia Pacific
- 5.2.3. Europe
- 5.2.4. South America
- 5.2.5. Middle East and Africa
- 5.1. Market Analysis, Insights and Forecast - by Well Type
- 6. North America Shale Gas Hydraulic Fracturing Market Analysis, Insights and Forecast, 2019-2031
- 6.1. Market Analysis, Insights and Forecast - by Well Type
- 6.1.1. Horizontal and Directional
- 6.1.2. Vertical
- 6.1. Market Analysis, Insights and Forecast - by Well Type
- 7. Asia Pacific Shale Gas Hydraulic Fracturing Market Analysis, Insights and Forecast, 2019-2031
- 7.1. Market Analysis, Insights and Forecast - by Well Type
- 7.1.1. Horizontal and Directional
- 7.1.2. Vertical
- 7.1. Market Analysis, Insights and Forecast - by Well Type
- 8. Europe Shale Gas Hydraulic Fracturing Market Analysis, Insights and Forecast, 2019-2031
- 8.1. Market Analysis, Insights and Forecast - by Well Type
- 8.1.1. Horizontal and Directional
- 8.1.2. Vertical
- 8.1. Market Analysis, Insights and Forecast - by Well Type
- 9. South America Shale Gas Hydraulic Fracturing Market Analysis, Insights and Forecast, 2019-2031
- 9.1. Market Analysis, Insights and Forecast - by Well Type
- 9.1.1. Horizontal and Directional
- 9.1.2. Vertical
- 9.1. Market Analysis, Insights and Forecast - by Well Type
- 10. Middle East and Africa Shale Gas Hydraulic Fracturing Market Analysis, Insights and Forecast, 2019-2031
- 10.1. Market Analysis, Insights and Forecast - by Well Type
- 10.1.1. Horizontal and Directional
- 10.1.2. Vertical
- 10.1. Market Analysis, Insights and Forecast - by Well Type
- 11. North America Shale Gas Hydraulic Fracturing Market Analysis, Insights and Forecast, 2019-2031
- 11.1. Market Analysis, Insights and Forecast - By Country/Sub-region
- 11.1.1 United States
- 11.1.2 Canada
- 11.1.3 Mexico
- 12. Europe Shale Gas Hydraulic Fracturing Market Analysis, Insights and Forecast, 2019-2031
- 12.1. Market Analysis, Insights and Forecast - By Country/Sub-region
- 12.1.1 Germany
- 12.1.2 United Kingdom
- 12.1.3 France
- 12.1.4 Spain
- 12.1.5 Italy
- 12.1.6 Spain
- 12.1.7 Belgium
- 12.1.8 Netherland
- 12.1.9 Nordics
- 12.1.10 Rest of Europe
- 13. Asia Pacific Shale Gas Hydraulic Fracturing Market Analysis, Insights and Forecast, 2019-2031
- 13.1. Market Analysis, Insights and Forecast - By Country/Sub-region
- 13.1.1 China
- 13.1.2 Japan
- 13.1.3 India
- 13.1.4 South Korea
- 13.1.5 Southeast Asia
- 13.1.6 Australia
- 13.1.7 Indonesia
- 13.1.8 Phillipes
- 13.1.9 Singapore
- 13.1.10 Thailandc
- 13.1.11 Rest of Asia Pacific
- 14. South America Shale Gas Hydraulic Fracturing Market Analysis, Insights and Forecast, 2019-2031
- 14.1. Market Analysis, Insights and Forecast - By Country/Sub-region
- 14.1.1 Brazil
- 14.1.2 Argentina
- 14.1.3 Peru
- 14.1.4 Chile
- 14.1.5 Colombia
- 14.1.6 Ecuador
- 14.1.7 Venezuela
- 14.1.8 Rest of South America
- 15. North America Shale Gas Hydraulic Fracturing Market Analysis, Insights and Forecast, 2019-2031
- 15.1. Market Analysis, Insights and Forecast - By Country/Sub-region
- 15.1.1 United States
- 15.1.2 Canada
- 15.1.3 Mexico
- 16. MEA Shale Gas Hydraulic Fracturing Market Analysis, Insights and Forecast, 2019-2031
- 16.1. Market Analysis, Insights and Forecast - By Country/Sub-region
- 16.1.1 United Arab Emirates
- 16.1.2 Saudi Arabia
- 16.1.3 South Africa
- 16.1.4 Rest of Middle East and Africa
- 17. Competitive Analysis
- 17.1. Global Market Share Analysis 2024
- 17.2. Company Profiles
- 17.2.1 Marathon Oil
- 17.2.1.1. Overview
- 17.2.1.2. Products
- 17.2.1.3. SWOT Analysis
- 17.2.1.4. Recent Developments
- 17.2.1.5. Financials (Based on Availability)
- 17.2.2 CNPC
- 17.2.2.1. Overview
- 17.2.2.2. Products
- 17.2.2.3. SWOT Analysis
- 17.2.2.4. Recent Developments
- 17.2.2.5. Financials (Based on Availability)
- 17.2.3 Royal Dutch Shell PLC*List Not Exhaustive
- 17.2.3.1. Overview
- 17.2.3.2. Products
- 17.2.3.3. SWOT Analysis
- 17.2.3.4. Recent Developments
- 17.2.3.5. Financials (Based on Availability)
- 17.2.4 Exxon Mobil Corporation
- 17.2.4.1. Overview
- 17.2.4.2. Products
- 17.2.4.3. SWOT Analysis
- 17.2.4.4. Recent Developments
- 17.2.4.5. Financials (Based on Availability)
- 17.2.5 Baker Hughes Co
- 17.2.5.1. Overview
- 17.2.5.2. Products
- 17.2.5.3. SWOT Analysis
- 17.2.5.4. Recent Developments
- 17.2.5.5. Financials (Based on Availability)
- 17.2.6 ExxonMobil
- 17.2.6.1. Overview
- 17.2.6.2. Products
- 17.2.6.3. SWOT Analysis
- 17.2.6.4. Recent Developments
- 17.2.6.5. Financials (Based on Availability)
- 17.2.7 Chevron Corporation
- 17.2.7.1. Overview
- 17.2.7.2. Products
- 17.2.7.3. SWOT Analysis
- 17.2.7.4. Recent Developments
- 17.2.7.5. Financials (Based on Availability)
- 17.2.8 Sinopec Ltd
- 17.2.8.1. Overview
- 17.2.8.2. Products
- 17.2.8.3. SWOT Analysis
- 17.2.8.4. Recent Developments
- 17.2.8.5. Financials (Based on Availability)
- 17.2.9 BP PLC
- 17.2.9.1. Overview
- 17.2.9.2. Products
- 17.2.9.3. SWOT Analysis
- 17.2.9.4. Recent Developments
- 17.2.9.5. Financials (Based on Availability)
- 17.2.1 Marathon Oil
List of Figures
- Figure 1: Global Shale Gas Hydraulic Fracturing Market Revenue Breakdown (Million, %) by Region 2024 & 2032
- Figure 2: Global Shale Gas Hydraulic Fracturing Market Volume Breakdown (metric tonnes, %) by Region 2024 & 2032
- Figure 3: North America Shale Gas Hydraulic Fracturing Market Revenue (Million), by Country 2024 & 2032
- Figure 4: North America Shale Gas Hydraulic Fracturing Market Volume (metric tonnes), by Country 2024 & 2032
- Figure 5: North America Shale Gas Hydraulic Fracturing Market Revenue Share (%), by Country 2024 & 2032
- Figure 6: North America Shale Gas Hydraulic Fracturing Market Volume Share (%), by Country 2024 & 2032
- Figure 7: Europe Shale Gas Hydraulic Fracturing Market Revenue (Million), by Country 2024 & 2032
- Figure 8: Europe Shale Gas Hydraulic Fracturing Market Volume (metric tonnes), by Country 2024 & 2032
- Figure 9: Europe Shale Gas Hydraulic Fracturing Market Revenue Share (%), by Country 2024 & 2032
- Figure 10: Europe Shale Gas Hydraulic Fracturing Market Volume Share (%), by Country 2024 & 2032
- Figure 11: Asia Pacific Shale Gas Hydraulic Fracturing Market Revenue (Million), by Country 2024 & 2032
- Figure 12: Asia Pacific Shale Gas Hydraulic Fracturing Market Volume (metric tonnes), by Country 2024 & 2032
- Figure 13: Asia Pacific Shale Gas Hydraulic Fracturing Market Revenue Share (%), by Country 2024 & 2032
- Figure 14: Asia Pacific Shale Gas Hydraulic Fracturing Market Volume Share (%), by Country 2024 & 2032
- Figure 15: South America Shale Gas Hydraulic Fracturing Market Revenue (Million), by Country 2024 & 2032
- Figure 16: South America Shale Gas Hydraulic Fracturing Market Volume (metric tonnes), by Country 2024 & 2032
- Figure 17: South America Shale Gas Hydraulic Fracturing Market Revenue Share (%), by Country 2024 & 2032
- Figure 18: South America Shale Gas Hydraulic Fracturing Market Volume Share (%), by Country 2024 & 2032
- Figure 19: North America Shale Gas Hydraulic Fracturing Market Revenue (Million), by Country 2024 & 2032
- Figure 20: North America Shale Gas Hydraulic Fracturing Market Volume (metric tonnes), by Country 2024 & 2032
- Figure 21: North America Shale Gas Hydraulic Fracturing Market Revenue Share (%), by Country 2024 & 2032
- Figure 22: North America Shale Gas Hydraulic Fracturing Market Volume Share (%), by Country 2024 & 2032
- Figure 23: MEA Shale Gas Hydraulic Fracturing Market Revenue (Million), by Country 2024 & 2032
- Figure 24: MEA Shale Gas Hydraulic Fracturing Market Volume (metric tonnes), by Country 2024 & 2032
- Figure 25: MEA Shale Gas Hydraulic Fracturing Market Revenue Share (%), by Country 2024 & 2032
- Figure 26: MEA Shale Gas Hydraulic Fracturing Market Volume Share (%), by Country 2024 & 2032
- Figure 27: North America Shale Gas Hydraulic Fracturing Market Revenue (Million), by Well Type 2024 & 2032
- Figure 28: North America Shale Gas Hydraulic Fracturing Market Volume (metric tonnes), by Well Type 2024 & 2032
- Figure 29: North America Shale Gas Hydraulic Fracturing Market Revenue Share (%), by Well Type 2024 & 2032
- Figure 30: North America Shale Gas Hydraulic Fracturing Market Volume Share (%), by Well Type 2024 & 2032
- Figure 31: North America Shale Gas Hydraulic Fracturing Market Revenue (Million), by Country 2024 & 2032
- Figure 32: North America Shale Gas Hydraulic Fracturing Market Volume (metric tonnes), by Country 2024 & 2032
- Figure 33: North America Shale Gas Hydraulic Fracturing Market Revenue Share (%), by Country 2024 & 2032
- Figure 34: North America Shale Gas Hydraulic Fracturing Market Volume Share (%), by Country 2024 & 2032
- Figure 35: Asia Pacific Shale Gas Hydraulic Fracturing Market Revenue (Million), by Well Type 2024 & 2032
- Figure 36: Asia Pacific Shale Gas Hydraulic Fracturing Market Volume (metric tonnes), by Well Type 2024 & 2032
- Figure 37: Asia Pacific Shale Gas Hydraulic Fracturing Market Revenue Share (%), by Well Type 2024 & 2032
- Figure 38: Asia Pacific Shale Gas Hydraulic Fracturing Market Volume Share (%), by Well Type 2024 & 2032
- Figure 39: Asia Pacific Shale Gas Hydraulic Fracturing Market Revenue (Million), by Country 2024 & 2032
- Figure 40: Asia Pacific Shale Gas Hydraulic Fracturing Market Volume (metric tonnes), by Country 2024 & 2032
- Figure 41: Asia Pacific Shale Gas Hydraulic Fracturing Market Revenue Share (%), by Country 2024 & 2032
- Figure 42: Asia Pacific Shale Gas Hydraulic Fracturing Market Volume Share (%), by Country 2024 & 2032
- Figure 43: Europe Shale Gas Hydraulic Fracturing Market Revenue (Million), by Well Type 2024 & 2032
- Figure 44: Europe Shale Gas Hydraulic Fracturing Market Volume (metric tonnes), by Well Type 2024 & 2032
- Figure 45: Europe Shale Gas Hydraulic Fracturing Market Revenue Share (%), by Well Type 2024 & 2032
- Figure 46: Europe Shale Gas Hydraulic Fracturing Market Volume Share (%), by Well Type 2024 & 2032
- Figure 47: Europe Shale Gas Hydraulic Fracturing Market Revenue (Million), by Country 2024 & 2032
- Figure 48: Europe Shale Gas Hydraulic Fracturing Market Volume (metric tonnes), by Country 2024 & 2032
- Figure 49: Europe Shale Gas Hydraulic Fracturing Market Revenue Share (%), by Country 2024 & 2032
- Figure 50: Europe Shale Gas Hydraulic Fracturing Market Volume Share (%), by Country 2024 & 2032
- Figure 51: South America Shale Gas Hydraulic Fracturing Market Revenue (Million), by Well Type 2024 & 2032
- Figure 52: South America Shale Gas Hydraulic Fracturing Market Volume (metric tonnes), by Well Type 2024 & 2032
- Figure 53: South America Shale Gas Hydraulic Fracturing Market Revenue Share (%), by Well Type 2024 & 2032
- Figure 54: South America Shale Gas Hydraulic Fracturing Market Volume Share (%), by Well Type 2024 & 2032
- Figure 55: South America Shale Gas Hydraulic Fracturing Market Revenue (Million), by Country 2024 & 2032
- Figure 56: South America Shale Gas Hydraulic Fracturing Market Volume (metric tonnes), by Country 2024 & 2032
- Figure 57: South America Shale Gas Hydraulic Fracturing Market Revenue Share (%), by Country 2024 & 2032
- Figure 58: South America Shale Gas Hydraulic Fracturing Market Volume Share (%), by Country 2024 & 2032
- Figure 59: Middle East and Africa Shale Gas Hydraulic Fracturing Market Revenue (Million), by Well Type 2024 & 2032
- Figure 60: Middle East and Africa Shale Gas Hydraulic Fracturing Market Volume (metric tonnes), by Well Type 2024 & 2032
- Figure 61: Middle East and Africa Shale Gas Hydraulic Fracturing Market Revenue Share (%), by Well Type 2024 & 2032
- Figure 62: Middle East and Africa Shale Gas Hydraulic Fracturing Market Volume Share (%), by Well Type 2024 & 2032
- Figure 63: Middle East and Africa Shale Gas Hydraulic Fracturing Market Revenue (Million), by Country 2024 & 2032
- Figure 64: Middle East and Africa Shale Gas Hydraulic Fracturing Market Volume (metric tonnes), by Country 2024 & 2032
- Figure 65: Middle East and Africa Shale Gas Hydraulic Fracturing Market Revenue Share (%), by Country 2024 & 2032
- Figure 66: Middle East and Africa Shale Gas Hydraulic Fracturing Market Volume Share (%), by Country 2024 & 2032
List of Tables
- Table 1: Global Shale Gas Hydraulic Fracturing Market Revenue Million Forecast, by Region 2019 & 2032
- Table 2: Global Shale Gas Hydraulic Fracturing Market Volume metric tonnes Forecast, by Region 2019 & 2032
- Table 3: Global Shale Gas Hydraulic Fracturing Market Revenue Million Forecast, by Well Type 2019 & 2032
- Table 4: Global Shale Gas Hydraulic Fracturing Market Volume metric tonnes Forecast, by Well Type 2019 & 2032
- Table 5: Global Shale Gas Hydraulic Fracturing Market Revenue Million Forecast, by Region 2019 & 2032
- Table 6: Global Shale Gas Hydraulic Fracturing Market Volume metric tonnes Forecast, by Region 2019 & 2032
- Table 7: Global Shale Gas Hydraulic Fracturing Market Revenue Million Forecast, by Country 2019 & 2032
- Table 8: Global Shale Gas Hydraulic Fracturing Market Volume metric tonnes Forecast, by Country 2019 & 2032
- Table 9: United States Shale Gas Hydraulic Fracturing Market Revenue (Million) Forecast, by Application 2019 & 2032
- Table 10: United States Shale Gas Hydraulic Fracturing Market Volume (metric tonnes) Forecast, by Application 2019 & 2032
- Table 11: Canada Shale Gas Hydraulic Fracturing Market Revenue (Million) Forecast, by Application 2019 & 2032
- Table 12: Canada Shale Gas Hydraulic Fracturing Market Volume (metric tonnes) Forecast, by Application 2019 & 2032
- Table 13: Mexico Shale Gas Hydraulic Fracturing Market Revenue (Million) Forecast, by Application 2019 & 2032
- Table 14: Mexico Shale Gas Hydraulic Fracturing Market Volume (metric tonnes) Forecast, by Application 2019 & 2032
- Table 15: Global Shale Gas Hydraulic Fracturing Market Revenue Million Forecast, by Country 2019 & 2032
- Table 16: Global Shale Gas Hydraulic Fracturing Market Volume metric tonnes Forecast, by Country 2019 & 2032
- Table 17: Germany Shale Gas Hydraulic Fracturing Market Revenue (Million) Forecast, by Application 2019 & 2032
- Table 18: Germany Shale Gas Hydraulic Fracturing Market Volume (metric tonnes) Forecast, by Application 2019 & 2032
- Table 19: United Kingdom Shale Gas Hydraulic Fracturing Market Revenue (Million) Forecast, by Application 2019 & 2032
- Table 20: United Kingdom Shale Gas Hydraulic Fracturing Market Volume (metric tonnes) Forecast, by Application 2019 & 2032
- Table 21: France Shale Gas Hydraulic Fracturing Market Revenue (Million) Forecast, by Application 2019 & 2032
- Table 22: France Shale Gas Hydraulic Fracturing Market Volume (metric tonnes) Forecast, by Application 2019 & 2032
- Table 23: Spain Shale Gas Hydraulic Fracturing Market Revenue (Million) Forecast, by Application 2019 & 2032
- Table 24: Spain Shale Gas Hydraulic Fracturing Market Volume (metric tonnes) Forecast, by Application 2019 & 2032
- Table 25: Italy Shale Gas Hydraulic Fracturing Market Revenue (Million) Forecast, by Application 2019 & 2032
- Table 26: Italy Shale Gas Hydraulic Fracturing Market Volume (metric tonnes) Forecast, by Application 2019 & 2032
- Table 27: Spain Shale Gas Hydraulic Fracturing Market Revenue (Million) Forecast, by Application 2019 & 2032
- Table 28: Spain Shale Gas Hydraulic Fracturing Market Volume (metric tonnes) Forecast, by Application 2019 & 2032
- Table 29: Belgium Shale Gas Hydraulic Fracturing Market Revenue (Million) Forecast, by Application 2019 & 2032
- Table 30: Belgium Shale Gas Hydraulic Fracturing Market Volume (metric tonnes) Forecast, by Application 2019 & 2032
- Table 31: Netherland Shale Gas Hydraulic Fracturing Market Revenue (Million) Forecast, by Application 2019 & 2032
- Table 32: Netherland Shale Gas Hydraulic Fracturing Market Volume (metric tonnes) Forecast, by Application 2019 & 2032
- Table 33: Nordics Shale Gas Hydraulic Fracturing Market Revenue (Million) Forecast, by Application 2019 & 2032
- Table 34: Nordics Shale Gas Hydraulic Fracturing Market Volume (metric tonnes) Forecast, by Application 2019 & 2032
- Table 35: Rest of Europe Shale Gas Hydraulic Fracturing Market Revenue (Million) Forecast, by Application 2019 & 2032
- Table 36: Rest of Europe Shale Gas Hydraulic Fracturing Market Volume (metric tonnes) Forecast, by Application 2019 & 2032
- Table 37: Global Shale Gas Hydraulic Fracturing Market Revenue Million Forecast, by Country 2019 & 2032
- Table 38: Global Shale Gas Hydraulic Fracturing Market Volume metric tonnes Forecast, by Country 2019 & 2032
- Table 39: China Shale Gas Hydraulic Fracturing Market Revenue (Million) Forecast, by Application 2019 & 2032
- Table 40: China Shale Gas Hydraulic Fracturing Market Volume (metric tonnes) Forecast, by Application 2019 & 2032
- Table 41: Japan Shale Gas Hydraulic Fracturing Market Revenue (Million) Forecast, by Application 2019 & 2032
- Table 42: Japan Shale Gas Hydraulic Fracturing Market Volume (metric tonnes) Forecast, by Application 2019 & 2032
- Table 43: India Shale Gas Hydraulic Fracturing Market Revenue (Million) Forecast, by Application 2019 & 2032
- Table 44: India Shale Gas Hydraulic Fracturing Market Volume (metric tonnes) Forecast, by Application 2019 & 2032
- Table 45: South Korea Shale Gas Hydraulic Fracturing Market Revenue (Million) Forecast, by Application 2019 & 2032
- Table 46: South Korea Shale Gas Hydraulic Fracturing Market Volume (metric tonnes) Forecast, by Application 2019 & 2032
- Table 47: Southeast Asia Shale Gas Hydraulic Fracturing Market Revenue (Million) Forecast, by Application 2019 & 2032
- Table 48: Southeast Asia Shale Gas Hydraulic Fracturing Market Volume (metric tonnes) Forecast, by Application 2019 & 2032
- Table 49: Australia Shale Gas Hydraulic Fracturing Market Revenue (Million) Forecast, by Application 2019 & 2032
- Table 50: Australia Shale Gas Hydraulic Fracturing Market Volume (metric tonnes) Forecast, by Application 2019 & 2032
- Table 51: Indonesia Shale Gas Hydraulic Fracturing Market Revenue (Million) Forecast, by Application 2019 & 2032
- Table 52: Indonesia Shale Gas Hydraulic Fracturing Market Volume (metric tonnes) Forecast, by Application 2019 & 2032
- Table 53: Phillipes Shale Gas Hydraulic Fracturing Market Revenue (Million) Forecast, by Application 2019 & 2032
- Table 54: Phillipes Shale Gas Hydraulic Fracturing Market Volume (metric tonnes) Forecast, by Application 2019 & 2032
- Table 55: Singapore Shale Gas Hydraulic Fracturing Market Revenue (Million) Forecast, by Application 2019 & 2032
- Table 56: Singapore Shale Gas Hydraulic Fracturing Market Volume (metric tonnes) Forecast, by Application 2019 & 2032
- Table 57: Thailandc Shale Gas Hydraulic Fracturing Market Revenue (Million) Forecast, by Application 2019 & 2032
- Table 58: Thailandc Shale Gas Hydraulic Fracturing Market Volume (metric tonnes) Forecast, by Application 2019 & 2032
- Table 59: Rest of Asia Pacific Shale Gas Hydraulic Fracturing Market Revenue (Million) Forecast, by Application 2019 & 2032
- Table 60: Rest of Asia Pacific Shale Gas Hydraulic Fracturing Market Volume (metric tonnes) Forecast, by Application 2019 & 2032
- Table 61: Global Shale Gas Hydraulic Fracturing Market Revenue Million Forecast, by Country 2019 & 2032
- Table 62: Global Shale Gas Hydraulic Fracturing Market Volume metric tonnes Forecast, by Country 2019 & 2032
- Table 63: Brazil Shale Gas Hydraulic Fracturing Market Revenue (Million) Forecast, by Application 2019 & 2032
- Table 64: Brazil Shale Gas Hydraulic Fracturing Market Volume (metric tonnes) Forecast, by Application 2019 & 2032
- Table 65: Argentina Shale Gas Hydraulic Fracturing Market Revenue (Million) Forecast, by Application 2019 & 2032
- Table 66: Argentina Shale Gas Hydraulic Fracturing Market Volume (metric tonnes) Forecast, by Application 2019 & 2032
- Table 67: Peru Shale Gas Hydraulic Fracturing Market Revenue (Million) Forecast, by Application 2019 & 2032
- Table 68: Peru Shale Gas Hydraulic Fracturing Market Volume (metric tonnes) Forecast, by Application 2019 & 2032
- Table 69: Chile Shale Gas Hydraulic Fracturing Market Revenue (Million) Forecast, by Application 2019 & 2032
- Table 70: Chile Shale Gas Hydraulic Fracturing Market Volume (metric tonnes) Forecast, by Application 2019 & 2032
- Table 71: Colombia Shale Gas Hydraulic Fracturing Market Revenue (Million) Forecast, by Application 2019 & 2032
- Table 72: Colombia Shale Gas Hydraulic Fracturing Market Volume (metric tonnes) Forecast, by Application 2019 & 2032
- Table 73: Ecuador Shale Gas Hydraulic Fracturing Market Revenue (Million) Forecast, by Application 2019 & 2032
- Table 74: Ecuador Shale Gas Hydraulic Fracturing Market Volume (metric tonnes) Forecast, by Application 2019 & 2032
- Table 75: Venezuela Shale Gas Hydraulic Fracturing Market Revenue (Million) Forecast, by Application 2019 & 2032
- Table 76: Venezuela Shale Gas Hydraulic Fracturing Market Volume (metric tonnes) Forecast, by Application 2019 & 2032
- Table 77: Rest of South America Shale Gas Hydraulic Fracturing Market Revenue (Million) Forecast, by Application 2019 & 2032
- Table 78: Rest of South America Shale Gas Hydraulic Fracturing Market Volume (metric tonnes) Forecast, by Application 2019 & 2032
- Table 79: Global Shale Gas Hydraulic Fracturing Market Revenue Million Forecast, by Country 2019 & 2032
- Table 80: Global Shale Gas Hydraulic Fracturing Market Volume metric tonnes Forecast, by Country 2019 & 2032
- Table 81: United States Shale Gas Hydraulic Fracturing Market Revenue (Million) Forecast, by Application 2019 & 2032
- Table 82: United States Shale Gas Hydraulic Fracturing Market Volume (metric tonnes) Forecast, by Application 2019 & 2032
- Table 83: Canada Shale Gas Hydraulic Fracturing Market Revenue (Million) Forecast, by Application 2019 & 2032
- Table 84: Canada Shale Gas Hydraulic Fracturing Market Volume (metric tonnes) Forecast, by Application 2019 & 2032
- Table 85: Mexico Shale Gas Hydraulic Fracturing Market Revenue (Million) Forecast, by Application 2019 & 2032
- Table 86: Mexico Shale Gas Hydraulic Fracturing Market Volume (metric tonnes) Forecast, by Application 2019 & 2032
- Table 87: Global Shale Gas Hydraulic Fracturing Market Revenue Million Forecast, by Country 2019 & 2032
- Table 88: Global Shale Gas Hydraulic Fracturing Market Volume metric tonnes Forecast, by Country 2019 & 2032
- Table 89: United Arab Emirates Shale Gas Hydraulic Fracturing Market Revenue (Million) Forecast, by Application 2019 & 2032
- Table 90: United Arab Emirates Shale Gas Hydraulic Fracturing Market Volume (metric tonnes) Forecast, by Application 2019 & 2032
- Table 91: Saudi Arabia Shale Gas Hydraulic Fracturing Market Revenue (Million) Forecast, by Application 2019 & 2032
- Table 92: Saudi Arabia Shale Gas Hydraulic Fracturing Market Volume (metric tonnes) Forecast, by Application 2019 & 2032
- Table 93: South Africa Shale Gas Hydraulic Fracturing Market Revenue (Million) Forecast, by Application 2019 & 2032
- Table 94: South Africa Shale Gas Hydraulic Fracturing Market Volume (metric tonnes) Forecast, by Application 2019 & 2032
- Table 95: Rest of Middle East and Africa Shale Gas Hydraulic Fracturing Market Revenue (Million) Forecast, by Application 2019 & 2032
- Table 96: Rest of Middle East and Africa Shale Gas Hydraulic Fracturing Market Volume (metric tonnes) Forecast, by Application 2019 & 2032
- Table 97: Global Shale Gas Hydraulic Fracturing Market Revenue Million Forecast, by Well Type 2019 & 2032
- Table 98: Global Shale Gas Hydraulic Fracturing Market Volume metric tonnes Forecast, by Well Type 2019 & 2032
- Table 99: Global Shale Gas Hydraulic Fracturing Market Revenue Million Forecast, by Country 2019 & 2032
- Table 100: Global Shale Gas Hydraulic Fracturing Market Volume metric tonnes Forecast, by Country 2019 & 2032
- Table 101: Global Shale Gas Hydraulic Fracturing Market Revenue Million Forecast, by Well Type 2019 & 2032
- Table 102: Global Shale Gas Hydraulic Fracturing Market Volume metric tonnes Forecast, by Well Type 2019 & 2032
- Table 103: Global Shale Gas Hydraulic Fracturing Market Revenue Million Forecast, by Country 2019 & 2032
- Table 104: Global Shale Gas Hydraulic Fracturing Market Volume metric tonnes Forecast, by Country 2019 & 2032
- Table 105: Global Shale Gas Hydraulic Fracturing Market Revenue Million Forecast, by Well Type 2019 & 2032
- Table 106: Global Shale Gas Hydraulic Fracturing Market Volume metric tonnes Forecast, by Well Type 2019 & 2032
- Table 107: Global Shale Gas Hydraulic Fracturing Market Revenue Million Forecast, by Country 2019 & 2032
- Table 108: Global Shale Gas Hydraulic Fracturing Market Volume metric tonnes Forecast, by Country 2019 & 2032
- Table 109: Global Shale Gas Hydraulic Fracturing Market Revenue Million Forecast, by Well Type 2019 & 2032
- Table 110: Global Shale Gas Hydraulic Fracturing Market Volume metric tonnes Forecast, by Well Type 2019 & 2032
- Table 111: Global Shale Gas Hydraulic Fracturing Market Revenue Million Forecast, by Country 2019 & 2032
- Table 112: Global Shale Gas Hydraulic Fracturing Market Volume metric tonnes Forecast, by Country 2019 & 2032
- Table 113: Global Shale Gas Hydraulic Fracturing Market Revenue Million Forecast, by Well Type 2019 & 2032
- Table 114: Global Shale Gas Hydraulic Fracturing Market Volume metric tonnes Forecast, by Well Type 2019 & 2032
- Table 115: Global Shale Gas Hydraulic Fracturing Market Revenue Million Forecast, by Country 2019 & 2032
- Table 116: Global Shale Gas Hydraulic Fracturing Market Volume metric tonnes Forecast, by Country 2019 & 2032
Frequently Asked Questions
1. What is the projected Compound Annual Growth Rate (CAGR) of the Shale Gas Hydraulic Fracturing Market?
The projected CAGR is approximately > 2.00%.
2. Which companies are prominent players in the Shale Gas Hydraulic Fracturing Market?
Key companies in the market include Marathon Oil, CNPC, Royal Dutch Shell PLC*List Not Exhaustive, Exxon Mobil Corporation, Baker Hughes Co, ExxonMobil, Chevron Corporation, Sinopec Ltd, BP PLC.
3. What are the main segments of the Shale Gas Hydraulic Fracturing Market?
The market segments include Well Type.
4. Can you provide details about the market size?
The market size is estimated to be USD XX Million as of 2022.
5. What are some drivers contributing to market growth?
Increasing Demand from Industrial Applications4.; Growing Infrastructure Across the World.
6. What are the notable trends driving market growth?
Horizontal and Directional Well Type to Witness a Significant Growth.
7. Are there any restraints impacting market growth?
A Rise in Concerns Related to Carbon Emissions and a Shift Towards Electric Vehicles and Renewable Sources of Energy.
8. Can you provide examples of recent developments in the market?
N/A
9. What pricing options are available for accessing the report?
Pricing options include single-user, multi-user, and enterprise licenses priced at USD 4750, USD 5250, and USD 8750 respectively.
10. Is the market size provided in terms of value or volume?
The market size is provided in terms of value, measured in Million and volume, measured in metric tonnes.
11. Are there any specific market keywords associated with the report?
Yes, the market keyword associated with the report is "Shale Gas Hydraulic Fracturing Market," which aids in identifying and referencing the specific market segment covered.
12. How do I determine which pricing option suits my needs best?
The pricing options vary based on user requirements and access needs. Individual users may opt for single-user licenses, while businesses requiring broader access may choose multi-user or enterprise licenses for cost-effective access to the report.
13. Are there any additional resources or data provided in the Shale Gas Hydraulic Fracturing Market report?
While the report offers comprehensive insights, it's advisable to review the specific contents or supplementary materials provided to ascertain if additional resources or data are available.
14. How can I stay updated on further developments or reports in the Shale Gas Hydraulic Fracturing Market?
To stay informed about further developments, trends, and reports in the Shale Gas Hydraulic Fracturing Market, consider subscribing to industry newsletters, following relevant companies and organizations, or regularly checking reputable industry news sources and publications.
Methodology
Step 1 - Identification of Relevant Samples Size from Population Database


Step 2 - Approaches for Defining Global Market Size (Value, Volume* & Price*)

Note*: In applicable scenarios
Step 3 - Data Sources
Primary Research
- Web Analytics
- Survey Reports
- Research Institute
- Latest Research Reports
- Opinion Leaders
Secondary Research
- Annual Reports
- White Paper
- Latest Press Release
- Industry Association
- Paid Database
- Investor Presentations

Step 4 - Data Triangulation
Involves using different sources of information in order to increase the validity of a study
These sources are likely to be stakeholders in a program - participants, other researchers, program staff, other community members, and so on.
Then we put all data in single framework & apply various statistical tools to find out the dynamic on the market.
During the analysis stage, feedback from the stakeholder groups would be compared to determine areas of agreement as well as areas of divergence


