
Key Insights
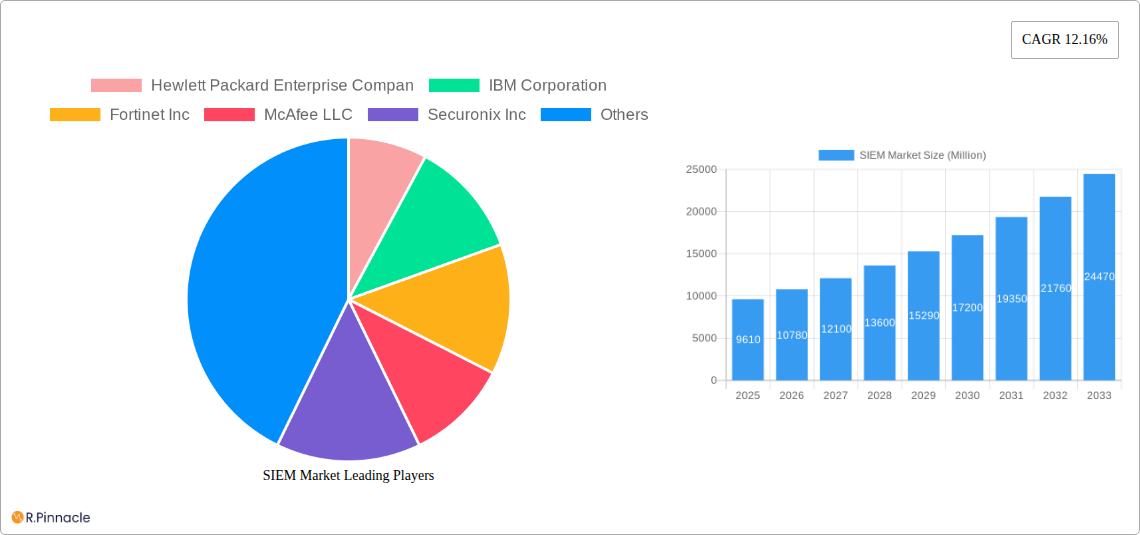
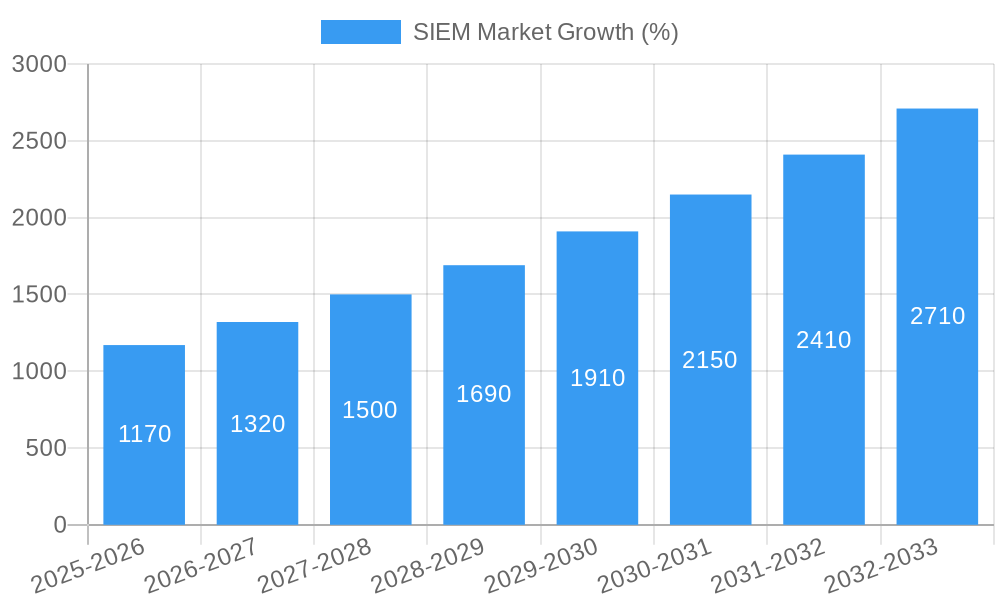
The global Security Information and Event Management (SIEM) market is experiencing robust growth, projected to reach a substantial size with a Compound Annual Growth Rate (CAGR) of 12.16% from 2025 to 2033. This expansion is fueled by several key factors. The increasing frequency and sophistication of cyberattacks across various sectors, including BFSI, retail, and healthcare, necessitate robust security solutions. Furthermore, the rise of cloud computing and the growing adoption of hybrid cloud models are driving demand for cloud-based SIEM solutions that offer enhanced scalability and flexibility. Stringent government regulations mandating data protection and compliance further contribute to market growth. The market is segmented by deployment (on-premise and cloud), organization type (SMEs and large enterprises), and end-user industry, reflecting the diverse application of SIEM across various business needs. Competition is fierce amongst established players like Hewlett Packard Enterprise, IBM, and Fortinet, along with emerging innovative companies like Securonix and Exabeam. This competitive landscape fosters continuous innovation and improvement in SIEM technology, driving market expansion.
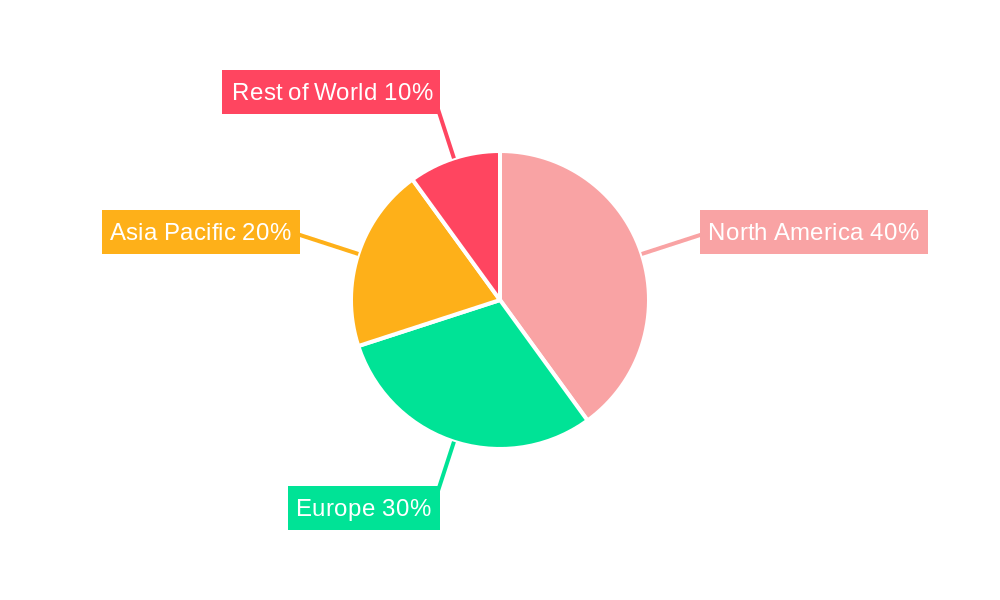
The regional distribution of the SIEM market is geographically diverse, with North America currently holding a significant market share, driven by high technological advancements and early adoption. However, the Asia-Pacific region is expected to witness rapid growth due to increasing digitalization and government initiatives promoting cybersecurity. Europe and other regions also contribute significantly to the overall market, reflecting a global need for enhanced security measures. The market’s future trajectory will depend on evolving cybersecurity threats, advancements in artificial intelligence (AI) and machine learning (ML) integration within SIEM solutions, and the continuous evolution of cloud security models. The successful adoption of SIEM solutions is contingent upon factors such as ease of implementation, cost-effectiveness, and the ability to integrate seamlessly with existing IT infrastructure.
This in-depth report provides a comprehensive analysis of the SIEM (Security Information and Event Management) market, offering actionable insights for industry professionals and strategic decision-makers. Covering the period from 2019 to 2033, with a focus on 2025, this report meticulously examines market dynamics, competitive landscapes, and future growth trajectories. The report leverages extensive data analysis and industry expertise to deliver a clear and concise understanding of this rapidly evolving market. The global SIEM market is projected to reach xx Million by 2033.
SIEM Market Structure & Innovation Trends
The SIEM market is characterized by a moderately concentrated landscape, with several major players holding significant market share. However, the market also witnesses considerable competition from emerging vendors offering niche solutions and innovative technologies. Market share in 2025 is estimated as follows (exact figures pending final data analysis): Splunk Inc. (xx%), IBM Corporation (xx%), Hewlett Packard Enterprise Company (xx%), and other players (xx%).
- Innovation Drivers: The increasing sophistication of cyber threats, the rising adoption of cloud computing, and the growing need for robust security solutions are key drivers of innovation in the SIEM market. This is leading to the development of AI-powered SIEM solutions, cloud-based deployments, and enhanced threat detection capabilities.
- Regulatory Frameworks: Stringent data privacy regulations (e.g., GDPR, CCPA) and cybersecurity compliance mandates are driving demand for SIEM solutions that can help organizations meet regulatory requirements.
- Product Substitutes: While SIEM solutions are increasingly becoming essential, organizations might explore alternatives like Security Orchestration, Automation, and Response (SOAR) tools that integrate with SIEM systems. However, the core functionality of SIEM remains irreplaceable.
- End-User Demographics: The market is comprised of Small and Medium Enterprises (SMEs) and Large Enterprises across various industries, with large enterprises currently dominating the market share due to their higher budgets and complex security needs.
- M&A Activities: The SIEM market has witnessed several mergers and acquisitions in recent years, with deal values ranging from xx Million to xx Million. These activities reflect the strategic importance of SIEM in the broader cybersecurity landscape.
SIEM Market Dynamics & Trends
The SIEM market is experiencing robust growth, driven by factors such as the rising prevalence of cyberattacks, expanding cloud adoption, and increasing regulatory pressures. The Compound Annual Growth Rate (CAGR) during the forecast period (2025-2033) is estimated to be xx%. Market penetration is gradually increasing across various industries, with higher adoption rates observed in sectors like BFSI and Government. Technological disruptions, such as the increasing adoption of AI and machine learning in SIEM solutions, are transforming the market landscape, enabling more sophisticated threat detection and response capabilities. Consumer preferences are shifting towards cloud-based SIEM deployments due to their scalability, cost-effectiveness, and ease of management. Competitive dynamics are intense, with existing players constantly innovating and new entrants disrupting the market with unique offerings.
Dominant Regions & Segments in SIEM Market
The North American region is currently the leading market for SIEM solutions, driven by factors such as high technological adoption, stringent regulatory compliance, and a strong presence of major cybersecurity vendors. However, the Asia-Pacific region is expected to witness significant growth in the coming years due to increasing digitalization and rising cybersecurity awareness.
- By Deployment: The cloud segment is experiencing faster growth compared to on-premise deployments, driven by the benefits of scalability, cost-effectiveness, and ease of management.
- By Organization Type: Large enterprises are the major consumers of SIEM solutions, due to their higher budgets and complex security infrastructures. However, SMEs are also increasingly adopting SIEM, albeit at a slower rate.
- By End-user Industry: The BFSI (Banking, Financial Services, and Insurance) sector is a significant driver of the market, followed by the Government and Healthcare sectors, owing to the criticality of data security in these industries.
Key Drivers (across segments):
- Strong economic growth: Facilitates investment in security infrastructure.
- Robust IT infrastructure: Supports the deployment and management of SIEM solutions.
- Government initiatives & regulations: Promote cybersecurity awareness and mandate the adoption of security measures.
SIEM Market Product Innovations
Recent innovations in the SIEM market include the integration of AI and machine learning for enhanced threat detection, the development of cloud-based SIEM solutions for improved scalability and cost-effectiveness, and the incorporation of SOAR capabilities for automated response to security incidents. These innovations are driven by the need for more efficient and effective security solutions that can keep pace with the evolving threat landscape and meet the evolving needs of organizations. The market fit for these innovations is very strong, as they directly address the key challenges faced by organizations in managing their cybersecurity risks.
Report Scope & Segmentation Analysis
This report segments the SIEM market based on deployment (on-premise, cloud), organization type (SMEs, large enterprises), and end-user industry (retail, BFSI, manufacturing, government, healthcare, others). Each segment's growth projection, market size, and competitive dynamics are analyzed in detail. The report also considers the impact of various macroeconomic factors and technological advancements on the overall market growth.
By Deployment: The cloud segment is projected to have a higher CAGR than the on-premise segment.
By Organization Type: Large enterprises are expected to dominate the market, owing to their greater investment capacity.
By End-user Industry: The BFSI, Government, and Healthcare sectors are expected to remain prominent drivers of market growth.
Key Drivers of SIEM Market Growth
The SIEM market is propelled by several key factors: the escalating frequency and sophistication of cyberattacks, the rising adoption of cloud technologies and associated security concerns, increasing regulatory compliance requirements, and a growing need for improved threat detection and response capabilities. The rising adoption of AI and machine learning in SIEM is adding to this growth, allowing for automated threat identification and improved response times.
Challenges in the SIEM Market Sector
The SIEM market faces challenges such as the high initial investment costs of implementing SIEM systems, the complexity of managing and maintaining these systems, the shortage of skilled cybersecurity professionals, and the constant need to adapt to evolving threat landscapes. These factors can lead to difficulties in effective implementation and ongoing management. Additionally, the integration of SIEM with other security tools can be challenging.
Emerging Opportunities in SIEM Market
Emerging opportunities include the growing demand for cloud-based SIEM solutions, the increasing adoption of AI and machine learning for advanced threat detection, the integration of SIEM with SOAR platforms for automated incident response, and the expansion into new markets such as IoT security. The growing adoption of cloud services and the expansion of the IoT ecosystem will open up new revenue opportunities for SIEM providers.
Leading Players in the SIEM Market Market
- Hewlett Packard Enterprise Company
- IBM Corporation
- Fortinet Inc
- McAfee LLC
- Securonix Inc
- Rapid7 Inc
- LogRhythm Inc
- RSA Security LLC (Dell Technologies)
- Open Text Corporation
- Exabeam Inc
- AlienVault Inc
- Splunk Inc
Key Developments in SIEM Market Industry
- November 2023: IBM launched a major update to its QRadar SIEM product, leveraging a cloud-native architecture and integrating Watsonx AI capabilities for enhanced threat detection and response. This significantly enhances the product's capabilities and competitiveness.
- April 2023: ManageEngine introduced the MSSP Edition of its Log360 Cloud SIEM solution, targeting Managed Security Service Providers (MSSPs). This expansion into the MSSP market opens up new revenue streams for ManageEngine.
Future Outlook for SIEM Market Market
The future of the SIEM market is bright, driven by continuous technological advancements, evolving cyber threats, and the increasing adoption of cloud computing. The market is poised for significant growth, with opportunities for innovation and expansion into new markets. Strategic partnerships and acquisitions are likely to play a crucial role in shaping the competitive landscape. The focus on AI-powered SIEM, cloud-based deployments, and enhanced threat detection capabilities will be pivotal in achieving market dominance in the coming years.
SIEM Market Segmentation
-
1. Deployment
- 1.1. On-premise
- 1.2. Cloud
-
2. Organisation Type
- 2.1. Small and Medium Enterprises (SMEs)
- 2.2. Large Enterprises
-
3. End-user Industry
- 3.1. Retail
- 3.2. BFSI
- 3.3. Manufacturing
- 3.4. Government
- 3.5. Healthcare
- 3.6. Other End-user Industries
SIEM Market Segmentation By Geography
-
1. North America
- 1.1. United States
- 1.2. Canada
-
2. Europe
- 2.1. Germany
- 2.2. United Kingdom
- 2.3. France
-
3. Asia
- 3.1. China
- 3.2. Japan
- 3.3. India
- 3.4. Australia and New Zealand
-
4. Latin America
- 4.1. Brazil
- 4.2. Argentina
-
5. Middle East and Africa
- 5.1. United Arab Emirates
SIEM Market REPORT HIGHLIGHTS
| Aspects | Details |
|---|---|
| Study Period | 2019-2033 |
| Base Year | 2024 |
| Estimated Year | 2025 |
| Forecast Period | 2025-2033 |
| Historical Period | 2019-2024 |
| Growth Rate | CAGR of 12.16% from 2019-2033 |
| Segmentation |
|
Table of Contents
- 1. Introduction
- 1.1. Research Scope
- 1.2. Market Segmentation
- 1.3. Research Methodology
- 1.4. Definitions and Assumptions
- 2. Executive Summary
- 2.1. Introduction
- 3. Market Dynamics
- 3.1. Introduction
- 3.2. Market Drivers
- 3.2.1. Growth in Security Concerns; Increasing Adoption of BYOD
- 3.3. Market Restrains
- 3.3.1. Lack of Skilled Labor
- 3.4. Market Trends
- 3.4.1. Cloud to Witness Significant Growth
- 4. Market Factor Analysis
- 4.1. Porters Five Forces
- 4.2. Supply/Value Chain
- 4.3. PESTEL analysis
- 4.4. Market Entropy
- 4.5. Patent/Trademark Analysis
- 5. Global SIEM Market Analysis, Insights and Forecast, 2019-2031
- 5.1. Market Analysis, Insights and Forecast - by Deployment
- 5.1.1. On-premise
- 5.1.2. Cloud
- 5.2. Market Analysis, Insights and Forecast - by Organisation Type
- 5.2.1. Small and Medium Enterprises (SMEs)
- 5.2.2. Large Enterprises
- 5.3. Market Analysis, Insights and Forecast - by End-user Industry
- 5.3.1. Retail
- 5.3.2. BFSI
- 5.3.3. Manufacturing
- 5.3.4. Government
- 5.3.5. Healthcare
- 5.3.6. Other End-user Industries
- 5.4. Market Analysis, Insights and Forecast - by Region
- 5.4.1. North America
- 5.4.2. Europe
- 5.4.3. Asia
- 5.4.4. Latin America
- 5.4.5. Middle East and Africa
- 5.1. Market Analysis, Insights and Forecast - by Deployment
- 6. North America SIEM Market Analysis, Insights and Forecast, 2019-2031
- 6.1. Market Analysis, Insights and Forecast - by Deployment
- 6.1.1. On-premise
- 6.1.2. Cloud
- 6.2. Market Analysis, Insights and Forecast - by Organisation Type
- 6.2.1. Small and Medium Enterprises (SMEs)
- 6.2.2. Large Enterprises
- 6.3. Market Analysis, Insights and Forecast - by End-user Industry
- 6.3.1. Retail
- 6.3.2. BFSI
- 6.3.3. Manufacturing
- 6.3.4. Government
- 6.3.5. Healthcare
- 6.3.6. Other End-user Industries
- 6.1. Market Analysis, Insights and Forecast - by Deployment
- 7. Europe SIEM Market Analysis, Insights and Forecast, 2019-2031
- 7.1. Market Analysis, Insights and Forecast - by Deployment
- 7.1.1. On-premise
- 7.1.2. Cloud
- 7.2. Market Analysis, Insights and Forecast - by Organisation Type
- 7.2.1. Small and Medium Enterprises (SMEs)
- 7.2.2. Large Enterprises
- 7.3. Market Analysis, Insights and Forecast - by End-user Industry
- 7.3.1. Retail
- 7.3.2. BFSI
- 7.3.3. Manufacturing
- 7.3.4. Government
- 7.3.5. Healthcare
- 7.3.6. Other End-user Industries
- 7.1. Market Analysis, Insights and Forecast - by Deployment
- 8. Asia SIEM Market Analysis, Insights and Forecast, 2019-2031
- 8.1. Market Analysis, Insights and Forecast - by Deployment
- 8.1.1. On-premise
- 8.1.2. Cloud
- 8.2. Market Analysis, Insights and Forecast - by Organisation Type
- 8.2.1. Small and Medium Enterprises (SMEs)
- 8.2.2. Large Enterprises
- 8.3. Market Analysis, Insights and Forecast - by End-user Industry
- 8.3.1. Retail
- 8.3.2. BFSI
- 8.3.3. Manufacturing
- 8.3.4. Government
- 8.3.5. Healthcare
- 8.3.6. Other End-user Industries
- 8.1. Market Analysis, Insights and Forecast - by Deployment
- 9. Latin America SIEM Market Analysis, Insights and Forecast, 2019-2031
- 9.1. Market Analysis, Insights and Forecast - by Deployment
- 9.1.1. On-premise
- 9.1.2. Cloud
- 9.2. Market Analysis, Insights and Forecast - by Organisation Type
- 9.2.1. Small and Medium Enterprises (SMEs)
- 9.2.2. Large Enterprises
- 9.3. Market Analysis, Insights and Forecast - by End-user Industry
- 9.3.1. Retail
- 9.3.2. BFSI
- 9.3.3. Manufacturing
- 9.3.4. Government
- 9.3.5. Healthcare
- 9.3.6. Other End-user Industries
- 9.1. Market Analysis, Insights and Forecast - by Deployment
- 10. Middle East and Africa SIEM Market Analysis, Insights and Forecast, 2019-2031
- 10.1. Market Analysis, Insights and Forecast - by Deployment
- 10.1.1. On-premise
- 10.1.2. Cloud
- 10.2. Market Analysis, Insights and Forecast - by Organisation Type
- 10.2.1. Small and Medium Enterprises (SMEs)
- 10.2.2. Large Enterprises
- 10.3. Market Analysis, Insights and Forecast - by End-user Industry
- 10.3.1. Retail
- 10.3.2. BFSI
- 10.3.3. Manufacturing
- 10.3.4. Government
- 10.3.5. Healthcare
- 10.3.6. Other End-user Industries
- 10.1. Market Analysis, Insights and Forecast - by Deployment
- 11. North America SIEM Market Analysis, Insights and Forecast, 2019-2031
- 11.1. Market Analysis, Insights and Forecast - By Country/Sub-region
- 11.1.1 United States
- 11.1.2 Canada
- 11.1.3 Mexico
- 12. Europe SIEM Market Analysis, Insights and Forecast, 2019-2031
- 12.1. Market Analysis, Insights and Forecast - By Country/Sub-region
- 12.1.1 Germany
- 12.1.2 United Kingdom
- 12.1.3 France
- 12.1.4 Spain
- 12.1.5 Italy
- 12.1.6 Spain
- 12.1.7 Belgium
- 12.1.8 Netherland
- 12.1.9 Nordics
- 12.1.10 Rest of Europe
- 13. Asia Pacific SIEM Market Analysis, Insights and Forecast, 2019-2031
- 13.1. Market Analysis, Insights and Forecast - By Country/Sub-region
- 13.1.1 China
- 13.1.2 Japan
- 13.1.3 India
- 13.1.4 South Korea
- 13.1.5 Southeast Asia
- 13.1.6 Australia
- 13.1.7 Indonesia
- 13.1.8 Phillipes
- 13.1.9 Singapore
- 13.1.10 Thailandc
- 13.1.11 Rest of Asia Pacific
- 14. South America SIEM Market Analysis, Insights and Forecast, 2019-2031
- 14.1. Market Analysis, Insights and Forecast - By Country/Sub-region
- 14.1.1 Brazil
- 14.1.2 Argentina
- 14.1.3 Peru
- 14.1.4 Chile
- 14.1.5 Colombia
- 14.1.6 Ecuador
- 14.1.7 Venezuela
- 14.1.8 Rest of South America
- 15. North America SIEM Market Analysis, Insights and Forecast, 2019-2031
- 15.1. Market Analysis, Insights and Forecast - By Country/Sub-region
- 15.1.1 United States
- 15.1.2 Canada
- 15.1.3 Mexico
- 16. MEA SIEM Market Analysis, Insights and Forecast, 2019-2031
- 16.1. Market Analysis, Insights and Forecast - By Country/Sub-region
- 16.1.1 United Arab Emirates
- 16.1.2 Saudi Arabia
- 16.1.3 South Africa
- 16.1.4 Rest of Middle East and Africa
- 17. Competitive Analysis
- 17.1. Global Market Share Analysis 2024
- 17.2. Company Profiles
- 17.2.1 Hewlett Packard Enterprise Compan
- 17.2.1.1. Overview
- 17.2.1.2. Products
- 17.2.1.3. SWOT Analysis
- 17.2.1.4. Recent Developments
- 17.2.1.5. Financials (Based on Availability)
- 17.2.2 IBM Corporation
- 17.2.2.1. Overview
- 17.2.2.2. Products
- 17.2.2.3. SWOT Analysis
- 17.2.2.4. Recent Developments
- 17.2.2.5. Financials (Based on Availability)
- 17.2.3 Fortinet Inc
- 17.2.3.1. Overview
- 17.2.3.2. Products
- 17.2.3.3. SWOT Analysis
- 17.2.3.4. Recent Developments
- 17.2.3.5. Financials (Based on Availability)
- 17.2.4 McAfee LLC
- 17.2.4.1. Overview
- 17.2.4.2. Products
- 17.2.4.3. SWOT Analysis
- 17.2.4.4. Recent Developments
- 17.2.4.5. Financials (Based on Availability)
- 17.2.5 Securonix Inc
- 17.2.5.1. Overview
- 17.2.5.2. Products
- 17.2.5.3. SWOT Analysis
- 17.2.5.4. Recent Developments
- 17.2.5.5. Financials (Based on Availability)
- 17.2.6 Rapid7 Inc
- 17.2.6.1. Overview
- 17.2.6.2. Products
- 17.2.6.3. SWOT Analysis
- 17.2.6.4. Recent Developments
- 17.2.6.5. Financials (Based on Availability)
- 17.2.7 LogRhythm Inc
- 17.2.7.1. Overview
- 17.2.7.2. Products
- 17.2.7.3. SWOT Analysis
- 17.2.7.4. Recent Developments
- 17.2.7.5. Financials (Based on Availability)
- 17.2.8 RSA Security LLC (Dell Technologies)
- 17.2.8.1. Overview
- 17.2.8.2. Products
- 17.2.8.3. SWOT Analysis
- 17.2.8.4. Recent Developments
- 17.2.8.5. Financials (Based on Availability)
- 17.2.9 Open Text Corporation
- 17.2.9.1. Overview
- 17.2.9.2. Products
- 17.2.9.3. SWOT Analysis
- 17.2.9.4. Recent Developments
- 17.2.9.5. Financials (Based on Availability)
- 17.2.10 Exabeam Inc
- 17.2.10.1. Overview
- 17.2.10.2. Products
- 17.2.10.3. SWOT Analysis
- 17.2.10.4. Recent Developments
- 17.2.10.5. Financials (Based on Availability)
- 17.2.11 AlienVault Inc
- 17.2.11.1. Overview
- 17.2.11.2. Products
- 17.2.11.3. SWOT Analysis
- 17.2.11.4. Recent Developments
- 17.2.11.5. Financials (Based on Availability)
- 17.2.12 Splunk Inc
- 17.2.12.1. Overview
- 17.2.12.2. Products
- 17.2.12.3. SWOT Analysis
- 17.2.12.4. Recent Developments
- 17.2.12.5. Financials (Based on Availability)
- 17.2.1 Hewlett Packard Enterprise Compan
List of Figures
- Figure 1: Global SIEM Market Revenue Breakdown (Million, %) by Region 2024 & 2032
- Figure 2: North America SIEM Market Revenue (Million), by Country 2024 & 2032
- Figure 3: North America SIEM Market Revenue Share (%), by Country 2024 & 2032
- Figure 4: Europe SIEM Market Revenue (Million), by Country 2024 & 2032
- Figure 5: Europe SIEM Market Revenue Share (%), by Country 2024 & 2032
- Figure 6: Asia Pacific SIEM Market Revenue (Million), by Country 2024 & 2032
- Figure 7: Asia Pacific SIEM Market Revenue Share (%), by Country 2024 & 2032
- Figure 8: South America SIEM Market Revenue (Million), by Country 2024 & 2032
- Figure 9: South America SIEM Market Revenue Share (%), by Country 2024 & 2032
- Figure 10: North America SIEM Market Revenue (Million), by Country 2024 & 2032
- Figure 11: North America SIEM Market Revenue Share (%), by Country 2024 & 2032
- Figure 12: MEA SIEM Market Revenue (Million), by Country 2024 & 2032
- Figure 13: MEA SIEM Market Revenue Share (%), by Country 2024 & 2032
- Figure 14: North America SIEM Market Revenue (Million), by Deployment 2024 & 2032
- Figure 15: North America SIEM Market Revenue Share (%), by Deployment 2024 & 2032
- Figure 16: North America SIEM Market Revenue (Million), by Organisation Type 2024 & 2032
- Figure 17: North America SIEM Market Revenue Share (%), by Organisation Type 2024 & 2032
- Figure 18: North America SIEM Market Revenue (Million), by End-user Industry 2024 & 2032
- Figure 19: North America SIEM Market Revenue Share (%), by End-user Industry 2024 & 2032
- Figure 20: North America SIEM Market Revenue (Million), by Country 2024 & 2032
- Figure 21: North America SIEM Market Revenue Share (%), by Country 2024 & 2032
- Figure 22: Europe SIEM Market Revenue (Million), by Deployment 2024 & 2032
- Figure 23: Europe SIEM Market Revenue Share (%), by Deployment 2024 & 2032
- Figure 24: Europe SIEM Market Revenue (Million), by Organisation Type 2024 & 2032
- Figure 25: Europe SIEM Market Revenue Share (%), by Organisation Type 2024 & 2032
- Figure 26: Europe SIEM Market Revenue (Million), by End-user Industry 2024 & 2032
- Figure 27: Europe SIEM Market Revenue Share (%), by End-user Industry 2024 & 2032
- Figure 28: Europe SIEM Market Revenue (Million), by Country 2024 & 2032
- Figure 29: Europe SIEM Market Revenue Share (%), by Country 2024 & 2032
- Figure 30: Asia SIEM Market Revenue (Million), by Deployment 2024 & 2032
- Figure 31: Asia SIEM Market Revenue Share (%), by Deployment 2024 & 2032
- Figure 32: Asia SIEM Market Revenue (Million), by Organisation Type 2024 & 2032
- Figure 33: Asia SIEM Market Revenue Share (%), by Organisation Type 2024 & 2032
- Figure 34: Asia SIEM Market Revenue (Million), by End-user Industry 2024 & 2032
- Figure 35: Asia SIEM Market Revenue Share (%), by End-user Industry 2024 & 2032
- Figure 36: Asia SIEM Market Revenue (Million), by Country 2024 & 2032
- Figure 37: Asia SIEM Market Revenue Share (%), by Country 2024 & 2032
- Figure 38: Latin America SIEM Market Revenue (Million), by Deployment 2024 & 2032
- Figure 39: Latin America SIEM Market Revenue Share (%), by Deployment 2024 & 2032
- Figure 40: Latin America SIEM Market Revenue (Million), by Organisation Type 2024 & 2032
- Figure 41: Latin America SIEM Market Revenue Share (%), by Organisation Type 2024 & 2032
- Figure 42: Latin America SIEM Market Revenue (Million), by End-user Industry 2024 & 2032
- Figure 43: Latin America SIEM Market Revenue Share (%), by End-user Industry 2024 & 2032
- Figure 44: Latin America SIEM Market Revenue (Million), by Country 2024 & 2032
- Figure 45: Latin America SIEM Market Revenue Share (%), by Country 2024 & 2032
- Figure 46: Middle East and Africa SIEM Market Revenue (Million), by Deployment 2024 & 2032
- Figure 47: Middle East and Africa SIEM Market Revenue Share (%), by Deployment 2024 & 2032
- Figure 48: Middle East and Africa SIEM Market Revenue (Million), by Organisation Type 2024 & 2032
- Figure 49: Middle East and Africa SIEM Market Revenue Share (%), by Organisation Type 2024 & 2032
- Figure 50: Middle East and Africa SIEM Market Revenue (Million), by End-user Industry 2024 & 2032
- Figure 51: Middle East and Africa SIEM Market Revenue Share (%), by End-user Industry 2024 & 2032
- Figure 52: Middle East and Africa SIEM Market Revenue (Million), by Country 2024 & 2032
- Figure 53: Middle East and Africa SIEM Market Revenue Share (%), by Country 2024 & 2032
List of Tables
- Table 1: Global SIEM Market Revenue Million Forecast, by Region 2019 & 2032
- Table 2: Global SIEM Market Revenue Million Forecast, by Deployment 2019 & 2032
- Table 3: Global SIEM Market Revenue Million Forecast, by Organisation Type 2019 & 2032
- Table 4: Global SIEM Market Revenue Million Forecast, by End-user Industry 2019 & 2032
- Table 5: Global SIEM Market Revenue Million Forecast, by Region 2019 & 2032
- Table 6: Global SIEM Market Revenue Million Forecast, by Country 2019 & 2032
- Table 7: United States SIEM Market Revenue (Million) Forecast, by Application 2019 & 2032
- Table 8: Canada SIEM Market Revenue (Million) Forecast, by Application 2019 & 2032
- Table 9: Mexico SIEM Market Revenue (Million) Forecast, by Application 2019 & 2032
- Table 10: Global SIEM Market Revenue Million Forecast, by Country 2019 & 2032
- Table 11: Germany SIEM Market Revenue (Million) Forecast, by Application 2019 & 2032
- Table 12: United Kingdom SIEM Market Revenue (Million) Forecast, by Application 2019 & 2032
- Table 13: France SIEM Market Revenue (Million) Forecast, by Application 2019 & 2032
- Table 14: Spain SIEM Market Revenue (Million) Forecast, by Application 2019 & 2032
- Table 15: Italy SIEM Market Revenue (Million) Forecast, by Application 2019 & 2032
- Table 16: Spain SIEM Market Revenue (Million) Forecast, by Application 2019 & 2032
- Table 17: Belgium SIEM Market Revenue (Million) Forecast, by Application 2019 & 2032
- Table 18: Netherland SIEM Market Revenue (Million) Forecast, by Application 2019 & 2032
- Table 19: Nordics SIEM Market Revenue (Million) Forecast, by Application 2019 & 2032
- Table 20: Rest of Europe SIEM Market Revenue (Million) Forecast, by Application 2019 & 2032
- Table 21: Global SIEM Market Revenue Million Forecast, by Country 2019 & 2032
- Table 22: China SIEM Market Revenue (Million) Forecast, by Application 2019 & 2032
- Table 23: Japan SIEM Market Revenue (Million) Forecast, by Application 2019 & 2032
- Table 24: India SIEM Market Revenue (Million) Forecast, by Application 2019 & 2032
- Table 25: South Korea SIEM Market Revenue (Million) Forecast, by Application 2019 & 2032
- Table 26: Southeast Asia SIEM Market Revenue (Million) Forecast, by Application 2019 & 2032
- Table 27: Australia SIEM Market Revenue (Million) Forecast, by Application 2019 & 2032
- Table 28: Indonesia SIEM Market Revenue (Million) Forecast, by Application 2019 & 2032
- Table 29: Phillipes SIEM Market Revenue (Million) Forecast, by Application 2019 & 2032
- Table 30: Singapore SIEM Market Revenue (Million) Forecast, by Application 2019 & 2032
- Table 31: Thailandc SIEM Market Revenue (Million) Forecast, by Application 2019 & 2032
- Table 32: Rest of Asia Pacific SIEM Market Revenue (Million) Forecast, by Application 2019 & 2032
- Table 33: Global SIEM Market Revenue Million Forecast, by Country 2019 & 2032
- Table 34: Brazil SIEM Market Revenue (Million) Forecast, by Application 2019 & 2032
- Table 35: Argentina SIEM Market Revenue (Million) Forecast, by Application 2019 & 2032
- Table 36: Peru SIEM Market Revenue (Million) Forecast, by Application 2019 & 2032
- Table 37: Chile SIEM Market Revenue (Million) Forecast, by Application 2019 & 2032
- Table 38: Colombia SIEM Market Revenue (Million) Forecast, by Application 2019 & 2032
- Table 39: Ecuador SIEM Market Revenue (Million) Forecast, by Application 2019 & 2032
- Table 40: Venezuela SIEM Market Revenue (Million) Forecast, by Application 2019 & 2032
- Table 41: Rest of South America SIEM Market Revenue (Million) Forecast, by Application 2019 & 2032
- Table 42: Global SIEM Market Revenue Million Forecast, by Country 2019 & 2032
- Table 43: United States SIEM Market Revenue (Million) Forecast, by Application 2019 & 2032
- Table 44: Canada SIEM Market Revenue (Million) Forecast, by Application 2019 & 2032
- Table 45: Mexico SIEM Market Revenue (Million) Forecast, by Application 2019 & 2032
- Table 46: Global SIEM Market Revenue Million Forecast, by Country 2019 & 2032
- Table 47: United Arab Emirates SIEM Market Revenue (Million) Forecast, by Application 2019 & 2032
- Table 48: Saudi Arabia SIEM Market Revenue (Million) Forecast, by Application 2019 & 2032
- Table 49: South Africa SIEM Market Revenue (Million) Forecast, by Application 2019 & 2032
- Table 50: Rest of Middle East and Africa SIEM Market Revenue (Million) Forecast, by Application 2019 & 2032
- Table 51: Global SIEM Market Revenue Million Forecast, by Deployment 2019 & 2032
- Table 52: Global SIEM Market Revenue Million Forecast, by Organisation Type 2019 & 2032
- Table 53: Global SIEM Market Revenue Million Forecast, by End-user Industry 2019 & 2032
- Table 54: Global SIEM Market Revenue Million Forecast, by Country 2019 & 2032
- Table 55: United States SIEM Market Revenue (Million) Forecast, by Application 2019 & 2032
- Table 56: Canada SIEM Market Revenue (Million) Forecast, by Application 2019 & 2032
- Table 57: Global SIEM Market Revenue Million Forecast, by Deployment 2019 & 2032
- Table 58: Global SIEM Market Revenue Million Forecast, by Organisation Type 2019 & 2032
- Table 59: Global SIEM Market Revenue Million Forecast, by End-user Industry 2019 & 2032
- Table 60: Global SIEM Market Revenue Million Forecast, by Country 2019 & 2032
- Table 61: Germany SIEM Market Revenue (Million) Forecast, by Application 2019 & 2032
- Table 62: United Kingdom SIEM Market Revenue (Million) Forecast, by Application 2019 & 2032
- Table 63: France SIEM Market Revenue (Million) Forecast, by Application 2019 & 2032
- Table 64: Global SIEM Market Revenue Million Forecast, by Deployment 2019 & 2032
- Table 65: Global SIEM Market Revenue Million Forecast, by Organisation Type 2019 & 2032
- Table 66: Global SIEM Market Revenue Million Forecast, by End-user Industry 2019 & 2032
- Table 67: Global SIEM Market Revenue Million Forecast, by Country 2019 & 2032
- Table 68: China SIEM Market Revenue (Million) Forecast, by Application 2019 & 2032
- Table 69: Japan SIEM Market Revenue (Million) Forecast, by Application 2019 & 2032
- Table 70: India SIEM Market Revenue (Million) Forecast, by Application 2019 & 2032
- Table 71: Australia and New Zealand SIEM Market Revenue (Million) Forecast, by Application 2019 & 2032
- Table 72: Global SIEM Market Revenue Million Forecast, by Deployment 2019 & 2032
- Table 73: Global SIEM Market Revenue Million Forecast, by Organisation Type 2019 & 2032
- Table 74: Global SIEM Market Revenue Million Forecast, by End-user Industry 2019 & 2032
- Table 75: Global SIEM Market Revenue Million Forecast, by Country 2019 & 2032
- Table 76: Brazil SIEM Market Revenue (Million) Forecast, by Application 2019 & 2032
- Table 77: Argentina SIEM Market Revenue (Million) Forecast, by Application 2019 & 2032
- Table 78: Global SIEM Market Revenue Million Forecast, by Deployment 2019 & 2032
- Table 79: Global SIEM Market Revenue Million Forecast, by Organisation Type 2019 & 2032
- Table 80: Global SIEM Market Revenue Million Forecast, by End-user Industry 2019 & 2032
- Table 81: Global SIEM Market Revenue Million Forecast, by Country 2019 & 2032
- Table 82: United Arab Emirates SIEM Market Revenue (Million) Forecast, by Application 2019 & 2032
Frequently Asked Questions
1. What is the projected Compound Annual Growth Rate (CAGR) of the SIEM Market?
The projected CAGR is approximately 12.16%.
2. Which companies are prominent players in the SIEM Market?
Key companies in the market include Hewlett Packard Enterprise Compan, IBM Corporation, Fortinet Inc, McAfee LLC, Securonix Inc, Rapid7 Inc, LogRhythm Inc, RSA Security LLC (Dell Technologies), Open Text Corporation, Exabeam Inc, AlienVault Inc, Splunk Inc.
3. What are the main segments of the SIEM Market?
The market segments include Deployment, Organisation Type, End-user Industry.
4. Can you provide details about the market size?
The market size is estimated to be USD 9.61 Million as of 2022.
5. What are some drivers contributing to market growth?
Growth in Security Concerns; Increasing Adoption of BYOD.
6. What are the notable trends driving market growth?
Cloud to Witness Significant Growth.
7. Are there any restraints impacting market growth?
Lack of Skilled Labor.
8. Can you provide examples of recent developments in the market?
November 2023: IBM unveiled a major update to its enterprise-ready threat detection and response (QRadar) SIEM product. The product has been re-engineered on a cloud-native foundation, designed for hybrid cloud scalability, speed, and flexibility. IBM also announced plans to deliver generic AI capabilities across its threat detection and response product portfolio – leveraging Watsonx, its enterprise data & AI platform.
9. What pricing options are available for accessing the report?
Pricing options include single-user, multi-user, and enterprise licenses priced at USD 4750, USD 5250, and USD 8750 respectively.
10. Is the market size provided in terms of value or volume?
The market size is provided in terms of value, measured in Million.
11. Are there any specific market keywords associated with the report?
Yes, the market keyword associated with the report is "SIEM Market," which aids in identifying and referencing the specific market segment covered.
12. How do I determine which pricing option suits my needs best?
The pricing options vary based on user requirements and access needs. Individual users may opt for single-user licenses, while businesses requiring broader access may choose multi-user or enterprise licenses for cost-effective access to the report.
13. Are there any additional resources or data provided in the SIEM Market report?
While the report offers comprehensive insights, it's advisable to review the specific contents or supplementary materials provided to ascertain if additional resources or data are available.
14. How can I stay updated on further developments or reports in the SIEM Market?
To stay informed about further developments, trends, and reports in the SIEM Market, consider subscribing to industry newsletters, following relevant companies and organizations, or regularly checking reputable industry news sources and publications.
Methodology
Step 1 - Identification of Relevant Samples Size from Population Database


Step 2 - Approaches for Defining Global Market Size (Value, Volume* & Price*)

Note*: In applicable scenarios
Step 3 - Data Sources
Primary Research
- Web Analytics
- Survey Reports
- Research Institute
- Latest Research Reports
- Opinion Leaders
Secondary Research
- Annual Reports
- White Paper
- Latest Press Release
- Industry Association
- Paid Database
- Investor Presentations

Step 4 - Data Triangulation
Involves using different sources of information in order to increase the validity of a study
These sources are likely to be stakeholders in a program - participants, other researchers, program staff, other community members, and so on.
Then we put all data in single framework & apply various statistical tools to find out the dynamic on the market.
During the analysis stage, feedback from the stakeholder groups would be compared to determine areas of agreement as well as areas of divergence


