
Key Insights
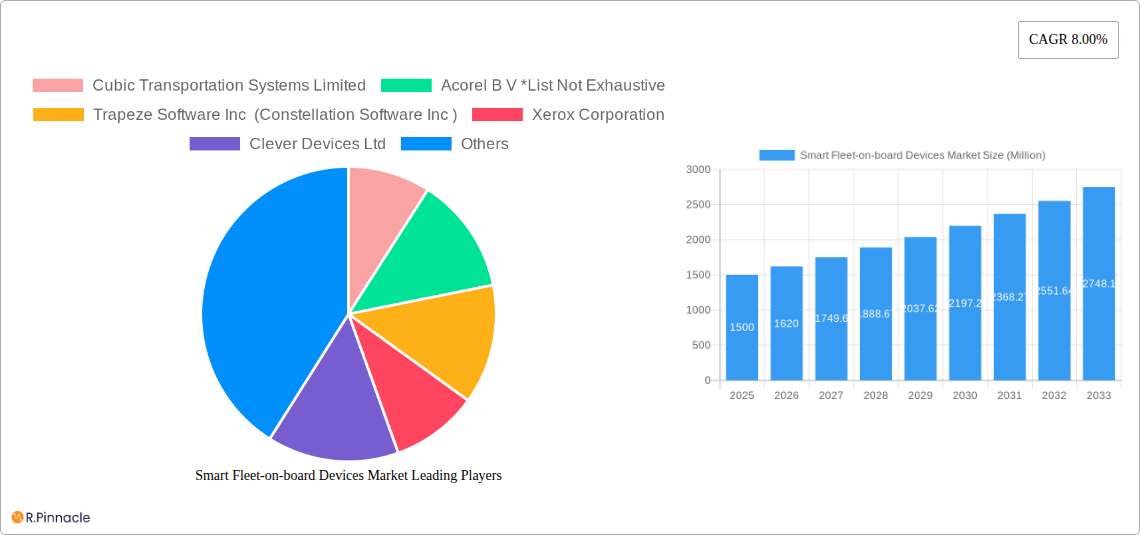
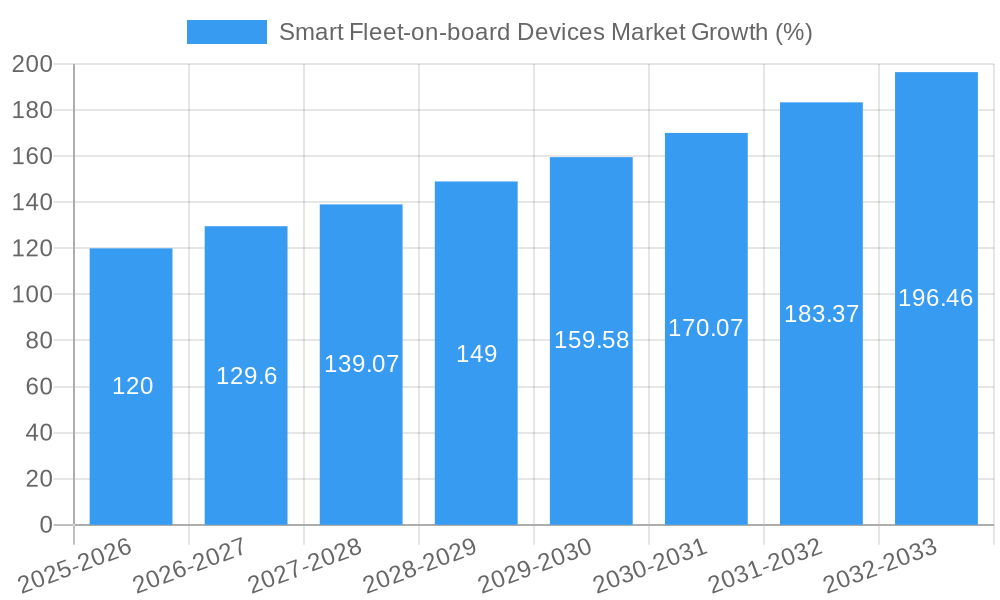
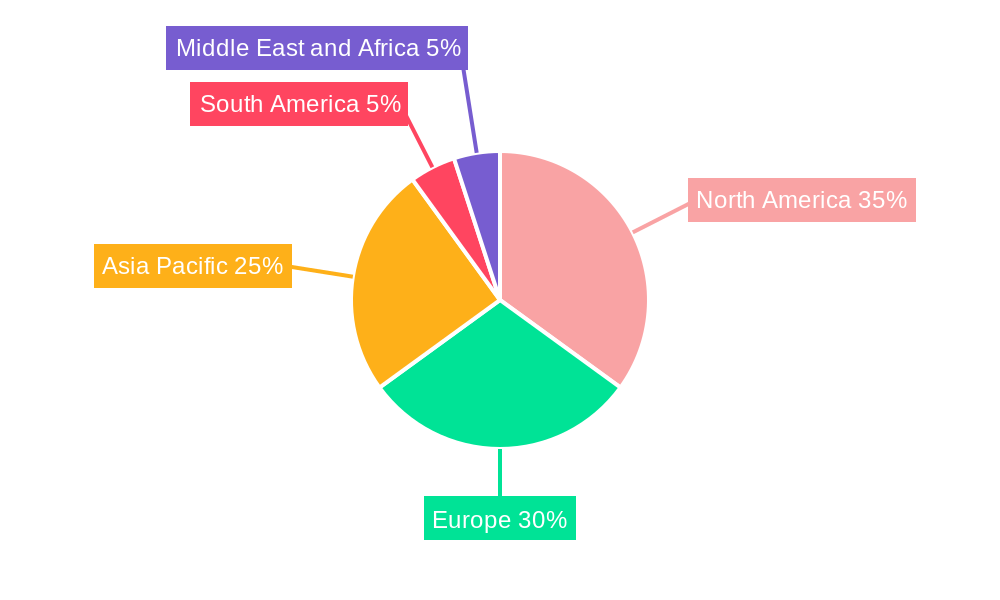
The global Smart Fleet-on-board Devices market is experiencing robust growth, projected to reach a substantial size over the forecast period (2025-2033). A Compound Annual Growth Rate (CAGR) of 8.00% indicates a consistently expanding market fueled by several key drivers. The increasing demand for enhanced fleet management, improved safety features, and optimized operational efficiency across various transportation sectors (buses, trains, and other commercial vehicles) are primary contributors to this growth. Technological advancements, particularly in GPS, GSM/GPRS, and other communication technologies, are enabling the development of sophisticated smart devices offering real-time data analytics and remote diagnostics. The integration of these devices into various fleet management solutions—vehicle tracking, diagnostics, and performance monitoring—is further propelling market expansion. Segmentation by solution, application, device type, and technology reflects the market's diversity and the potential for specialized product development. While challenges like high initial investment costs and the need for robust cybersecurity measures might act as restraints, the overall market outlook remains positive, driven by the long-term benefits of improved operational efficiency, reduced fuel consumption, and enhanced safety. The North American and European markets are currently expected to hold significant market share, but rapid growth is anticipated in the Asia-Pacific region, particularly as infrastructure developments and technological adoption progress.
The competitive landscape is dynamic, featuring established players like Cubic Transportation Systems Limited, Trapeze Software Inc, and Xerox Corporation, alongside innovative technology providers. The market's growth is likely to attract further investment and the entry of new companies, fostering innovation and competition. Furthermore, the continuous development of new features, such as improved analytics capabilities, AI-powered predictive maintenance, and integration with broader IoT ecosystems, will further shape the market's trajectory. Given the ongoing trend towards digitalization in the transportation sector and the increasing need for data-driven decision-making, the smart fleet-on-board devices market is poised for continued expansion and significant market value in the coming years. Market players are focusing on strategic partnerships and acquisitions to broaden their product offerings and extend market reach.
Smart Fleet-on-Board Devices Market Report: 2019-2033
This comprehensive report provides an in-depth analysis of the global Smart Fleet-on-board Devices Market, offering invaluable insights for industry professionals, investors, and strategic decision-makers. Covering the period from 2019 to 2033, with a focus on 2025, this report unveils the market's structure, dynamics, and future potential. The report leverages rigorous data analysis and expert insights to deliver actionable intelligence on market size, growth trends, segment performance, and key players.
Smart Fleet-on-board Devices Market Market Structure & Innovation Trends
This section analyzes the competitive landscape of the Smart Fleet-on-board Devices market, exploring market concentration, innovation drivers, regulatory influences, and market dynamics. The market exhibits moderate concentration, with key players such as Cubic Transportation Systems Limited, Acorel B V, Trapeze Software Inc (Constellation Software Inc), Xerox Corporation, Clever Devices Ltd, Hella Aglaia Mobile Vision GmbH, DILAX Intelcom GmbH, Eurotech Inc, Televic N V, and 21st Century Technology plc holding significant, but not dominant, market share. Precise market share figures for each company are unavailable for this report, requiring further research. However, preliminary estimates suggest a combined market share of approximately xx% for the named players. Innovation is driven by advancements in GPS/GNSS technology, the integration of IoT capabilities, and the rising demand for enhanced fleet management solutions. Regulatory frameworks vary across regions, impacting market adoption rates. Product substitutes, like basic telematics systems, continue to exist but are rapidly losing market share due to the functionalities offered by smart fleet-on-board devices. The market has witnessed several M&A activities in the past five years with a total estimated deal value of xx Million, although precise figures are unavailable due to the private nature of some transactions. End-user demographics are characterized by a growing preference for technology solutions that enhance operational efficiency and safety within fleet management.
Smart Fleet-on-board Devices Market Market Dynamics & Trends
The Smart Fleet-on-board Devices market is experiencing robust growth, driven by several key factors. The increasing adoption of smart city initiatives and the growing need for optimized transportation systems are major catalysts. Technological advancements, specifically in areas like AI, machine learning, and cloud computing, are enabling the development of more sophisticated and feature-rich devices. Consumer preferences are shifting towards real-time data analytics and predictive maintenance capabilities. The competitive landscape is dynamic, with companies focusing on product differentiation through innovative features and strategic partnerships. The market is projected to witness a Compound Annual Growth Rate (CAGR) of xx% during the forecast period (2025-2033), reaching a market value of xx Million by 2033. Market penetration is currently estimated at xx%, with significant room for expansion, especially in developing economies.
Dominant Regions & Segments in Smart Fleet-on-board Devices Market
The North American region currently holds the dominant position in the Smart Fleet-on-board Devices market, driven by factors including strong technological infrastructure, high adoption rates of advanced fleet management systems, and supportive government regulations. Within the segments, Vehicle Tracking consistently accounts for the largest market share by solution, followed by Vehicle Diagnostics and Vehicle Performance. The Buses application segment currently dominates the market by application, driven by increased demand for efficient and safe public transportation. Among devices, AVL systems hold the largest share, followed closely by APC systems. GPS technology remains the most widely adopted technology, but the use of GSM/GPRS is expected to increase with technological advancement.
- Key Drivers for North American Dominance:
- Advanced technological infrastructure.
- High adoption of advanced fleet management systems.
- Supportive government regulations and policies.
- Strong focus on optimizing transportation efficiency.
Smart Fleet-on-board Devices Market Product Innovations
Recent product innovations focus on integrating advanced analytics, AI-powered predictive maintenance, and improved data security features. New applications include route optimization, driver behavior monitoring, and real-time fuel efficiency tracking. These advancements deliver improved operational efficiency, enhanced safety, and reduced operational costs. The competitive advantage increasingly rests on offering comprehensive and integrated solutions tailored to specific fleet needs.
Report Scope & Segmentation Analysis
This report segments the Smart Fleet-on-board Devices market by solution (Vehicle Tracking, Vehicle Diagnostics, Vehicle Performance), application (Buses, Trains), devices (AVL, APC, Ticketing Solution), and technology (GPS, GSM/GPRS). Each segment's growth projections, market sizes, and competitive dynamics are analyzed individually. For instance, the Vehicle Tracking segment is anticipated to maintain substantial growth due to its crucial role in fleet management. The Buses application segment shows significant potential due to increasing urban populations and the need for efficient public transportation. The market size of each segment is expected to significantly expand during the forecast period due to factors such as growing infrastructure development and government investments.
Key Drivers of Smart Fleet-on-board Devices Market Growth
The growth of this market is primarily fueled by several factors. The increasing need for improved fleet management and operational efficiency is a primary driver. Government regulations mandating the adoption of safety and tracking technologies are significantly impacting market growth. Technological advancements, including the development of more sophisticated and integrated systems, are also boosting market expansion. Lastly, the growing adoption of smart city initiatives and the expansion of connected infrastructure are key contributors.
Challenges in the Smart Fleet-on-board Devices Market Sector
The market faces challenges such as high initial investment costs for implementing smart fleet systems. Concerns regarding data security and privacy represent a significant barrier to adoption. The complexity of integrating diverse systems across different fleets also poses a challenge. Finally, the competitive landscape presents continuous pressure, requiring companies to adapt and innovate. These challenges are estimated to impact market growth by approximately xx% over the forecast period.
Emerging Opportunities in Smart Fleet-on-board Devices Market
Significant opportunities lie in the expansion into emerging markets with growing transportation sectors. The development of innovative solutions focused on sustainability and reduced environmental impact presents considerable potential. Further integration with other technologies like AI and Machine Learning opens up new avenues for market expansion. Lastly, focusing on niche applications within specialized industries can lead to growth opportunities.
Leading Players in the Smart Fleet-on-board Devices Market Market
- Cubic Transportation Systems Limited
- Acorel B V
- Trapeze Software Inc (Constellation Software Inc)
- Xerox Corporation
- Clever Devices Ltd
- Hella Aglaia Mobile Vision GmbH
- DILAX Intelcom GmbH
- Eurotech Inc
- Televic N V
- 21st Century Technology plc
Key Developments in Smart Fleet-on-board Devices Market Industry
- Jan 2023: Cubic Transportation Systems Limited launched a new integrated fleet management system.
- June 2022: Acorel B V acquired a smaller competitor, expanding its market share.
- Oct 2021: Trapeze Software Inc released an upgraded version of its vehicle diagnostics software. (Further developments require additional research for specific dates and details.)
Future Outlook for Smart Fleet-on-board Devices Market Market
The future of the Smart Fleet-on-board Devices market appears bright, with continued growth anticipated throughout the forecast period. The convergence of various technologies and the increasing focus on operational efficiency and sustainability are expected to drive market expansion. Strategic partnerships and product innovation will play a crucial role in shaping the future competitive landscape. The market is poised for substantial growth, driven by technological innovation and increasing adoption across diverse industries.
Smart Fleet-on-board Devices Market Segmentation
-
1. Devices
- 1.1. AVL
- 1.2. APC
- 1.3. Ticketing Solution
-
2. Technology
- 2.1. GPS
- 2.2. GSM/GPRS
-
3. Solution
- 3.1. Vehicle Tracking
- 3.2. Vehicle Diagnostics
- 3.3. Vehicle Performance
-
4. Application
- 4.1. Buses
- 4.2. Trains
Smart Fleet-on-board Devices Market Segmentation By Geography
- 1. North America
- 2. Europe
- 3. Asia Pacific
- 4. South America
- 5. Middle East and Africa
Smart Fleet-on-board Devices Market REPORT HIGHLIGHTS
| Aspects | Details |
|---|---|
| Study Period | 2019-2033 |
| Base Year | 2024 |
| Estimated Year | 2025 |
| Forecast Period | 2025-2033 |
| Historical Period | 2019-2024 |
| Growth Rate | CAGR of 8.00% from 2019-2033 |
| Segmentation |
|
Table of Contents
- 1. Introduction
- 1.1. Research Scope
- 1.2. Market Segmentation
- 1.3. Research Methodology
- 1.4. Definitions and Assumptions
- 2. Executive Summary
- 2.1. Introduction
- 3. Market Dynamics
- 3.1. Introduction
- 3.2. Market Drivers
- 3.2.1. ; Technological Advancement in the Ticketing Systems will Drive the Market Growth; Increase in Adoption of Telematics and Growing Use of Autonomous and Electric Vehicles
- 3.3. Market Restrains
- 3.3.1. ; Security and Management of Huge Data Generated Everyday
- 3.4. Market Trends
- 3.4.1. Technological Advancement in the Ticketing Systems will Drive the Market Growth
- 4. Market Factor Analysis
- 4.1. Porters Five Forces
- 4.2. Supply/Value Chain
- 4.3. PESTEL analysis
- 4.4. Market Entropy
- 4.5. Patent/Trademark Analysis
- 5. Global Smart Fleet-on-board Devices Market Analysis, Insights and Forecast, 2019-2031
- 5.1. Market Analysis, Insights and Forecast - by Devices
- 5.1.1. AVL
- 5.1.2. APC
- 5.1.3. Ticketing Solution
- 5.2. Market Analysis, Insights and Forecast - by Technology
- 5.2.1. GPS
- 5.2.2. GSM/GPRS
- 5.3. Market Analysis, Insights and Forecast - by Solution
- 5.3.1. Vehicle Tracking
- 5.3.2. Vehicle Diagnostics
- 5.3.3. Vehicle Performance
- 5.4. Market Analysis, Insights and Forecast - by Application
- 5.4.1. Buses
- 5.4.2. Trains
- 5.5. Market Analysis, Insights and Forecast - by Region
- 5.5.1. North America
- 5.5.2. Europe
- 5.5.3. Asia Pacific
- 5.5.4. South America
- 5.5.5. Middle East and Africa
- 5.1. Market Analysis, Insights and Forecast - by Devices
- 6. North America Smart Fleet-on-board Devices Market Analysis, Insights and Forecast, 2019-2031
- 6.1. Market Analysis, Insights and Forecast - by Devices
- 6.1.1. AVL
- 6.1.2. APC
- 6.1.3. Ticketing Solution
- 6.2. Market Analysis, Insights and Forecast - by Technology
- 6.2.1. GPS
- 6.2.2. GSM/GPRS
- 6.3. Market Analysis, Insights and Forecast - by Solution
- 6.3.1. Vehicle Tracking
- 6.3.2. Vehicle Diagnostics
- 6.3.3. Vehicle Performance
- 6.4. Market Analysis, Insights and Forecast - by Application
- 6.4.1. Buses
- 6.4.2. Trains
- 6.1. Market Analysis, Insights and Forecast - by Devices
- 7. Europe Smart Fleet-on-board Devices Market Analysis, Insights and Forecast, 2019-2031
- 7.1. Market Analysis, Insights and Forecast - by Devices
- 7.1.1. AVL
- 7.1.2. APC
- 7.1.3. Ticketing Solution
- 7.2. Market Analysis, Insights and Forecast - by Technology
- 7.2.1. GPS
- 7.2.2. GSM/GPRS
- 7.3. Market Analysis, Insights and Forecast - by Solution
- 7.3.1. Vehicle Tracking
- 7.3.2. Vehicle Diagnostics
- 7.3.3. Vehicle Performance
- 7.4. Market Analysis, Insights and Forecast - by Application
- 7.4.1. Buses
- 7.4.2. Trains
- 7.1. Market Analysis, Insights and Forecast - by Devices
- 8. Asia Pacific Smart Fleet-on-board Devices Market Analysis, Insights and Forecast, 2019-2031
- 8.1. Market Analysis, Insights and Forecast - by Devices
- 8.1.1. AVL
- 8.1.2. APC
- 8.1.3. Ticketing Solution
- 8.2. Market Analysis, Insights and Forecast - by Technology
- 8.2.1. GPS
- 8.2.2. GSM/GPRS
- 8.3. Market Analysis, Insights and Forecast - by Solution
- 8.3.1. Vehicle Tracking
- 8.3.2. Vehicle Diagnostics
- 8.3.3. Vehicle Performance
- 8.4. Market Analysis, Insights and Forecast - by Application
- 8.4.1. Buses
- 8.4.2. Trains
- 8.1. Market Analysis, Insights and Forecast - by Devices
- 9. South America Smart Fleet-on-board Devices Market Analysis, Insights and Forecast, 2019-2031
- 9.1. Market Analysis, Insights and Forecast - by Devices
- 9.1.1. AVL
- 9.1.2. APC
- 9.1.3. Ticketing Solution
- 9.2. Market Analysis, Insights and Forecast - by Technology
- 9.2.1. GPS
- 9.2.2. GSM/GPRS
- 9.3. Market Analysis, Insights and Forecast - by Solution
- 9.3.1. Vehicle Tracking
- 9.3.2. Vehicle Diagnostics
- 9.3.3. Vehicle Performance
- 9.4. Market Analysis, Insights and Forecast - by Application
- 9.4.1. Buses
- 9.4.2. Trains
- 9.1. Market Analysis, Insights and Forecast - by Devices
- 10. Middle East and Africa Smart Fleet-on-board Devices Market Analysis, Insights and Forecast, 2019-2031
- 10.1. Market Analysis, Insights and Forecast - by Devices
- 10.1.1. AVL
- 10.1.2. APC
- 10.1.3. Ticketing Solution
- 10.2. Market Analysis, Insights and Forecast - by Technology
- 10.2.1. GPS
- 10.2.2. GSM/GPRS
- 10.3. Market Analysis, Insights and Forecast - by Solution
- 10.3.1. Vehicle Tracking
- 10.3.2. Vehicle Diagnostics
- 10.3.3. Vehicle Performance
- 10.4. Market Analysis, Insights and Forecast - by Application
- 10.4.1. Buses
- 10.4.2. Trains
- 10.1. Market Analysis, Insights and Forecast - by Devices
- 11. North America Smart Fleet-on-board Devices Market Analysis, Insights and Forecast, 2019-2031
- 11.1. Market Analysis, Insights and Forecast - By Country/Sub-region
- 11.1.1.
- 12. Europe Smart Fleet-on-board Devices Market Analysis, Insights and Forecast, 2019-2031
- 12.1. Market Analysis, Insights and Forecast - By Country/Sub-region
- 12.1.1.
- 13. Asia Pacific Smart Fleet-on-board Devices Market Analysis, Insights and Forecast, 2019-2031
- 13.1. Market Analysis, Insights and Forecast - By Country/Sub-region
- 13.1.1.
- 14. South America Smart Fleet-on-board Devices Market Analysis, Insights and Forecast, 2019-2031
- 14.1. Market Analysis, Insights and Forecast - By Country/Sub-region
- 14.1.1.
- 15. Middle East and Africa Smart Fleet-on-board Devices Market Analysis, Insights and Forecast, 2019-2031
- 15.1. Market Analysis, Insights and Forecast - By Country/Sub-region
- 15.1.1.
- 16. Competitive Analysis
- 16.1. Global Market Share Analysis 2024
- 16.2. Company Profiles
- 16.2.1 Cubic Transportation Systems Limited
- 16.2.1.1. Overview
- 16.2.1.2. Products
- 16.2.1.3. SWOT Analysis
- 16.2.1.4. Recent Developments
- 16.2.1.5. Financials (Based on Availability)
- 16.2.2 Acorel B V *List Not Exhaustive
- 16.2.2.1. Overview
- 16.2.2.2. Products
- 16.2.2.3. SWOT Analysis
- 16.2.2.4. Recent Developments
- 16.2.2.5. Financials (Based on Availability)
- 16.2.3 Trapeze Software Inc (Constellation Software Inc )
- 16.2.3.1. Overview
- 16.2.3.2. Products
- 16.2.3.3. SWOT Analysis
- 16.2.3.4. Recent Developments
- 16.2.3.5. Financials (Based on Availability)
- 16.2.4 Xerox Corporation
- 16.2.4.1. Overview
- 16.2.4.2. Products
- 16.2.4.3. SWOT Analysis
- 16.2.4.4. Recent Developments
- 16.2.4.5. Financials (Based on Availability)
- 16.2.5 Clever Devices Ltd
- 16.2.5.1. Overview
- 16.2.5.2. Products
- 16.2.5.3. SWOT Analysis
- 16.2.5.4. Recent Developments
- 16.2.5.5. Financials (Based on Availability)
- 16.2.6 Hella Aglaia Mobile Vision GmbH
- 16.2.6.1. Overview
- 16.2.6.2. Products
- 16.2.6.3. SWOT Analysis
- 16.2.6.4. Recent Developments
- 16.2.6.5. Financials (Based on Availability)
- 16.2.7 DILAX Intelcom GmbH
- 16.2.7.1. Overview
- 16.2.7.2. Products
- 16.2.7.3. SWOT Analysis
- 16.2.7.4. Recent Developments
- 16.2.7.5. Financials (Based on Availability)
- 16.2.8 Eurotech Inc
- 16.2.8.1. Overview
- 16.2.8.2. Products
- 16.2.8.3. SWOT Analysis
- 16.2.8.4. Recent Developments
- 16.2.8.5. Financials (Based on Availability)
- 16.2.9 Televic N V
- 16.2.9.1. Overview
- 16.2.9.2. Products
- 16.2.9.3. SWOT Analysis
- 16.2.9.4. Recent Developments
- 16.2.9.5. Financials (Based on Availability)
- 16.2.10 21st Century Technology plc
- 16.2.10.1. Overview
- 16.2.10.2. Products
- 16.2.10.3. SWOT Analysis
- 16.2.10.4. Recent Developments
- 16.2.10.5. Financials (Based on Availability)
- 16.2.1 Cubic Transportation Systems Limited
List of Figures
- Figure 1: Global Smart Fleet-on-board Devices Market Revenue Breakdown (Million, %) by Region 2024 & 2032
- Figure 2: North America Smart Fleet-on-board Devices Market Revenue (Million), by Country 2024 & 2032
- Figure 3: North America Smart Fleet-on-board Devices Market Revenue Share (%), by Country 2024 & 2032
- Figure 4: Europe Smart Fleet-on-board Devices Market Revenue (Million), by Country 2024 & 2032
- Figure 5: Europe Smart Fleet-on-board Devices Market Revenue Share (%), by Country 2024 & 2032
- Figure 6: Asia Pacific Smart Fleet-on-board Devices Market Revenue (Million), by Country 2024 & 2032
- Figure 7: Asia Pacific Smart Fleet-on-board Devices Market Revenue Share (%), by Country 2024 & 2032
- Figure 8: South America Smart Fleet-on-board Devices Market Revenue (Million), by Country 2024 & 2032
- Figure 9: South America Smart Fleet-on-board Devices Market Revenue Share (%), by Country 2024 & 2032
- Figure 10: Middle East and Africa Smart Fleet-on-board Devices Market Revenue (Million), by Country 2024 & 2032
- Figure 11: Middle East and Africa Smart Fleet-on-board Devices Market Revenue Share (%), by Country 2024 & 2032
- Figure 12: North America Smart Fleet-on-board Devices Market Revenue (Million), by Devices 2024 & 2032
- Figure 13: North America Smart Fleet-on-board Devices Market Revenue Share (%), by Devices 2024 & 2032
- Figure 14: North America Smart Fleet-on-board Devices Market Revenue (Million), by Technology 2024 & 2032
- Figure 15: North America Smart Fleet-on-board Devices Market Revenue Share (%), by Technology 2024 & 2032
- Figure 16: North America Smart Fleet-on-board Devices Market Revenue (Million), by Solution 2024 & 2032
- Figure 17: North America Smart Fleet-on-board Devices Market Revenue Share (%), by Solution 2024 & 2032
- Figure 18: North America Smart Fleet-on-board Devices Market Revenue (Million), by Application 2024 & 2032
- Figure 19: North America Smart Fleet-on-board Devices Market Revenue Share (%), by Application 2024 & 2032
- Figure 20: North America Smart Fleet-on-board Devices Market Revenue (Million), by Country 2024 & 2032
- Figure 21: North America Smart Fleet-on-board Devices Market Revenue Share (%), by Country 2024 & 2032
- Figure 22: Europe Smart Fleet-on-board Devices Market Revenue (Million), by Devices 2024 & 2032
- Figure 23: Europe Smart Fleet-on-board Devices Market Revenue Share (%), by Devices 2024 & 2032
- Figure 24: Europe Smart Fleet-on-board Devices Market Revenue (Million), by Technology 2024 & 2032
- Figure 25: Europe Smart Fleet-on-board Devices Market Revenue Share (%), by Technology 2024 & 2032
- Figure 26: Europe Smart Fleet-on-board Devices Market Revenue (Million), by Solution 2024 & 2032
- Figure 27: Europe Smart Fleet-on-board Devices Market Revenue Share (%), by Solution 2024 & 2032
- Figure 28: Europe Smart Fleet-on-board Devices Market Revenue (Million), by Application 2024 & 2032
- Figure 29: Europe Smart Fleet-on-board Devices Market Revenue Share (%), by Application 2024 & 2032
- Figure 30: Europe Smart Fleet-on-board Devices Market Revenue (Million), by Country 2024 & 2032
- Figure 31: Europe Smart Fleet-on-board Devices Market Revenue Share (%), by Country 2024 & 2032
- Figure 32: Asia Pacific Smart Fleet-on-board Devices Market Revenue (Million), by Devices 2024 & 2032
- Figure 33: Asia Pacific Smart Fleet-on-board Devices Market Revenue Share (%), by Devices 2024 & 2032
- Figure 34: Asia Pacific Smart Fleet-on-board Devices Market Revenue (Million), by Technology 2024 & 2032
- Figure 35: Asia Pacific Smart Fleet-on-board Devices Market Revenue Share (%), by Technology 2024 & 2032
- Figure 36: Asia Pacific Smart Fleet-on-board Devices Market Revenue (Million), by Solution 2024 & 2032
- Figure 37: Asia Pacific Smart Fleet-on-board Devices Market Revenue Share (%), by Solution 2024 & 2032
- Figure 38: Asia Pacific Smart Fleet-on-board Devices Market Revenue (Million), by Application 2024 & 2032
- Figure 39: Asia Pacific Smart Fleet-on-board Devices Market Revenue Share (%), by Application 2024 & 2032
- Figure 40: Asia Pacific Smart Fleet-on-board Devices Market Revenue (Million), by Country 2024 & 2032
- Figure 41: Asia Pacific Smart Fleet-on-board Devices Market Revenue Share (%), by Country 2024 & 2032
- Figure 42: South America Smart Fleet-on-board Devices Market Revenue (Million), by Devices 2024 & 2032
- Figure 43: South America Smart Fleet-on-board Devices Market Revenue Share (%), by Devices 2024 & 2032
- Figure 44: South America Smart Fleet-on-board Devices Market Revenue (Million), by Technology 2024 & 2032
- Figure 45: South America Smart Fleet-on-board Devices Market Revenue Share (%), by Technology 2024 & 2032
- Figure 46: South America Smart Fleet-on-board Devices Market Revenue (Million), by Solution 2024 & 2032
- Figure 47: South America Smart Fleet-on-board Devices Market Revenue Share (%), by Solution 2024 & 2032
- Figure 48: South America Smart Fleet-on-board Devices Market Revenue (Million), by Application 2024 & 2032
- Figure 49: South America Smart Fleet-on-board Devices Market Revenue Share (%), by Application 2024 & 2032
- Figure 50: South America Smart Fleet-on-board Devices Market Revenue (Million), by Country 2024 & 2032
- Figure 51: South America Smart Fleet-on-board Devices Market Revenue Share (%), by Country 2024 & 2032
- Figure 52: Middle East and Africa Smart Fleet-on-board Devices Market Revenue (Million), by Devices 2024 & 2032
- Figure 53: Middle East and Africa Smart Fleet-on-board Devices Market Revenue Share (%), by Devices 2024 & 2032
- Figure 54: Middle East and Africa Smart Fleet-on-board Devices Market Revenue (Million), by Technology 2024 & 2032
- Figure 55: Middle East and Africa Smart Fleet-on-board Devices Market Revenue Share (%), by Technology 2024 & 2032
- Figure 56: Middle East and Africa Smart Fleet-on-board Devices Market Revenue (Million), by Solution 2024 & 2032
- Figure 57: Middle East and Africa Smart Fleet-on-board Devices Market Revenue Share (%), by Solution 2024 & 2032
- Figure 58: Middle East and Africa Smart Fleet-on-board Devices Market Revenue (Million), by Application 2024 & 2032
- Figure 59: Middle East and Africa Smart Fleet-on-board Devices Market Revenue Share (%), by Application 2024 & 2032
- Figure 60: Middle East and Africa Smart Fleet-on-board Devices Market Revenue (Million), by Country 2024 & 2032
- Figure 61: Middle East and Africa Smart Fleet-on-board Devices Market Revenue Share (%), by Country 2024 & 2032
List of Tables
- Table 1: Global Smart Fleet-on-board Devices Market Revenue Million Forecast, by Region 2019 & 2032
- Table 2: Global Smart Fleet-on-board Devices Market Revenue Million Forecast, by Devices 2019 & 2032
- Table 3: Global Smart Fleet-on-board Devices Market Revenue Million Forecast, by Technology 2019 & 2032
- Table 4: Global Smart Fleet-on-board Devices Market Revenue Million Forecast, by Solution 2019 & 2032
- Table 5: Global Smart Fleet-on-board Devices Market Revenue Million Forecast, by Application 2019 & 2032
- Table 6: Global Smart Fleet-on-board Devices Market Revenue Million Forecast, by Region 2019 & 2032
- Table 7: Global Smart Fleet-on-board Devices Market Revenue Million Forecast, by Country 2019 & 2032
- Table 8: Smart Fleet-on-board Devices Market Revenue (Million) Forecast, by Application 2019 & 2032
- Table 9: Global Smart Fleet-on-board Devices Market Revenue Million Forecast, by Country 2019 & 2032
- Table 10: Smart Fleet-on-board Devices Market Revenue (Million) Forecast, by Application 2019 & 2032
- Table 11: Global Smart Fleet-on-board Devices Market Revenue Million Forecast, by Country 2019 & 2032
- Table 12: Smart Fleet-on-board Devices Market Revenue (Million) Forecast, by Application 2019 & 2032
- Table 13: Global Smart Fleet-on-board Devices Market Revenue Million Forecast, by Country 2019 & 2032
- Table 14: Smart Fleet-on-board Devices Market Revenue (Million) Forecast, by Application 2019 & 2032
- Table 15: Global Smart Fleet-on-board Devices Market Revenue Million Forecast, by Country 2019 & 2032
- Table 16: Smart Fleet-on-board Devices Market Revenue (Million) Forecast, by Application 2019 & 2032
- Table 17: Global Smart Fleet-on-board Devices Market Revenue Million Forecast, by Devices 2019 & 2032
- Table 18: Global Smart Fleet-on-board Devices Market Revenue Million Forecast, by Technology 2019 & 2032
- Table 19: Global Smart Fleet-on-board Devices Market Revenue Million Forecast, by Solution 2019 & 2032
- Table 20: Global Smart Fleet-on-board Devices Market Revenue Million Forecast, by Application 2019 & 2032
- Table 21: Global Smart Fleet-on-board Devices Market Revenue Million Forecast, by Country 2019 & 2032
- Table 22: Global Smart Fleet-on-board Devices Market Revenue Million Forecast, by Devices 2019 & 2032
- Table 23: Global Smart Fleet-on-board Devices Market Revenue Million Forecast, by Technology 2019 & 2032
- Table 24: Global Smart Fleet-on-board Devices Market Revenue Million Forecast, by Solution 2019 & 2032
- Table 25: Global Smart Fleet-on-board Devices Market Revenue Million Forecast, by Application 2019 & 2032
- Table 26: Global Smart Fleet-on-board Devices Market Revenue Million Forecast, by Country 2019 & 2032
- Table 27: Global Smart Fleet-on-board Devices Market Revenue Million Forecast, by Devices 2019 & 2032
- Table 28: Global Smart Fleet-on-board Devices Market Revenue Million Forecast, by Technology 2019 & 2032
- Table 29: Global Smart Fleet-on-board Devices Market Revenue Million Forecast, by Solution 2019 & 2032
- Table 30: Global Smart Fleet-on-board Devices Market Revenue Million Forecast, by Application 2019 & 2032
- Table 31: Global Smart Fleet-on-board Devices Market Revenue Million Forecast, by Country 2019 & 2032
- Table 32: Global Smart Fleet-on-board Devices Market Revenue Million Forecast, by Devices 2019 & 2032
- Table 33: Global Smart Fleet-on-board Devices Market Revenue Million Forecast, by Technology 2019 & 2032
- Table 34: Global Smart Fleet-on-board Devices Market Revenue Million Forecast, by Solution 2019 & 2032
- Table 35: Global Smart Fleet-on-board Devices Market Revenue Million Forecast, by Application 2019 & 2032
- Table 36: Global Smart Fleet-on-board Devices Market Revenue Million Forecast, by Country 2019 & 2032
- Table 37: Global Smart Fleet-on-board Devices Market Revenue Million Forecast, by Devices 2019 & 2032
- Table 38: Global Smart Fleet-on-board Devices Market Revenue Million Forecast, by Technology 2019 & 2032
- Table 39: Global Smart Fleet-on-board Devices Market Revenue Million Forecast, by Solution 2019 & 2032
- Table 40: Global Smart Fleet-on-board Devices Market Revenue Million Forecast, by Application 2019 & 2032
- Table 41: Global Smart Fleet-on-board Devices Market Revenue Million Forecast, by Country 2019 & 2032
Frequently Asked Questions
1. What is the projected Compound Annual Growth Rate (CAGR) of the Smart Fleet-on-board Devices Market?
The projected CAGR is approximately 8.00%.
2. Which companies are prominent players in the Smart Fleet-on-board Devices Market?
Key companies in the market include Cubic Transportation Systems Limited, Acorel B V *List Not Exhaustive, Trapeze Software Inc (Constellation Software Inc ), Xerox Corporation, Clever Devices Ltd, Hella Aglaia Mobile Vision GmbH, DILAX Intelcom GmbH, Eurotech Inc, Televic N V, 21st Century Technology plc.
3. What are the main segments of the Smart Fleet-on-board Devices Market?
The market segments include Devices, Technology, Solution, Application.
4. Can you provide details about the market size?
The market size is estimated to be USD XX Million as of 2022.
5. What are some drivers contributing to market growth?
; Technological Advancement in the Ticketing Systems will Drive the Market Growth; Increase in Adoption of Telematics and Growing Use of Autonomous and Electric Vehicles.
6. What are the notable trends driving market growth?
Technological Advancement in the Ticketing Systems will Drive the Market Growth.
7. Are there any restraints impacting market growth?
; Security and Management of Huge Data Generated Everyday.
8. Can you provide examples of recent developments in the market?
N/A
9. What pricing options are available for accessing the report?
Pricing options include single-user, multi-user, and enterprise licenses priced at USD 4750, USD 5250, and USD 8750 respectively.
10. Is the market size provided in terms of value or volume?
The market size is provided in terms of value, measured in Million.
11. Are there any specific market keywords associated with the report?
Yes, the market keyword associated with the report is "Smart Fleet-on-board Devices Market," which aids in identifying and referencing the specific market segment covered.
12. How do I determine which pricing option suits my needs best?
The pricing options vary based on user requirements and access needs. Individual users may opt for single-user licenses, while businesses requiring broader access may choose multi-user or enterprise licenses for cost-effective access to the report.
13. Are there any additional resources or data provided in the Smart Fleet-on-board Devices Market report?
While the report offers comprehensive insights, it's advisable to review the specific contents or supplementary materials provided to ascertain if additional resources or data are available.
14. How can I stay updated on further developments or reports in the Smart Fleet-on-board Devices Market?
To stay informed about further developments, trends, and reports in the Smart Fleet-on-board Devices Market, consider subscribing to industry newsletters, following relevant companies and organizations, or regularly checking reputable industry news sources and publications.
Methodology
Step 1 - Identification of Relevant Samples Size from Population Database


Step 2 - Approaches for Defining Global Market Size (Value, Volume* & Price*)

Note*: In applicable scenarios
Step 3 - Data Sources
Primary Research
- Web Analytics
- Survey Reports
- Research Institute
- Latest Research Reports
- Opinion Leaders
Secondary Research
- Annual Reports
- White Paper
- Latest Press Release
- Industry Association
- Paid Database
- Investor Presentations

Step 4 - Data Triangulation
Involves using different sources of information in order to increase the validity of a study
These sources are likely to be stakeholders in a program - participants, other researchers, program staff, other community members, and so on.
Then we put all data in single framework & apply various statistical tools to find out the dynamic on the market.
During the analysis stage, feedback from the stakeholder groups would be compared to determine areas of agreement as well as areas of divergence


