
Key Insights
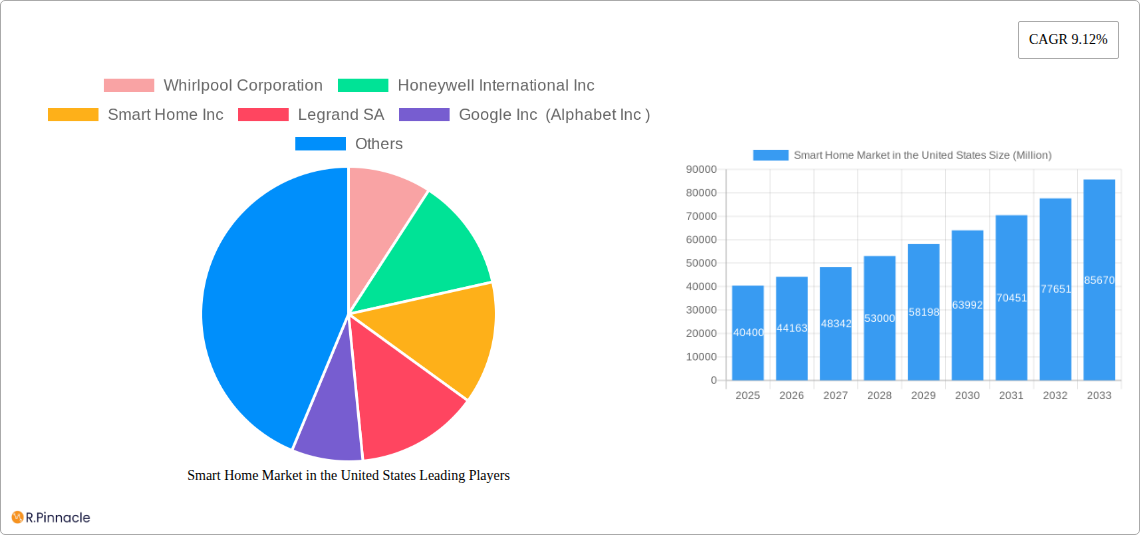
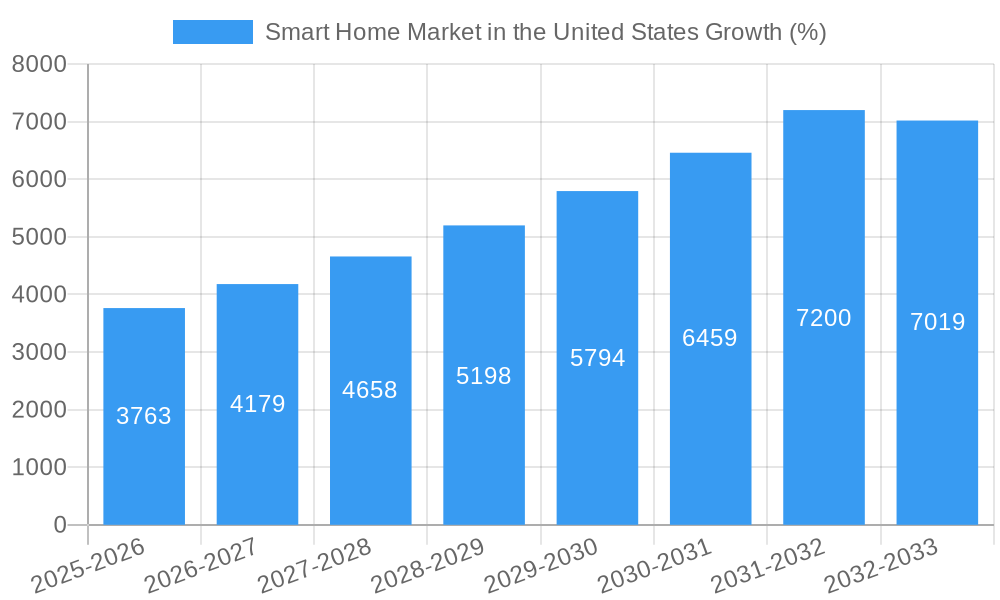
The United States smart home market is experiencing robust growth, projected to reach a substantial size driven by increasing adoption of smart devices and a rising demand for enhanced home security, energy efficiency, and convenience. The market, valued at approximately $40.40 billion in 2025, is anticipated to maintain a Compound Annual Growth Rate (CAGR) of 9.12% from 2025 to 2033. This growth is fueled by several key factors. Firstly, technological advancements continue to make smart home devices more affordable and user-friendly, broadening their appeal to a wider consumer base. Secondly, the increasing integration of smart home systems with other technologies, such as voice assistants and mobile applications, provides enhanced control and seamless user experience. Furthermore, a heightened focus on home security and energy efficiency, spurred by rising energy costs and increasing concerns about safety, significantly contributes to market expansion. The segments with the most significant growth potential are likely to be smart home security systems, driven by increasing crime rates and demand for remote monitoring capabilities, and energy management solutions, as homeowners seek to reduce their environmental impact and utility bills. Competition in the market is intense, with established players like Whirlpool, Honeywell, and Google competing alongside specialized smart home companies and emerging technology firms.
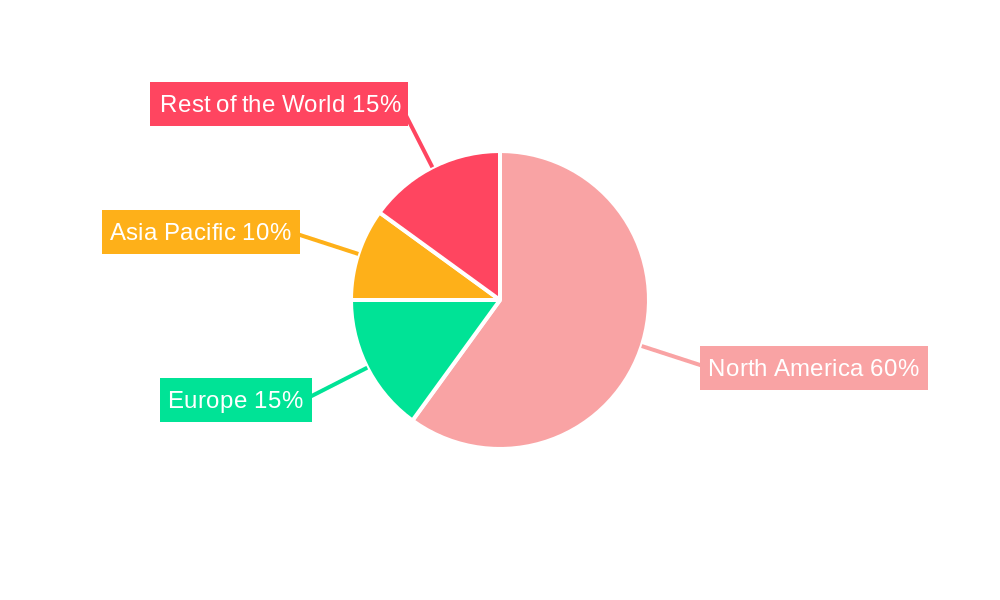
The geographical distribution within the US market shows strong growth across all regions, although areas with higher disposable incomes and technological adoption rates, such as urban centers in the Northeast and West Coast, may exhibit higher market penetration. However, the market is far from saturated, and expansion into smaller towns and rural areas presents significant opportunities for future growth. Challenges remain, including concerns regarding data privacy and security, the complexity of integrating disparate systems, and the potential for technical malfunctions. Nonetheless, the long-term outlook for the US smart home market remains exceptionally positive, fueled by continued technological innovation, consumer preference for convenience and increased awareness of the benefits offered by smart home solutions.
Smart Home Market in the United States: A Comprehensive Report (2019-2033)
This in-depth report provides a comprehensive analysis of the burgeoning Smart Home Market in the United States, offering valuable insights for industry professionals, investors, and strategic decision-makers. We analyze market trends, competitive dynamics, and growth opportunities from 2019 to 2033, with a focus on the key players shaping this dynamic sector. Our meticulous research leverages a combination of primary and secondary data sources to deliver actionable intelligence, ensuring you stay ahead in this rapidly evolving landscape. The report encompasses a detailed segmentation analysis, examining growth projections, market sizes, and competitive dynamics across various product types and geographical locations. The forecast period is 2025-2033, with 2025 as the base year and 2025 as the estimated year. The historical period analyzed is 2019-2024.
Smart Home Market in the United States Market Structure & Innovation Trends
The US smart home market is characterized by a moderately concentrated structure, with several large multinational corporations holding significant market share. Key players include Whirlpool Corporation, Honeywell International Inc, Google (Alphabet Inc.), LG Electronics Inc., and others. While these giants dominate, a dynamic ecosystem of smaller, specialized companies fosters continuous innovation. The market exhibits high innovation driven by advancements in AI, IoT, and cloud computing. Regulatory frameworks, while evolving, are generally supportive of smart home technology adoption. Product substitutes, such as traditional home appliances and security systems, still exist, but their market share is declining due to the increasing affordability and functionality of smart home alternatives. End-user demographics show a strong preference among higher-income households and tech-savvy individuals, though broader adoption is steadily increasing across various age groups and income levels. M&A activity is prominent, with deal values in the hundreds of Millions of dollars in recent years, reflecting strategic consolidation and the pursuit of technological synergies. For example, the acquisition of xx company by xx company in 2022 for $xx Million illustrates this trend.
- Market Concentration: Moderately concentrated, with top players holding xx% market share.
- Innovation Drivers: AI, IoT, cloud computing, and increased connectivity.
- Regulatory Framework: Supportive, with ongoing evolution to address privacy and security concerns.
- M&A Activity: Significant activity with deals valued in the hundreds of Millions of dollars annually. (e.g., acquisition of xx company by xx company for $xx Million in 2022)
Smart Home Market in the United States Market Dynamics & Trends
The US smart home market is experiencing robust growth, driven by several key factors. Increasing consumer awareness of the benefits of smart home technology, including enhanced convenience, energy efficiency, and security, is a major catalyst. Technological advancements, particularly in AI-powered voice assistants and improved connectivity solutions, continue to fuel market expansion. Consumer preferences are shifting toward integrated and seamless smart home ecosystems, creating demand for interoperable devices and platforms. Competitive dynamics are intense, with established players and new entrants vying for market share through product innovation, strategic partnerships, and aggressive marketing campaigns. The compound annual growth rate (CAGR) is projected to be xx% during the forecast period (2025-2033), with market penetration expected to reach xx% by 2033.
Dominant Regions & Segments in Smart Home Market in the United States
The US smart home market demonstrates strong growth across various regions, but specific areas with advanced infrastructure and higher disposable incomes exhibit greater market penetration. The segment analysis shows the following dominance:
Leading Segment: Comfort & Lighting holds the largest market share due to the high demand for smart lighting systems and climate control solutions.
Key Drivers:
- Comfort and Lighting: Increasing preference for energy-efficient lighting and climate control systems.
- Control and Connectivity: Growing demand for seamless integration of smart home devices and centralized control platforms.
- Energy Management: Rising energy costs and concerns about environmental sustainability.
- Home Entertainment: Increased adoption of streaming services and smart TVs.
- Security: Growing concerns about home security and safety.
- Smart Appliances: Convenience and increased efficiency offered by smart appliances.
Regional Dominance Analysis: Urban areas in states like California, New York, and Texas exhibit the highest adoption rates. This is driven by factors such as higher disposable income, greater tech-savviness, and more advanced infrastructure.
Smart Home Market in the United States Product Innovations
Recent product innovations reflect a trend toward enhanced interoperability, greater personalization, and integration with AI. Products such as Matter-compatible devices offer improved seamless connectivity across different brands and platforms. Smart appliances with advanced features like AI-powered cooking assistance and predictive maintenance are gaining traction. The emphasis on user-friendly interfaces and intuitive control systems is enhancing market accessibility and consumer satisfaction. The integration of enhanced security measures is also addressing growing consumer concerns around data privacy and cyber threats.
Report Scope & Segmentation Analysis
This report segments the US smart home market by product type: Comfort and Lighting (projected to reach $xx Million by 2033, driven by energy efficiency improvements); Control and Connectivity (projected to reach $xx Million by 2033, driven by increased interoperability); Energy Management (projected to reach $xx Million by 2033, driven by environmental concerns); Home Entertainment (projected to reach $xx Million by 2033, driven by streaming and smart TV adoption); Security (projected to reach $xx Million by 2033, driven by safety concerns); Smart Appliances (projected to reach $xx Million by 2033, driven by convenience and efficiency). Competitive dynamics vary across segments, with some experiencing greater consolidation than others.
Key Drivers of Smart Home Market in the United States Growth
Several factors are driving market growth. Technological advancements, such as improved connectivity standards (like Matter), AI-powered features, and enhanced user interfaces are key. Growing consumer awareness of smart home benefits, including increased convenience, energy efficiency, and security, fuels demand. Government initiatives and policies encouraging energy efficiency also stimulate market expansion. Finally, the rising disposable incomes and greater internet penetration among US households support higher adoption rates.
Challenges in the Smart Home Market in the United States Sector
Several challenges impede market growth. High initial costs of smart home installations can be a barrier for budget-conscious consumers. Concerns about data privacy and security remain a significant obstacle, requiring robust security protocols and transparent data handling practices. Interoperability issues among devices from different manufacturers continue to create a fragmented user experience. Supply chain disruptions and the increasing complexity of smart home ecosystems also pose significant challenges.
Emerging Opportunities in Smart Home Market in the United States
Emerging opportunities include the integration of smart home technology with other sectors like healthcare and elderly care, expanding the market's scope beyond home automation. The development of new smart home applications and services tailored to specific consumer needs and preferences will drive growth. Furthermore, advancements in AI and machine learning will create new possibilities for personalized home experiences, enhancing user satisfaction and driving adoption. Finally, the growing adoption of smart home technology in commercial and industrial settings will provide further expansion opportunities.
Leading Players in the Smart Home Market in the United States Market
- Whirlpool Corporation
- Honeywell International Inc
- Smart Home Inc
- Legrand SA
- Google Inc (Alphabet Inc)
- LG Electronics Inc
- Savant Systems Inc (GE Lighting)
- Emerson Electric Co
- Cisco Systems Inc
- Lutron Electronics Co Inc
- Siemens AG
- Microsoft Corporation
- Schneider Electric SE
- Control4 Corporation
- ABB Limited
- GE Appliances (Haier Group)
Key Developments in Smart Home Market in the United States Industry
- October 2022: Roku Inc. launched a new line of smart home products, expanding its ecosystem and offering affordable options. This move broadened market access and increased competition.
- October 2022: Google Nest introduced a redesigned app, a wired doorbell, and Nest Wifi Pro, enhancing its product offerings and improving user experience. These launches showcased advancements in product functionality and design.
- November 2022: The Matter standard's rollout and new WWA certifications improved interoperability and device reliability, paving the way for more innovation and choice in the smart home market.
Future Outlook for Smart Home Market in the United States Market
The future of the US smart home market is bright, with significant growth potential driven by technological advancements, increasing consumer adoption, and expanding applications. The market will witness continued innovation in areas such as AI-powered personalization, enhanced security features, and seamless integration across various devices and platforms. The focus on user experience, affordability, and addressing concerns around data privacy will be critical for driving further market expansion and achieving widespread adoption. Strategic partnerships and collaborations across the industry will play a significant role in shaping the future landscape of the smart home market.
Smart Home Market in the United States Segmentation
-
1. Product Type
- 1.1. Comfort and Lighting
- 1.2. Control and Connectivity
- 1.3. Energy Management
- 1.4. Home Entertainment
- 1.5. Security
- 1.6. Smart Appliances
Smart Home Market in the United States Segmentation By Geography
-
1. North America
- 1.1. United States
- 1.2. Canada
- 1.3. Mexico
-
2. South America
- 2.1. Brazil
- 2.2. Argentina
- 2.3. Rest of South America
-
3. Europe
- 3.1. United Kingdom
- 3.2. Germany
- 3.3. France
- 3.4. Italy
- 3.5. Spain
- 3.6. Russia
- 3.7. Benelux
- 3.8. Nordics
- 3.9. Rest of Europe
-
4. Middle East & Africa
- 4.1. Turkey
- 4.2. Israel
- 4.3. GCC
- 4.4. North Africa
- 4.5. South Africa
- 4.6. Rest of Middle East & Africa
-
5. Asia Pacific
- 5.1. China
- 5.2. India
- 5.3. Japan
- 5.4. South Korea
- 5.5. ASEAN
- 5.6. Oceania
- 5.7. Rest of Asia Pacific
Smart Home Market in the United States REPORT HIGHLIGHTS
| Aspects | Details |
|---|---|
| Study Period | 2019-2033 |
| Base Year | 2024 |
| Estimated Year | 2025 |
| Forecast Period | 2025-2033 |
| Historical Period | 2019-2024 |
| Growth Rate | CAGR of 9.12% from 2019-2033 |
| Segmentation |
|
Table of Contents
- 1. Introduction
- 1.1. Research Scope
- 1.2. Market Segmentation
- 1.3. Research Methodology
- 1.4. Definitions and Assumptions
- 2. Executive Summary
- 2.1. Introduction
- 3. Market Dynamics
- 3.1. Introduction
- 3.2. Market Drivers
- 3.2.1. Increasing Demand for Energy-efficient Solutions; Growing Need for Automation of Security Systems
- 3.3. Market Restrains
- 3.3.1 High Installation and Replacement Costs
- 3.3.2 along with Privacy Concerns
- 3.4. Market Trends
- 3.4.1. Smart Appliances Accounted for the Highest Market Share
- 4. Market Factor Analysis
- 4.1. Porters Five Forces
- 4.2. Supply/Value Chain
- 4.3. PESTEL analysis
- 4.4. Market Entropy
- 4.5. Patent/Trademark Analysis
- 5. Global Smart Home Market in the United States Analysis, Insights and Forecast, 2019-2031
- 5.1. Market Analysis, Insights and Forecast - by Product Type
- 5.1.1. Comfort and Lighting
- 5.1.2. Control and Connectivity
- 5.1.3. Energy Management
- 5.1.4. Home Entertainment
- 5.1.5. Security
- 5.1.6. Smart Appliances
- 5.2. Market Analysis, Insights and Forecast - by Region
- 5.2.1. North America
- 5.2.2. South America
- 5.2.3. Europe
- 5.2.4. Middle East & Africa
- 5.2.5. Asia Pacific
- 5.1. Market Analysis, Insights and Forecast - by Product Type
- 6. North America Smart Home Market in the United States Analysis, Insights and Forecast, 2019-2031
- 6.1. Market Analysis, Insights and Forecast - by Product Type
- 6.1.1. Comfort and Lighting
- 6.1.2. Control and Connectivity
- 6.1.3. Energy Management
- 6.1.4. Home Entertainment
- 6.1.5. Security
- 6.1.6. Smart Appliances
- 6.1. Market Analysis, Insights and Forecast - by Product Type
- 7. South America Smart Home Market in the United States Analysis, Insights and Forecast, 2019-2031
- 7.1. Market Analysis, Insights and Forecast - by Product Type
- 7.1.1. Comfort and Lighting
- 7.1.2. Control and Connectivity
- 7.1.3. Energy Management
- 7.1.4. Home Entertainment
- 7.1.5. Security
- 7.1.6. Smart Appliances
- 7.1. Market Analysis, Insights and Forecast - by Product Type
- 8. Europe Smart Home Market in the United States Analysis, Insights and Forecast, 2019-2031
- 8.1. Market Analysis, Insights and Forecast - by Product Type
- 8.1.1. Comfort and Lighting
- 8.1.2. Control and Connectivity
- 8.1.3. Energy Management
- 8.1.4. Home Entertainment
- 8.1.5. Security
- 8.1.6. Smart Appliances
- 8.1. Market Analysis, Insights and Forecast - by Product Type
- 9. Middle East & Africa Smart Home Market in the United States Analysis, Insights and Forecast, 2019-2031
- 9.1. Market Analysis, Insights and Forecast - by Product Type
- 9.1.1. Comfort and Lighting
- 9.1.2. Control and Connectivity
- 9.1.3. Energy Management
- 9.1.4. Home Entertainment
- 9.1.5. Security
- 9.1.6. Smart Appliances
- 9.1. Market Analysis, Insights and Forecast - by Product Type
- 10. Asia Pacific Smart Home Market in the United States Analysis, Insights and Forecast, 2019-2031
- 10.1. Market Analysis, Insights and Forecast - by Product Type
- 10.1.1. Comfort and Lighting
- 10.1.2. Control and Connectivity
- 10.1.3. Energy Management
- 10.1.4. Home Entertainment
- 10.1.5. Security
- 10.1.6. Smart Appliances
- 10.1. Market Analysis, Insights and Forecast - by Product Type
- 11. North America Smart Home Market in the United States Analysis, Insights and Forecast, 2019-2031
- 11.1. Market Analysis, Insights and Forecast - By Country/Sub-region
- 11.1.1. undefined
- 12. Europe Smart Home Market in the United States Analysis, Insights and Forecast, 2019-2031
- 12.1. Market Analysis, Insights and Forecast - By Country/Sub-region
- 12.1.1. undefined
- 13. Asia Pacific Smart Home Market in the United States Analysis, Insights and Forecast, 2019-2031
- 13.1. Market Analysis, Insights and Forecast - By Country/Sub-region
- 13.1.1. undefined
- 14. Rest of the World Smart Home Market in the United States Analysis, Insights and Forecast, 2019-2031
- 14.1. Market Analysis, Insights and Forecast - By Country/Sub-region
- 14.1.1. undefined
- 15. United States Smart Home Market in the United States Analysis, Insights and Forecast, 2019-2031
- 15.1. Market Analysis, Insights and Forecast - By Country/Sub-region
- 15.1.1. undefined
- 16. Competitive Analysis
- 16.1. Global Market Share Analysis 2024
- 16.2. Company Profiles
- 16.2.1 Whirlpool Corporation
- 16.2.1.1. Overview
- 16.2.1.2. Products
- 16.2.1.3. SWOT Analysis
- 16.2.1.4. Recent Developments
- 16.2.1.5. Financials (Based on Availability)
- 16.2.2 Honeywell International Inc
- 16.2.2.1. Overview
- 16.2.2.2. Products
- 16.2.2.3. SWOT Analysis
- 16.2.2.4. Recent Developments
- 16.2.2.5. Financials (Based on Availability)
- 16.2.3 Smart Home Inc
- 16.2.3.1. Overview
- 16.2.3.2. Products
- 16.2.3.3. SWOT Analysis
- 16.2.3.4. Recent Developments
- 16.2.3.5. Financials (Based on Availability)
- 16.2.4 Legrand SA
- 16.2.4.1. Overview
- 16.2.4.2. Products
- 16.2.4.3. SWOT Analysis
- 16.2.4.4. Recent Developments
- 16.2.4.5. Financials (Based on Availability)
- 16.2.5 Google Inc (Alphabet Inc )
- 16.2.5.1. Overview
- 16.2.5.2. Products
- 16.2.5.3. SWOT Analysis
- 16.2.5.4. Recent Developments
- 16.2.5.5. Financials (Based on Availability)
- 16.2.6 LG Electronics Inc
- 16.2.6.1. Overview
- 16.2.6.2. Products
- 16.2.6.3. SWOT Analysis
- 16.2.6.4. Recent Developments
- 16.2.6.5. Financials (Based on Availability)
- 16.2.7 Savant Systems Inc (GE Lighting)
- 16.2.7.1. Overview
- 16.2.7.2. Products
- 16.2.7.3. SWOT Analysis
- 16.2.7.4. Recent Developments
- 16.2.7.5. Financials (Based on Availability)
- 16.2.8 Emerson Electric Co
- 16.2.8.1. Overview
- 16.2.8.2. Products
- 16.2.8.3. SWOT Analysis
- 16.2.8.4. Recent Developments
- 16.2.8.5. Financials (Based on Availability)
- 16.2.9 Cisco Systems Inc
- 16.2.9.1. Overview
- 16.2.9.2. Products
- 16.2.9.3. SWOT Analysis
- 16.2.9.4. Recent Developments
- 16.2.9.5. Financials (Based on Availability)
- 16.2.10 Lutron Electronics Co Inc
- 16.2.10.1. Overview
- 16.2.10.2. Products
- 16.2.10.3. SWOT Analysis
- 16.2.10.4. Recent Developments
- 16.2.10.5. Financials (Based on Availability)
- 16.2.11 Siemens AG
- 16.2.11.1. Overview
- 16.2.11.2. Products
- 16.2.11.3. SWOT Analysis
- 16.2.11.4. Recent Developments
- 16.2.11.5. Financials (Based on Availability)
- 16.2.12 Microsoft Corporation
- 16.2.12.1. Overview
- 16.2.12.2. Products
- 16.2.12.3. SWOT Analysis
- 16.2.12.4. Recent Developments
- 16.2.12.5. Financials (Based on Availability)
- 16.2.13 Schneider Electric SE
- 16.2.13.1. Overview
- 16.2.13.2. Products
- 16.2.13.3. SWOT Analysis
- 16.2.13.4. Recent Developments
- 16.2.13.5. Financials (Based on Availability)
- 16.2.14 Control4 Corporation
- 16.2.14.1. Overview
- 16.2.14.2. Products
- 16.2.14.3. SWOT Analysis
- 16.2.14.4. Recent Developments
- 16.2.14.5. Financials (Based on Availability)
- 16.2.15 ABB Limited
- 16.2.15.1. Overview
- 16.2.15.2. Products
- 16.2.15.3. SWOT Analysis
- 16.2.15.4. Recent Developments
- 16.2.15.5. Financials (Based on Availability)
- 16.2.16 GE Appliances (Haier Group)
- 16.2.16.1. Overview
- 16.2.16.2. Products
- 16.2.16.3. SWOT Analysis
- 16.2.16.4. Recent Developments
- 16.2.16.5. Financials (Based on Availability)
- 16.2.1 Whirlpool Corporation
List of Figures
- Figure 1: Global Smart Home Market in the United States Revenue Breakdown (Million, %) by Region 2024 & 2032
- Figure 2: Global Smart Home Market in the United States Volume Breakdown (K Unit, %) by Region 2024 & 2032
- Figure 3: North America Smart Home Market in the United States Revenue (Million), by Country 2024 & 2032
- Figure 4: North America Smart Home Market in the United States Volume (K Unit), by Country 2024 & 2032
- Figure 5: North America Smart Home Market in the United States Revenue Share (%), by Country 2024 & 2032
- Figure 6: North America Smart Home Market in the United States Volume Share (%), by Country 2024 & 2032
- Figure 7: Europe Smart Home Market in the United States Revenue (Million), by Country 2024 & 2032
- Figure 8: Europe Smart Home Market in the United States Volume (K Unit), by Country 2024 & 2032
- Figure 9: Europe Smart Home Market in the United States Revenue Share (%), by Country 2024 & 2032
- Figure 10: Europe Smart Home Market in the United States Volume Share (%), by Country 2024 & 2032
- Figure 11: Asia Pacific Smart Home Market in the United States Revenue (Million), by Country 2024 & 2032
- Figure 12: Asia Pacific Smart Home Market in the United States Volume (K Unit), by Country 2024 & 2032
- Figure 13: Asia Pacific Smart Home Market in the United States Revenue Share (%), by Country 2024 & 2032
- Figure 14: Asia Pacific Smart Home Market in the United States Volume Share (%), by Country 2024 & 2032
- Figure 15: Rest of the World Smart Home Market in the United States Revenue (Million), by Country 2024 & 2032
- Figure 16: Rest of the World Smart Home Market in the United States Volume (K Unit), by Country 2024 & 2032
- Figure 17: Rest of the World Smart Home Market in the United States Revenue Share (%), by Country 2024 & 2032
- Figure 18: Rest of the World Smart Home Market in the United States Volume Share (%), by Country 2024 & 2032
- Figure 19: United States Smart Home Market in the United States Revenue (Million), by Country 2024 & 2032
- Figure 20: United States Smart Home Market in the United States Volume (K Unit), by Country 2024 & 2032
- Figure 21: United States Smart Home Market in the United States Revenue Share (%), by Country 2024 & 2032
- Figure 22: United States Smart Home Market in the United States Volume Share (%), by Country 2024 & 2032
- Figure 23: North America Smart Home Market in the United States Revenue (Million), by Product Type 2024 & 2032
- Figure 24: North America Smart Home Market in the United States Volume (K Unit), by Product Type 2024 & 2032
- Figure 25: North America Smart Home Market in the United States Revenue Share (%), by Product Type 2024 & 2032
- Figure 26: North America Smart Home Market in the United States Volume Share (%), by Product Type 2024 & 2032
- Figure 27: North America Smart Home Market in the United States Revenue (Million), by Country 2024 & 2032
- Figure 28: North America Smart Home Market in the United States Volume (K Unit), by Country 2024 & 2032
- Figure 29: North America Smart Home Market in the United States Revenue Share (%), by Country 2024 & 2032
- Figure 30: North America Smart Home Market in the United States Volume Share (%), by Country 2024 & 2032
- Figure 31: South America Smart Home Market in the United States Revenue (Million), by Product Type 2024 & 2032
- Figure 32: South America Smart Home Market in the United States Volume (K Unit), by Product Type 2024 & 2032
- Figure 33: South America Smart Home Market in the United States Revenue Share (%), by Product Type 2024 & 2032
- Figure 34: South America Smart Home Market in the United States Volume Share (%), by Product Type 2024 & 2032
- Figure 35: South America Smart Home Market in the United States Revenue (Million), by Country 2024 & 2032
- Figure 36: South America Smart Home Market in the United States Volume (K Unit), by Country 2024 & 2032
- Figure 37: South America Smart Home Market in the United States Revenue Share (%), by Country 2024 & 2032
- Figure 38: South America Smart Home Market in the United States Volume Share (%), by Country 2024 & 2032
- Figure 39: Europe Smart Home Market in the United States Revenue (Million), by Product Type 2024 & 2032
- Figure 40: Europe Smart Home Market in the United States Volume (K Unit), by Product Type 2024 & 2032
- Figure 41: Europe Smart Home Market in the United States Revenue Share (%), by Product Type 2024 & 2032
- Figure 42: Europe Smart Home Market in the United States Volume Share (%), by Product Type 2024 & 2032
- Figure 43: Europe Smart Home Market in the United States Revenue (Million), by Country 2024 & 2032
- Figure 44: Europe Smart Home Market in the United States Volume (K Unit), by Country 2024 & 2032
- Figure 45: Europe Smart Home Market in the United States Revenue Share (%), by Country 2024 & 2032
- Figure 46: Europe Smart Home Market in the United States Volume Share (%), by Country 2024 & 2032
- Figure 47: Middle East & Africa Smart Home Market in the United States Revenue (Million), by Product Type 2024 & 2032
- Figure 48: Middle East & Africa Smart Home Market in the United States Volume (K Unit), by Product Type 2024 & 2032
- Figure 49: Middle East & Africa Smart Home Market in the United States Revenue Share (%), by Product Type 2024 & 2032
- Figure 50: Middle East & Africa Smart Home Market in the United States Volume Share (%), by Product Type 2024 & 2032
- Figure 51: Middle East & Africa Smart Home Market in the United States Revenue (Million), by Country 2024 & 2032
- Figure 52: Middle East & Africa Smart Home Market in the United States Volume (K Unit), by Country 2024 & 2032
- Figure 53: Middle East & Africa Smart Home Market in the United States Revenue Share (%), by Country 2024 & 2032
- Figure 54: Middle East & Africa Smart Home Market in the United States Volume Share (%), by Country 2024 & 2032
- Figure 55: Asia Pacific Smart Home Market in the United States Revenue (Million), by Product Type 2024 & 2032
- Figure 56: Asia Pacific Smart Home Market in the United States Volume (K Unit), by Product Type 2024 & 2032
- Figure 57: Asia Pacific Smart Home Market in the United States Revenue Share (%), by Product Type 2024 & 2032
- Figure 58: Asia Pacific Smart Home Market in the United States Volume Share (%), by Product Type 2024 & 2032
- Figure 59: Asia Pacific Smart Home Market in the United States Revenue (Million), by Country 2024 & 2032
- Figure 60: Asia Pacific Smart Home Market in the United States Volume (K Unit), by Country 2024 & 2032
- Figure 61: Asia Pacific Smart Home Market in the United States Revenue Share (%), by Country 2024 & 2032
- Figure 62: Asia Pacific Smart Home Market in the United States Volume Share (%), by Country 2024 & 2032
List of Tables
- Table 1: Global Smart Home Market in the United States Revenue Million Forecast, by Region 2019 & 2032
- Table 2: Global Smart Home Market in the United States Volume K Unit Forecast, by Region 2019 & 2032
- Table 3: Global Smart Home Market in the United States Revenue Million Forecast, by Product Type 2019 & 2032
- Table 4: Global Smart Home Market in the United States Volume K Unit Forecast, by Product Type 2019 & 2032
- Table 5: Global Smart Home Market in the United States Revenue Million Forecast, by Region 2019 & 2032
- Table 6: Global Smart Home Market in the United States Volume K Unit Forecast, by Region 2019 & 2032
- Table 7: Global Smart Home Market in the United States Revenue Million Forecast, by Country 2019 & 2032
- Table 8: Global Smart Home Market in the United States Volume K Unit Forecast, by Country 2019 & 2032
- Table 9: Global Smart Home Market in the United States Revenue Million Forecast, by Country 2019 & 2032
- Table 10: Global Smart Home Market in the United States Volume K Unit Forecast, by Country 2019 & 2032
- Table 11: Global Smart Home Market in the United States Revenue Million Forecast, by Country 2019 & 2032
- Table 12: Global Smart Home Market in the United States Volume K Unit Forecast, by Country 2019 & 2032
- Table 13: Global Smart Home Market in the United States Revenue Million Forecast, by Country 2019 & 2032
- Table 14: Global Smart Home Market in the United States Volume K Unit Forecast, by Country 2019 & 2032
- Table 15: Global Smart Home Market in the United States Revenue Million Forecast, by Country 2019 & 2032
- Table 16: Global Smart Home Market in the United States Volume K Unit Forecast, by Country 2019 & 2032
- Table 17: Global Smart Home Market in the United States Revenue Million Forecast, by Product Type 2019 & 2032
- Table 18: Global Smart Home Market in the United States Volume K Unit Forecast, by Product Type 2019 & 2032
- Table 19: Global Smart Home Market in the United States Revenue Million Forecast, by Country 2019 & 2032
- Table 20: Global Smart Home Market in the United States Volume K Unit Forecast, by Country 2019 & 2032
- Table 21: United States Smart Home Market in the United States Revenue (Million) Forecast, by Application 2019 & 2032
- Table 22: United States Smart Home Market in the United States Volume (K Unit) Forecast, by Application 2019 & 2032
- Table 23: Canada Smart Home Market in the United States Revenue (Million) Forecast, by Application 2019 & 2032
- Table 24: Canada Smart Home Market in the United States Volume (K Unit) Forecast, by Application 2019 & 2032
- Table 25: Mexico Smart Home Market in the United States Revenue (Million) Forecast, by Application 2019 & 2032
- Table 26: Mexico Smart Home Market in the United States Volume (K Unit) Forecast, by Application 2019 & 2032
- Table 27: Global Smart Home Market in the United States Revenue Million Forecast, by Product Type 2019 & 2032
- Table 28: Global Smart Home Market in the United States Volume K Unit Forecast, by Product Type 2019 & 2032
- Table 29: Global Smart Home Market in the United States Revenue Million Forecast, by Country 2019 & 2032
- Table 30: Global Smart Home Market in the United States Volume K Unit Forecast, by Country 2019 & 2032
- Table 31: Brazil Smart Home Market in the United States Revenue (Million) Forecast, by Application 2019 & 2032
- Table 32: Brazil Smart Home Market in the United States Volume (K Unit) Forecast, by Application 2019 & 2032
- Table 33: Argentina Smart Home Market in the United States Revenue (Million) Forecast, by Application 2019 & 2032
- Table 34: Argentina Smart Home Market in the United States Volume (K Unit) Forecast, by Application 2019 & 2032
- Table 35: Rest of South America Smart Home Market in the United States Revenue (Million) Forecast, by Application 2019 & 2032
- Table 36: Rest of South America Smart Home Market in the United States Volume (K Unit) Forecast, by Application 2019 & 2032
- Table 37: Global Smart Home Market in the United States Revenue Million Forecast, by Product Type 2019 & 2032
- Table 38: Global Smart Home Market in the United States Volume K Unit Forecast, by Product Type 2019 & 2032
- Table 39: Global Smart Home Market in the United States Revenue Million Forecast, by Country 2019 & 2032
- Table 40: Global Smart Home Market in the United States Volume K Unit Forecast, by Country 2019 & 2032
- Table 41: United Kingdom Smart Home Market in the United States Revenue (Million) Forecast, by Application 2019 & 2032
- Table 42: United Kingdom Smart Home Market in the United States Volume (K Unit) Forecast, by Application 2019 & 2032
- Table 43: Germany Smart Home Market in the United States Revenue (Million) Forecast, by Application 2019 & 2032
- Table 44: Germany Smart Home Market in the United States Volume (K Unit) Forecast, by Application 2019 & 2032
- Table 45: France Smart Home Market in the United States Revenue (Million) Forecast, by Application 2019 & 2032
- Table 46: France Smart Home Market in the United States Volume (K Unit) Forecast, by Application 2019 & 2032
- Table 47: Italy Smart Home Market in the United States Revenue (Million) Forecast, by Application 2019 & 2032
- Table 48: Italy Smart Home Market in the United States Volume (K Unit) Forecast, by Application 2019 & 2032
- Table 49: Spain Smart Home Market in the United States Revenue (Million) Forecast, by Application 2019 & 2032
- Table 50: Spain Smart Home Market in the United States Volume (K Unit) Forecast, by Application 2019 & 2032
- Table 51: Russia Smart Home Market in the United States Revenue (Million) Forecast, by Application 2019 & 2032
- Table 52: Russia Smart Home Market in the United States Volume (K Unit) Forecast, by Application 2019 & 2032
- Table 53: Benelux Smart Home Market in the United States Revenue (Million) Forecast, by Application 2019 & 2032
- Table 54: Benelux Smart Home Market in the United States Volume (K Unit) Forecast, by Application 2019 & 2032
- Table 55: Nordics Smart Home Market in the United States Revenue (Million) Forecast, by Application 2019 & 2032
- Table 56: Nordics Smart Home Market in the United States Volume (K Unit) Forecast, by Application 2019 & 2032
- Table 57: Rest of Europe Smart Home Market in the United States Revenue (Million) Forecast, by Application 2019 & 2032
- Table 58: Rest of Europe Smart Home Market in the United States Volume (K Unit) Forecast, by Application 2019 & 2032
- Table 59: Global Smart Home Market in the United States Revenue Million Forecast, by Product Type 2019 & 2032
- Table 60: Global Smart Home Market in the United States Volume K Unit Forecast, by Product Type 2019 & 2032
- Table 61: Global Smart Home Market in the United States Revenue Million Forecast, by Country 2019 & 2032
- Table 62: Global Smart Home Market in the United States Volume K Unit Forecast, by Country 2019 & 2032
- Table 63: Turkey Smart Home Market in the United States Revenue (Million) Forecast, by Application 2019 & 2032
- Table 64: Turkey Smart Home Market in the United States Volume (K Unit) Forecast, by Application 2019 & 2032
- Table 65: Israel Smart Home Market in the United States Revenue (Million) Forecast, by Application 2019 & 2032
- Table 66: Israel Smart Home Market in the United States Volume (K Unit) Forecast, by Application 2019 & 2032
- Table 67: GCC Smart Home Market in the United States Revenue (Million) Forecast, by Application 2019 & 2032
- Table 68: GCC Smart Home Market in the United States Volume (K Unit) Forecast, by Application 2019 & 2032
- Table 69: North Africa Smart Home Market in the United States Revenue (Million) Forecast, by Application 2019 & 2032
- Table 70: North Africa Smart Home Market in the United States Volume (K Unit) Forecast, by Application 2019 & 2032
- Table 71: South Africa Smart Home Market in the United States Revenue (Million) Forecast, by Application 2019 & 2032
- Table 72: South Africa Smart Home Market in the United States Volume (K Unit) Forecast, by Application 2019 & 2032
- Table 73: Rest of Middle East & Africa Smart Home Market in the United States Revenue (Million) Forecast, by Application 2019 & 2032
- Table 74: Rest of Middle East & Africa Smart Home Market in the United States Volume (K Unit) Forecast, by Application 2019 & 2032
- Table 75: Global Smart Home Market in the United States Revenue Million Forecast, by Product Type 2019 & 2032
- Table 76: Global Smart Home Market in the United States Volume K Unit Forecast, by Product Type 2019 & 2032
- Table 77: Global Smart Home Market in the United States Revenue Million Forecast, by Country 2019 & 2032
- Table 78: Global Smart Home Market in the United States Volume K Unit Forecast, by Country 2019 & 2032
- Table 79: China Smart Home Market in the United States Revenue (Million) Forecast, by Application 2019 & 2032
- Table 80: China Smart Home Market in the United States Volume (K Unit) Forecast, by Application 2019 & 2032
- Table 81: India Smart Home Market in the United States Revenue (Million) Forecast, by Application 2019 & 2032
- Table 82: India Smart Home Market in the United States Volume (K Unit) Forecast, by Application 2019 & 2032
- Table 83: Japan Smart Home Market in the United States Revenue (Million) Forecast, by Application 2019 & 2032
- Table 84: Japan Smart Home Market in the United States Volume (K Unit) Forecast, by Application 2019 & 2032
- Table 85: South Korea Smart Home Market in the United States Revenue (Million) Forecast, by Application 2019 & 2032
- Table 86: South Korea Smart Home Market in the United States Volume (K Unit) Forecast, by Application 2019 & 2032
- Table 87: ASEAN Smart Home Market in the United States Revenue (Million) Forecast, by Application 2019 & 2032
- Table 88: ASEAN Smart Home Market in the United States Volume (K Unit) Forecast, by Application 2019 & 2032
- Table 89: Oceania Smart Home Market in the United States Revenue (Million) Forecast, by Application 2019 & 2032
- Table 90: Oceania Smart Home Market in the United States Volume (K Unit) Forecast, by Application 2019 & 2032
- Table 91: Rest of Asia Pacific Smart Home Market in the United States Revenue (Million) Forecast, by Application 2019 & 2032
- Table 92: Rest of Asia Pacific Smart Home Market in the United States Volume (K Unit) Forecast, by Application 2019 & 2032
Frequently Asked Questions
1. What is the projected Compound Annual Growth Rate (CAGR) of the Smart Home Market in the United States?
The projected CAGR is approximately 9.12%.
2. Which companies are prominent players in the Smart Home Market in the United States?
Key companies in the market include Whirlpool Corporation, Honeywell International Inc, Smart Home Inc, Legrand SA, Google Inc (Alphabet Inc ), LG Electronics Inc, Savant Systems Inc (GE Lighting), Emerson Electric Co, Cisco Systems Inc, Lutron Electronics Co Inc, Siemens AG, Microsoft Corporation, Schneider Electric SE, Control4 Corporation, ABB Limited, GE Appliances (Haier Group).
3. What are the main segments of the Smart Home Market in the United States?
The market segments include Product Type.
4. Can you provide details about the market size?
The market size is estimated to be USD 40.40 Million as of 2022.
5. What are some drivers contributing to market growth?
Increasing Demand for Energy-efficient Solutions; Growing Need for Automation of Security Systems.
6. What are the notable trends driving market growth?
Smart Appliances Accounted for the Highest Market Share.
7. Are there any restraints impacting market growth?
High Installation and Replacement Costs. along with Privacy Concerns.
8. Can you provide examples of recent developments in the market?
November 2022: Various products and smart home systems can collaborate according to the Matter standard, which Amazon had stated plans to scale out. New WWA certification standards for Matter devices were introduced by Amazon this year. As they increase the dependability and functionality of linked devices, they will also enable innovation and choice.
9. What pricing options are available for accessing the report?
Pricing options include single-user, multi-user, and enterprise licenses priced at USD 3800, USD 4500, and USD 5800 respectively.
10. Is the market size provided in terms of value or volume?
The market size is provided in terms of value, measured in Million and volume, measured in K Unit.
11. Are there any specific market keywords associated with the report?
Yes, the market keyword associated with the report is "Smart Home Market in the United States," which aids in identifying and referencing the specific market segment covered.
12. How do I determine which pricing option suits my needs best?
The pricing options vary based on user requirements and access needs. Individual users may opt for single-user licenses, while businesses requiring broader access may choose multi-user or enterprise licenses for cost-effective access to the report.
13. Are there any additional resources or data provided in the Smart Home Market in the United States report?
While the report offers comprehensive insights, it's advisable to review the specific contents or supplementary materials provided to ascertain if additional resources or data are available.
14. How can I stay updated on further developments or reports in the Smart Home Market in the United States?
To stay informed about further developments, trends, and reports in the Smart Home Market in the United States, consider subscribing to industry newsletters, following relevant companies and organizations, or regularly checking reputable industry news sources and publications.
Methodology
Step 1 - Identification of Relevant Samples Size from Population Database


Step 2 - Approaches for Defining Global Market Size (Value, Volume* & Price*)

Note*: In applicable scenarios
Step 3 - Data Sources
Primary Research
- Web Analytics
- Survey Reports
- Research Institute
- Latest Research Reports
- Opinion Leaders
Secondary Research
- Annual Reports
- White Paper
- Latest Press Release
- Industry Association
- Paid Database
- Investor Presentations

Step 4 - Data Triangulation
Involves using different sources of information in order to increase the validity of a study
These sources are likely to be stakeholders in a program - participants, other researchers, program staff, other community members, and so on.
Then we put all data in single framework & apply various statistical tools to find out the dynamic on the market.
During the analysis stage, feedback from the stakeholder groups would be compared to determine areas of agreement as well as areas of divergence


