
Key Insights
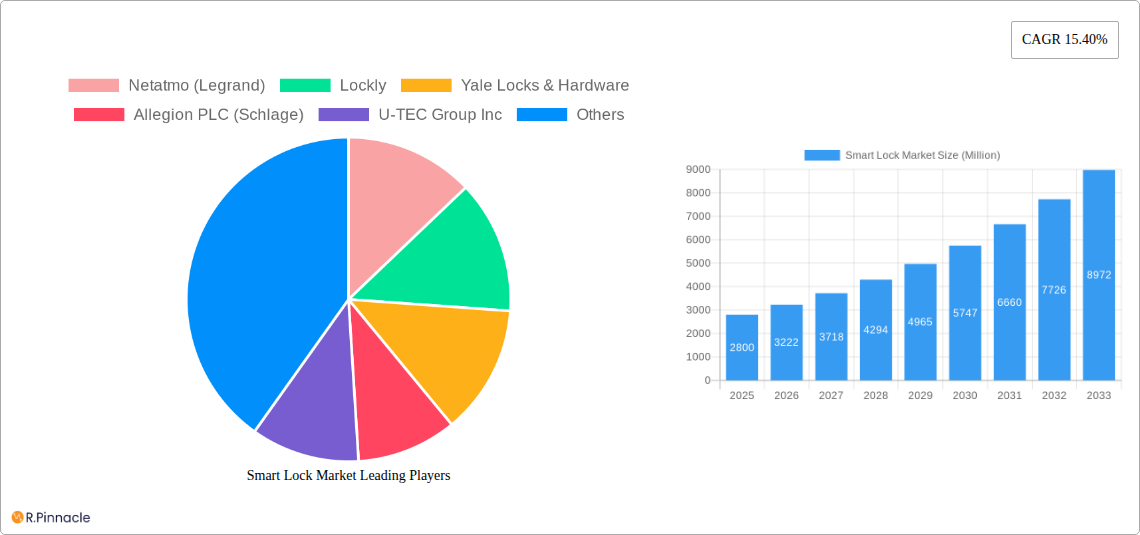
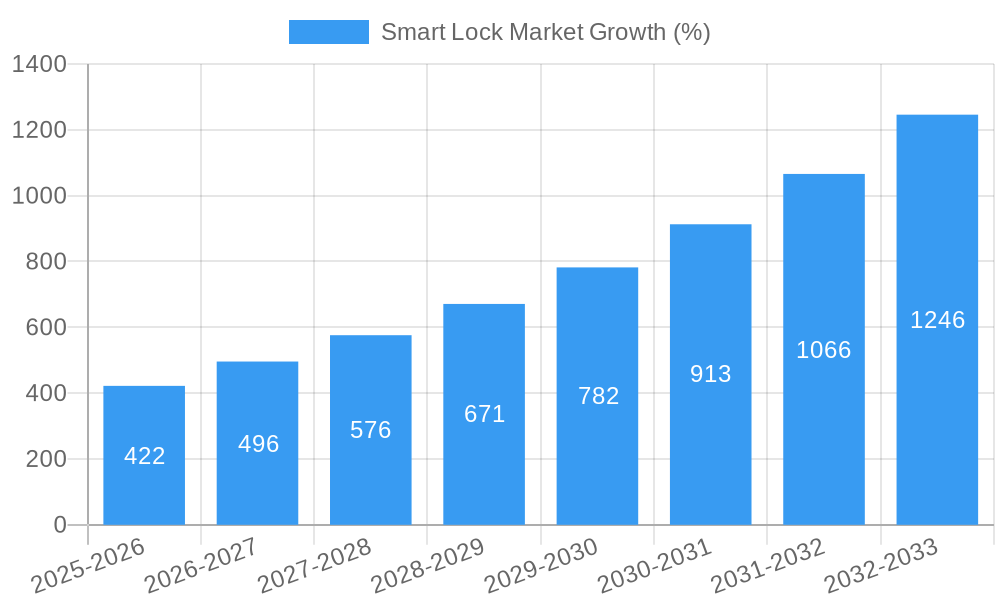
The global smart lock market is experiencing robust growth, projected to reach \$2.80 billion in 2025 and exhibiting a Compound Annual Growth Rate (CAGR) of 15.40% from 2025 to 2033. This expansion is driven by several key factors. Increasing concerns about home security are leading to greater adoption of smart locks offering enhanced protection and remote access capabilities. The rising prevalence of smartphones and the increasing integration of smart home ecosystems further fuel market demand, as smart locks seamlessly integrate with other connected devices. Furthermore, advancements in communication technologies, such as Wi-Fi, Bluetooth, and Zigbee, are enabling more reliable and convenient lock operation, while the diversification of authentication methods – including biometric, PIN code, and RFID card options – caters to a broader range of user preferences and security needs. The commercial sector, including businesses and hotels, is a significant driver, embracing smart locks for improved access control and enhanced security management. Educational institutions and government entities are also increasingly adopting smart locks for streamlined access and enhanced security protocols.
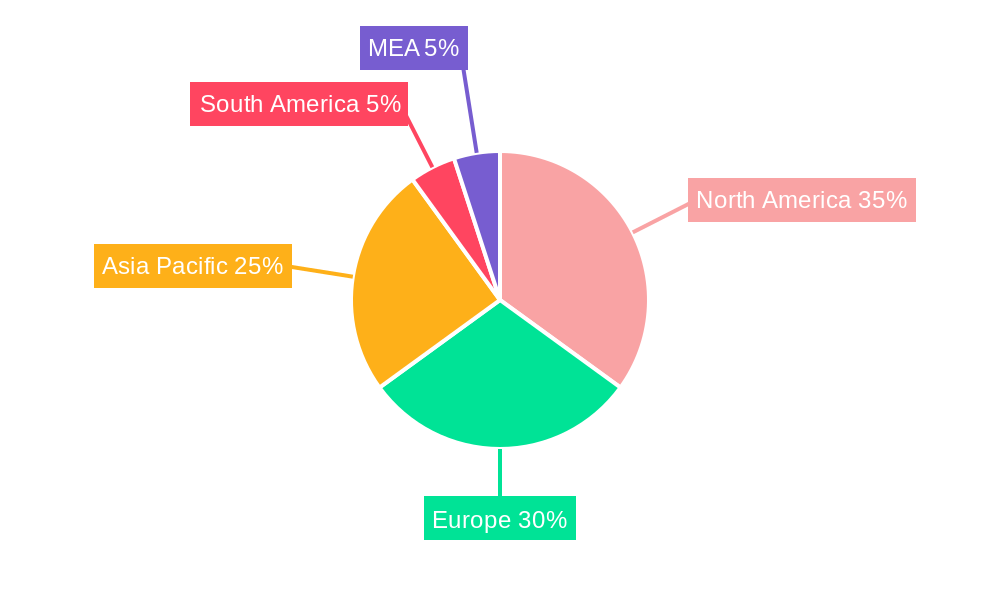
The market segmentation reveals distinct growth trajectories. Biometric authentication is anticipated to witness faster growth compared to traditional methods due to its enhanced security features and user convenience. The commercial and industrial segments are projected to dominate market share due to higher adoption rates driven by cost-effectiveness and enhanced security needs. Geographically, North America and Europe currently hold substantial market share owing to high technological adoption rates and robust infrastructure. However, Asia-Pacific is poised for rapid expansion, fueled by rising disposable incomes and urbanization driving increasing demand for improved home and business security solutions. While challenges such as high initial investment costs and concerns about cybersecurity vulnerabilities exist, ongoing technological advancements and the growing awareness of security benefits are mitigating these concerns, ensuring continued market expansion.
Smart Lock Market Report: 2019-2033 Forecast
This comprehensive report provides a detailed analysis of the global smart lock market, covering market structure, innovation trends, dynamics, regional segmentation, product innovations, and future outlook. The study period spans from 2019 to 2033, with a base year of 2025 and a forecast period from 2025 to 2033. The report leverages data from the historical period (2019-2024) to provide actionable insights for industry professionals. The market is valued at xx Million in 2025 and is projected to reach xx Million by 2033, exhibiting a CAGR of xx%.
Smart Lock Market Structure & Innovation Trends
The smart lock market exhibits a moderately concentrated structure, with key players like Netatmo (Legrand), Lockly, Yale Locks & Hardware, Allegion PLC (Schlage), U-TEC Group Inc, Hanman International Pte Ltd, Nuki Home Solutions, Kwikset (Spectrum Brands Inc), Salto Systems SL, Dormakaba Group, August Inc, and Master Lock Company LLC holding significant market share. Market share fluctuates based on innovation, marketing, and strategic partnerships. Recent M&A activity has been moderate, with deal values ranging from xx Million to xx Million, primarily focused on expanding product portfolios and geographical reach. Innovation drivers include advancements in communication technologies (Wi-Fi, Bluetooth, Zigbee, Z-Wave), authentication methods (biometric, pin code, RFID cards), and enhanced security features. Stringent regulatory frameworks concerning data privacy and security significantly impact market growth. Product substitutes, such as traditional mechanical locks, pose a challenge, but the increasing demand for convenience and enhanced security drives market adoption. The end-user demographics are diverse, encompassing residential, commercial, educational, governmental, and industrial sectors.
Smart Lock Market Dynamics & Trends
The smart lock market is experiencing robust growth, driven by several factors. The increasing adoption of smart home technologies, coupled with rising security concerns, fuels market expansion. Technological disruptions, such as the integration of AI and IoT, enhance smart lock functionalities, providing users with greater convenience and control. Consumer preferences are shifting towards seamless integration with existing smart home ecosystems, influencing product development. The competitive landscape is dynamic, with companies focusing on product differentiation, strategic partnerships, and technological advancements. Market penetration is growing rapidly in developed regions, while emerging economies offer significant untapped potential. The market is expected to witness a CAGR of xx% during the forecast period, reaching a market value of xx Million by 2033.
Dominant Regions & Segments in Smart Lock Market
Leading Region: North America currently dominates the smart lock market due to high technology adoption rates, a well-established smart home ecosystem, and robust consumer spending. Europe follows closely, showcasing significant market potential.
Communication Technology: Wi-Fi holds the largest market share among communication technologies due to its wide range and reliability. Bluetooth enjoys strong popularity for its ease of use and short-range applications.
Authentication Method: Biometric authentication is gaining traction due to its enhanced security and convenience. Pin code remains a dominant method due to its simplicity.
End-user Application: The commercial sector leads the end-user application segment, driven by high security needs and increasing automation in offices and businesses. The educational and governmental sectors are showing steady growth due to enhanced security and access control requirements.
Key Drivers: Strong economic growth in developed countries, supportive government policies promoting smart city initiatives, and the increasing deployment of advanced security infrastructure in both residential and commercial settings are contributing to market dominance in these regions and segments.
Smart Lock Market Product Innovations
Recent product innovations focus on enhanced security features, seamless integration with smart home ecosystems, and improved user experience. Wireless charging capabilities, as seen with Alfred International Inc.’s ML2 smart mortise locks, address range and battery life limitations. The introduction of Apple Home Keys technology in Level Home Inc.’s Level Lock+ showcases the increasing integration of smart locks with existing mobile platforms, enhancing both security and usability. This trend reflects a broader market shift towards user-friendly interfaces and robust security protocols.
Report Scope & Segmentation Analysis
The report provides a detailed analysis of the smart lock market across various segments, including communication technology (Wi-Fi, Bluetooth, Zigbee, Z-Wave), authentication method (biometric, pin code, RFID cards), and end-user application (commercial, educational institutions & government, industrial). Each segment's growth projections, market sizes, and competitive dynamics are meticulously analyzed, providing a holistic view of the market landscape. The report provides granular insights into the various market drivers and restraints affecting the various segments, their growth, and competitiveness. Each segment displays unique growth trajectories based on specific technological advancements, adoption rates, and regional variations.
Key Drivers of Smart Lock Market Growth
Several factors fuel the growth of the smart lock market. These include the rising adoption of smart home devices, increasing security concerns in residential and commercial spaces, advancements in communication technologies enabling seamless connectivity and remote access, and government initiatives promoting smart city development and improved security infrastructure. The increasing affordability of smart locks is also contributing to wider market adoption across various sectors.
Challenges in the Smart Lock Market Sector
Challenges include high initial costs compared to traditional locks, concerns about data privacy and security breaches, potential vulnerabilities to hacking, and the complexity of integrating smart locks into existing security systems. Supply chain disruptions and the potential for standardization issues across different smart home ecosystems also pose hurdles to market growth. These factors can hinder wider market penetration and affect overall market expansion.
Emerging Opportunities in Smart Lock Market
Emerging opportunities lie in the integration of advanced technologies such as AI and machine learning for enhanced security features, the expansion into developing markets with growing urbanization and rising disposable incomes, and the development of innovative applications in diverse sectors like healthcare and logistics. The growing popularity of smart home assistants and voice control integration also presents significant opportunities for smart lock manufacturers.
Leading Players in the Smart Lock Market Market
- Netatmo (Legrand)
- Lockly
- Yale Locks & Hardware
- Allegion PLC (Schlage)
- U-TEC Group Inc
- Hanman International Pte Ltd
- Nuki Home Solutions
- Kwikset (Spectrum Brands Inc)
- Salto Systems SL
- Dormakaba Group
- August Inc
- Master Lock Company LLC
Key Developments in Smart Lock Market Industry
September 2022: Alfred International Inc. and Wi-Charge launch the first over-the-air remotely charged smart locks, setting a new benchmark for convenience and security in commercial real estate.
October 2022: Level Home Inc. unveils Level Lock+, integrating Apple Home Keys technology, enhancing security and ease of use for Apple device users.
Future Outlook for Smart Lock Market Market
The smart lock market is poised for continued growth, driven by technological advancements, increasing security concerns, and the expansion of smart home ecosystems. Strategic partnerships, product innovation, and expansion into new markets will be key to success for companies in this sector. The market's future potential is significant, with substantial opportunities for growth in both developed and developing economies.
Smart Lock Market Segmentation
-
1. Communication Technology
- 1.1. Wi-Fi
- 1.2. Bluetooth
- 1.3. Zigbee
- 1.4. Z-Wave
-
2. Authentication Method
- 2.1. Biometric
- 2.2. Pin Code
- 2.3. RFID Cards
-
3. End-user Application
- 3.1. Commercial
- 3.2. Educational Institutions & Government
- 3.3. Industrial
Smart Lock Market Segmentation By Geography
- 1. Europe
- 2. Asia Pacific
- 3. North America
- 4. Rest of the World
Smart Lock Market REPORT HIGHLIGHTS
| Aspects | Details |
|---|---|
| Study Period | 2019-2033 |
| Base Year | 2024 |
| Estimated Year | 2025 |
| Forecast Period | 2025-2033 |
| Historical Period | 2019-2024 |
| Growth Rate | CAGR of 15.40% from 2019-2033 |
| Segmentation |
|
Table of Contents
- 1. Introduction
- 1.1. Research Scope
- 1.2. Market Segmentation
- 1.3. Research Methodology
- 1.4. Definitions and Assumptions
- 2. Executive Summary
- 2.1. Introduction
- 3. Market Dynamics
- 3.1. Introduction
- 3.2. Market Drivers
- 3.2.1. Increasing Safety and Security Concerns; Increasing Adoption of Smart Home Architecture
- 3.3. Market Restrains
- 3.3.1. High cost involved in replacing the existing Deep UV with EUV lasers; Monopoly existing within the market
- 3.4. Market Trends
- 3.4.1. Commercial Adoption is Expected to Grow Significantly
- 4. Market Factor Analysis
- 4.1. Porters Five Forces
- 4.2. Supply/Value Chain
- 4.3. PESTEL analysis
- 4.4. Market Entropy
- 4.5. Patent/Trademark Analysis
- 5. Global Smart Lock Market Analysis, Insights and Forecast, 2019-2031
- 5.1. Market Analysis, Insights and Forecast - by Communication Technology
- 5.1.1. Wi-Fi
- 5.1.2. Bluetooth
- 5.1.3. Zigbee
- 5.1.4. Z-Wave
- 5.2. Market Analysis, Insights and Forecast - by Authentication Method
- 5.2.1. Biometric
- 5.2.2. Pin Code
- 5.2.3. RFID Cards
- 5.3. Market Analysis, Insights and Forecast - by End-user Application
- 5.3.1. Commercial
- 5.3.2. Educational Institutions & Government
- 5.3.3. Industrial
- 5.4. Market Analysis, Insights and Forecast - by Region
- 5.4.1. Europe
- 5.4.2. Asia Pacific
- 5.4.3. North America
- 5.4.4. Rest of the World
- 5.1. Market Analysis, Insights and Forecast - by Communication Technology
- 6. Europe Smart Lock Market Analysis, Insights and Forecast, 2019-2031
- 6.1. Market Analysis, Insights and Forecast - by Communication Technology
- 6.1.1. Wi-Fi
- 6.1.2. Bluetooth
- 6.1.3. Zigbee
- 6.1.4. Z-Wave
- 6.2. Market Analysis, Insights and Forecast - by Authentication Method
- 6.2.1. Biometric
- 6.2.2. Pin Code
- 6.2.3. RFID Cards
- 6.3. Market Analysis, Insights and Forecast - by End-user Application
- 6.3.1. Commercial
- 6.3.2. Educational Institutions & Government
- 6.3.3. Industrial
- 6.1. Market Analysis, Insights and Forecast - by Communication Technology
- 7. Asia Pacific Smart Lock Market Analysis, Insights and Forecast, 2019-2031
- 7.1. Market Analysis, Insights and Forecast - by Communication Technology
- 7.1.1. Wi-Fi
- 7.1.2. Bluetooth
- 7.1.3. Zigbee
- 7.1.4. Z-Wave
- 7.2. Market Analysis, Insights and Forecast - by Authentication Method
- 7.2.1. Biometric
- 7.2.2. Pin Code
- 7.2.3. RFID Cards
- 7.3. Market Analysis, Insights and Forecast - by End-user Application
- 7.3.1. Commercial
- 7.3.2. Educational Institutions & Government
- 7.3.3. Industrial
- 7.1. Market Analysis, Insights and Forecast - by Communication Technology
- 8. North America Smart Lock Market Analysis, Insights and Forecast, 2019-2031
- 8.1. Market Analysis, Insights and Forecast - by Communication Technology
- 8.1.1. Wi-Fi
- 8.1.2. Bluetooth
- 8.1.3. Zigbee
- 8.1.4. Z-Wave
- 8.2. Market Analysis, Insights and Forecast - by Authentication Method
- 8.2.1. Biometric
- 8.2.2. Pin Code
- 8.2.3. RFID Cards
- 8.3. Market Analysis, Insights and Forecast - by End-user Application
- 8.3.1. Commercial
- 8.3.2. Educational Institutions & Government
- 8.3.3. Industrial
- 8.1. Market Analysis, Insights and Forecast - by Communication Technology
- 9. Rest of the World Smart Lock Market Analysis, Insights and Forecast, 2019-2031
- 9.1. Market Analysis, Insights and Forecast - by Communication Technology
- 9.1.1. Wi-Fi
- 9.1.2. Bluetooth
- 9.1.3. Zigbee
- 9.1.4. Z-Wave
- 9.2. Market Analysis, Insights and Forecast - by Authentication Method
- 9.2.1. Biometric
- 9.2.2. Pin Code
- 9.2.3. RFID Cards
- 9.3. Market Analysis, Insights and Forecast - by End-user Application
- 9.3.1. Commercial
- 9.3.2. Educational Institutions & Government
- 9.3.3. Industrial
- 9.1. Market Analysis, Insights and Forecast - by Communication Technology
- 10. North America Smart Lock Market Analysis, Insights and Forecast, 2019-2031
- 10.1. Market Analysis, Insights and Forecast - By Country/Sub-region
- 10.1.1 United States
- 10.1.2 Canada
- 10.1.3 Mexico
- 11. Europe Smart Lock Market Analysis, Insights and Forecast, 2019-2031
- 11.1. Market Analysis, Insights and Forecast - By Country/Sub-region
- 11.1.1 Germany
- 11.1.2 United Kingdom
- 11.1.3 France
- 11.1.4 Spain
- 11.1.5 Italy
- 11.1.6 Spain
- 11.1.7 Belgium
- 11.1.8 Netherland
- 11.1.9 Nordics
- 11.1.10 Rest of Europe
- 12. Asia Pacific Smart Lock Market Analysis, Insights and Forecast, 2019-2031
- 12.1. Market Analysis, Insights and Forecast - By Country/Sub-region
- 12.1.1 China
- 12.1.2 Japan
- 12.1.3 India
- 12.1.4 South Korea
- 12.1.5 Southeast Asia
- 12.1.6 Australia
- 12.1.7 Indonesia
- 12.1.8 Phillipes
- 12.1.9 Singapore
- 12.1.10 Thailandc
- 12.1.11 Rest of Asia Pacific
- 13. South America Smart Lock Market Analysis, Insights and Forecast, 2019-2031
- 13.1. Market Analysis, Insights and Forecast - By Country/Sub-region
- 13.1.1 Brazil
- 13.1.2 Argentina
- 13.1.3 Peru
- 13.1.4 Chile
- 13.1.5 Colombia
- 13.1.6 Ecuador
- 13.1.7 Venezuela
- 13.1.8 Rest of South America
- 14. North America Smart Lock Market Analysis, Insights and Forecast, 2019-2031
- 14.1. Market Analysis, Insights and Forecast - By Country/Sub-region
- 14.1.1 United States
- 14.1.2 Canada
- 14.1.3 Mexico
- 15. MEA Smart Lock Market Analysis, Insights and Forecast, 2019-2031
- 15.1. Market Analysis, Insights and Forecast - By Country/Sub-region
- 15.1.1 United Arab Emirates
- 15.1.2 Saudi Arabia
- 15.1.3 South Africa
- 15.1.4 Rest of Middle East and Africa
- 16. Competitive Analysis
- 16.1. Global Market Share Analysis 2024
- 16.2. Company Profiles
- 16.2.1 Netatmo (Legrand)
- 16.2.1.1. Overview
- 16.2.1.2. Products
- 16.2.1.3. SWOT Analysis
- 16.2.1.4. Recent Developments
- 16.2.1.5. Financials (Based on Availability)
- 16.2.2 Lockly
- 16.2.2.1. Overview
- 16.2.2.2. Products
- 16.2.2.3. SWOT Analysis
- 16.2.2.4. Recent Developments
- 16.2.2.5. Financials (Based on Availability)
- 16.2.3 Yale Locks & Hardware
- 16.2.3.1. Overview
- 16.2.3.2. Products
- 16.2.3.3. SWOT Analysis
- 16.2.3.4. Recent Developments
- 16.2.3.5. Financials (Based on Availability)
- 16.2.4 Allegion PLC (Schlage)
- 16.2.4.1. Overview
- 16.2.4.2. Products
- 16.2.4.3. SWOT Analysis
- 16.2.4.4. Recent Developments
- 16.2.4.5. Financials (Based on Availability)
- 16.2.5 U-TEC Group Inc
- 16.2.5.1. Overview
- 16.2.5.2. Products
- 16.2.5.3. SWOT Analysis
- 16.2.5.4. Recent Developments
- 16.2.5.5. Financials (Based on Availability)
- 16.2.6 Hanman International Pte Ltd
- 16.2.6.1. Overview
- 16.2.6.2. Products
- 16.2.6.3. SWOT Analysis
- 16.2.6.4. Recent Developments
- 16.2.6.5. Financials (Based on Availability)
- 16.2.7 Nuki Home Solutions
- 16.2.7.1. Overview
- 16.2.7.2. Products
- 16.2.7.3. SWOT Analysis
- 16.2.7.4. Recent Developments
- 16.2.7.5. Financials (Based on Availability)
- 16.2.8 Kwikset (Spectrum Brands Inc )
- 16.2.8.1. Overview
- 16.2.8.2. Products
- 16.2.8.3. SWOT Analysis
- 16.2.8.4. Recent Developments
- 16.2.8.5. Financials (Based on Availability)
- 16.2.9 Salto Systems SL
- 16.2.9.1. Overview
- 16.2.9.2. Products
- 16.2.9.3. SWOT Analysis
- 16.2.9.4. Recent Developments
- 16.2.9.5. Financials (Based on Availability)
- 16.2.10 Dormakaba Group
- 16.2.10.1. Overview
- 16.2.10.2. Products
- 16.2.10.3. SWOT Analysis
- 16.2.10.4. Recent Developments
- 16.2.10.5. Financials (Based on Availability)
- 16.2.11 August Inc
- 16.2.11.1. Overview
- 16.2.11.2. Products
- 16.2.11.3. SWOT Analysis
- 16.2.11.4. Recent Developments
- 16.2.11.5. Financials (Based on Availability)
- 16.2.12 Master Lock Company LLC
- 16.2.12.1. Overview
- 16.2.12.2. Products
- 16.2.12.3. SWOT Analysis
- 16.2.12.4. Recent Developments
- 16.2.12.5. Financials (Based on Availability)
- 16.2.1 Netatmo (Legrand)
List of Figures
- Figure 1: Global Smart Lock Market Revenue Breakdown (Million, %) by Region 2024 & 2032
- Figure 2: Global Smart Lock Market Volume Breakdown (K Unit, %) by Region 2024 & 2032
- Figure 3: North America Smart Lock Market Revenue (Million), by Country 2024 & 2032
- Figure 4: North America Smart Lock Market Volume (K Unit), by Country 2024 & 2032
- Figure 5: North America Smart Lock Market Revenue Share (%), by Country 2024 & 2032
- Figure 6: North America Smart Lock Market Volume Share (%), by Country 2024 & 2032
- Figure 7: Europe Smart Lock Market Revenue (Million), by Country 2024 & 2032
- Figure 8: Europe Smart Lock Market Volume (K Unit), by Country 2024 & 2032
- Figure 9: Europe Smart Lock Market Revenue Share (%), by Country 2024 & 2032
- Figure 10: Europe Smart Lock Market Volume Share (%), by Country 2024 & 2032
- Figure 11: Asia Pacific Smart Lock Market Revenue (Million), by Country 2024 & 2032
- Figure 12: Asia Pacific Smart Lock Market Volume (K Unit), by Country 2024 & 2032
- Figure 13: Asia Pacific Smart Lock Market Revenue Share (%), by Country 2024 & 2032
- Figure 14: Asia Pacific Smart Lock Market Volume Share (%), by Country 2024 & 2032
- Figure 15: South America Smart Lock Market Revenue (Million), by Country 2024 & 2032
- Figure 16: South America Smart Lock Market Volume (K Unit), by Country 2024 & 2032
- Figure 17: South America Smart Lock Market Revenue Share (%), by Country 2024 & 2032
- Figure 18: South America Smart Lock Market Volume Share (%), by Country 2024 & 2032
- Figure 19: North America Smart Lock Market Revenue (Million), by Country 2024 & 2032
- Figure 20: North America Smart Lock Market Volume (K Unit), by Country 2024 & 2032
- Figure 21: North America Smart Lock Market Revenue Share (%), by Country 2024 & 2032
- Figure 22: North America Smart Lock Market Volume Share (%), by Country 2024 & 2032
- Figure 23: MEA Smart Lock Market Revenue (Million), by Country 2024 & 2032
- Figure 24: MEA Smart Lock Market Volume (K Unit), by Country 2024 & 2032
- Figure 25: MEA Smart Lock Market Revenue Share (%), by Country 2024 & 2032
- Figure 26: MEA Smart Lock Market Volume Share (%), by Country 2024 & 2032
- Figure 27: Europe Smart Lock Market Revenue (Million), by Communication Technology 2024 & 2032
- Figure 28: Europe Smart Lock Market Volume (K Unit), by Communication Technology 2024 & 2032
- Figure 29: Europe Smart Lock Market Revenue Share (%), by Communication Technology 2024 & 2032
- Figure 30: Europe Smart Lock Market Volume Share (%), by Communication Technology 2024 & 2032
- Figure 31: Europe Smart Lock Market Revenue (Million), by Authentication Method 2024 & 2032
- Figure 32: Europe Smart Lock Market Volume (K Unit), by Authentication Method 2024 & 2032
- Figure 33: Europe Smart Lock Market Revenue Share (%), by Authentication Method 2024 & 2032
- Figure 34: Europe Smart Lock Market Volume Share (%), by Authentication Method 2024 & 2032
- Figure 35: Europe Smart Lock Market Revenue (Million), by End-user Application 2024 & 2032
- Figure 36: Europe Smart Lock Market Volume (K Unit), by End-user Application 2024 & 2032
- Figure 37: Europe Smart Lock Market Revenue Share (%), by End-user Application 2024 & 2032
- Figure 38: Europe Smart Lock Market Volume Share (%), by End-user Application 2024 & 2032
- Figure 39: Europe Smart Lock Market Revenue (Million), by Country 2024 & 2032
- Figure 40: Europe Smart Lock Market Volume (K Unit), by Country 2024 & 2032
- Figure 41: Europe Smart Lock Market Revenue Share (%), by Country 2024 & 2032
- Figure 42: Europe Smart Lock Market Volume Share (%), by Country 2024 & 2032
- Figure 43: Asia Pacific Smart Lock Market Revenue (Million), by Communication Technology 2024 & 2032
- Figure 44: Asia Pacific Smart Lock Market Volume (K Unit), by Communication Technology 2024 & 2032
- Figure 45: Asia Pacific Smart Lock Market Revenue Share (%), by Communication Technology 2024 & 2032
- Figure 46: Asia Pacific Smart Lock Market Volume Share (%), by Communication Technology 2024 & 2032
- Figure 47: Asia Pacific Smart Lock Market Revenue (Million), by Authentication Method 2024 & 2032
- Figure 48: Asia Pacific Smart Lock Market Volume (K Unit), by Authentication Method 2024 & 2032
- Figure 49: Asia Pacific Smart Lock Market Revenue Share (%), by Authentication Method 2024 & 2032
- Figure 50: Asia Pacific Smart Lock Market Volume Share (%), by Authentication Method 2024 & 2032
- Figure 51: Asia Pacific Smart Lock Market Revenue (Million), by End-user Application 2024 & 2032
- Figure 52: Asia Pacific Smart Lock Market Volume (K Unit), by End-user Application 2024 & 2032
- Figure 53: Asia Pacific Smart Lock Market Revenue Share (%), by End-user Application 2024 & 2032
- Figure 54: Asia Pacific Smart Lock Market Volume Share (%), by End-user Application 2024 & 2032
- Figure 55: Asia Pacific Smart Lock Market Revenue (Million), by Country 2024 & 2032
- Figure 56: Asia Pacific Smart Lock Market Volume (K Unit), by Country 2024 & 2032
- Figure 57: Asia Pacific Smart Lock Market Revenue Share (%), by Country 2024 & 2032
- Figure 58: Asia Pacific Smart Lock Market Volume Share (%), by Country 2024 & 2032
- Figure 59: North America Smart Lock Market Revenue (Million), by Communication Technology 2024 & 2032
- Figure 60: North America Smart Lock Market Volume (K Unit), by Communication Technology 2024 & 2032
- Figure 61: North America Smart Lock Market Revenue Share (%), by Communication Technology 2024 & 2032
- Figure 62: North America Smart Lock Market Volume Share (%), by Communication Technology 2024 & 2032
- Figure 63: North America Smart Lock Market Revenue (Million), by Authentication Method 2024 & 2032
- Figure 64: North America Smart Lock Market Volume (K Unit), by Authentication Method 2024 & 2032
- Figure 65: North America Smart Lock Market Revenue Share (%), by Authentication Method 2024 & 2032
- Figure 66: North America Smart Lock Market Volume Share (%), by Authentication Method 2024 & 2032
- Figure 67: North America Smart Lock Market Revenue (Million), by End-user Application 2024 & 2032
- Figure 68: North America Smart Lock Market Volume (K Unit), by End-user Application 2024 & 2032
- Figure 69: North America Smart Lock Market Revenue Share (%), by End-user Application 2024 & 2032
- Figure 70: North America Smart Lock Market Volume Share (%), by End-user Application 2024 & 2032
- Figure 71: North America Smart Lock Market Revenue (Million), by Country 2024 & 2032
- Figure 72: North America Smart Lock Market Volume (K Unit), by Country 2024 & 2032
- Figure 73: North America Smart Lock Market Revenue Share (%), by Country 2024 & 2032
- Figure 74: North America Smart Lock Market Volume Share (%), by Country 2024 & 2032
- Figure 75: Rest of the World Smart Lock Market Revenue (Million), by Communication Technology 2024 & 2032
- Figure 76: Rest of the World Smart Lock Market Volume (K Unit), by Communication Technology 2024 & 2032
- Figure 77: Rest of the World Smart Lock Market Revenue Share (%), by Communication Technology 2024 & 2032
- Figure 78: Rest of the World Smart Lock Market Volume Share (%), by Communication Technology 2024 & 2032
- Figure 79: Rest of the World Smart Lock Market Revenue (Million), by Authentication Method 2024 & 2032
- Figure 80: Rest of the World Smart Lock Market Volume (K Unit), by Authentication Method 2024 & 2032
- Figure 81: Rest of the World Smart Lock Market Revenue Share (%), by Authentication Method 2024 & 2032
- Figure 82: Rest of the World Smart Lock Market Volume Share (%), by Authentication Method 2024 & 2032
- Figure 83: Rest of the World Smart Lock Market Revenue (Million), by End-user Application 2024 & 2032
- Figure 84: Rest of the World Smart Lock Market Volume (K Unit), by End-user Application 2024 & 2032
- Figure 85: Rest of the World Smart Lock Market Revenue Share (%), by End-user Application 2024 & 2032
- Figure 86: Rest of the World Smart Lock Market Volume Share (%), by End-user Application 2024 & 2032
- Figure 87: Rest of the World Smart Lock Market Revenue (Million), by Country 2024 & 2032
- Figure 88: Rest of the World Smart Lock Market Volume (K Unit), by Country 2024 & 2032
- Figure 89: Rest of the World Smart Lock Market Revenue Share (%), by Country 2024 & 2032
- Figure 90: Rest of the World Smart Lock Market Volume Share (%), by Country 2024 & 2032
List of Tables
- Table 1: Global Smart Lock Market Revenue Million Forecast, by Region 2019 & 2032
- Table 2: Global Smart Lock Market Volume K Unit Forecast, by Region 2019 & 2032
- Table 3: Global Smart Lock Market Revenue Million Forecast, by Communication Technology 2019 & 2032
- Table 4: Global Smart Lock Market Volume K Unit Forecast, by Communication Technology 2019 & 2032
- Table 5: Global Smart Lock Market Revenue Million Forecast, by Authentication Method 2019 & 2032
- Table 6: Global Smart Lock Market Volume K Unit Forecast, by Authentication Method 2019 & 2032
- Table 7: Global Smart Lock Market Revenue Million Forecast, by End-user Application 2019 & 2032
- Table 8: Global Smart Lock Market Volume K Unit Forecast, by End-user Application 2019 & 2032
- Table 9: Global Smart Lock Market Revenue Million Forecast, by Region 2019 & 2032
- Table 10: Global Smart Lock Market Volume K Unit Forecast, by Region 2019 & 2032
- Table 11: Global Smart Lock Market Revenue Million Forecast, by Country 2019 & 2032
- Table 12: Global Smart Lock Market Volume K Unit Forecast, by Country 2019 & 2032
- Table 13: United States Smart Lock Market Revenue (Million) Forecast, by Application 2019 & 2032
- Table 14: United States Smart Lock Market Volume (K Unit) Forecast, by Application 2019 & 2032
- Table 15: Canada Smart Lock Market Revenue (Million) Forecast, by Application 2019 & 2032
- Table 16: Canada Smart Lock Market Volume (K Unit) Forecast, by Application 2019 & 2032
- Table 17: Mexico Smart Lock Market Revenue (Million) Forecast, by Application 2019 & 2032
- Table 18: Mexico Smart Lock Market Volume (K Unit) Forecast, by Application 2019 & 2032
- Table 19: Global Smart Lock Market Revenue Million Forecast, by Country 2019 & 2032
- Table 20: Global Smart Lock Market Volume K Unit Forecast, by Country 2019 & 2032
- Table 21: Germany Smart Lock Market Revenue (Million) Forecast, by Application 2019 & 2032
- Table 22: Germany Smart Lock Market Volume (K Unit) Forecast, by Application 2019 & 2032
- Table 23: United Kingdom Smart Lock Market Revenue (Million) Forecast, by Application 2019 & 2032
- Table 24: United Kingdom Smart Lock Market Volume (K Unit) Forecast, by Application 2019 & 2032
- Table 25: France Smart Lock Market Revenue (Million) Forecast, by Application 2019 & 2032
- Table 26: France Smart Lock Market Volume (K Unit) Forecast, by Application 2019 & 2032
- Table 27: Spain Smart Lock Market Revenue (Million) Forecast, by Application 2019 & 2032
- Table 28: Spain Smart Lock Market Volume (K Unit) Forecast, by Application 2019 & 2032
- Table 29: Italy Smart Lock Market Revenue (Million) Forecast, by Application 2019 & 2032
- Table 30: Italy Smart Lock Market Volume (K Unit) Forecast, by Application 2019 & 2032
- Table 31: Spain Smart Lock Market Revenue (Million) Forecast, by Application 2019 & 2032
- Table 32: Spain Smart Lock Market Volume (K Unit) Forecast, by Application 2019 & 2032
- Table 33: Belgium Smart Lock Market Revenue (Million) Forecast, by Application 2019 & 2032
- Table 34: Belgium Smart Lock Market Volume (K Unit) Forecast, by Application 2019 & 2032
- Table 35: Netherland Smart Lock Market Revenue (Million) Forecast, by Application 2019 & 2032
- Table 36: Netherland Smart Lock Market Volume (K Unit) Forecast, by Application 2019 & 2032
- Table 37: Nordics Smart Lock Market Revenue (Million) Forecast, by Application 2019 & 2032
- Table 38: Nordics Smart Lock Market Volume (K Unit) Forecast, by Application 2019 & 2032
- Table 39: Rest of Europe Smart Lock Market Revenue (Million) Forecast, by Application 2019 & 2032
- Table 40: Rest of Europe Smart Lock Market Volume (K Unit) Forecast, by Application 2019 & 2032
- Table 41: Global Smart Lock Market Revenue Million Forecast, by Country 2019 & 2032
- Table 42: Global Smart Lock Market Volume K Unit Forecast, by Country 2019 & 2032
- Table 43: China Smart Lock Market Revenue (Million) Forecast, by Application 2019 & 2032
- Table 44: China Smart Lock Market Volume (K Unit) Forecast, by Application 2019 & 2032
- Table 45: Japan Smart Lock Market Revenue (Million) Forecast, by Application 2019 & 2032
- Table 46: Japan Smart Lock Market Volume (K Unit) Forecast, by Application 2019 & 2032
- Table 47: India Smart Lock Market Revenue (Million) Forecast, by Application 2019 & 2032
- Table 48: India Smart Lock Market Volume (K Unit) Forecast, by Application 2019 & 2032
- Table 49: South Korea Smart Lock Market Revenue (Million) Forecast, by Application 2019 & 2032
- Table 50: South Korea Smart Lock Market Volume (K Unit) Forecast, by Application 2019 & 2032
- Table 51: Southeast Asia Smart Lock Market Revenue (Million) Forecast, by Application 2019 & 2032
- Table 52: Southeast Asia Smart Lock Market Volume (K Unit) Forecast, by Application 2019 & 2032
- Table 53: Australia Smart Lock Market Revenue (Million) Forecast, by Application 2019 & 2032
- Table 54: Australia Smart Lock Market Volume (K Unit) Forecast, by Application 2019 & 2032
- Table 55: Indonesia Smart Lock Market Revenue (Million) Forecast, by Application 2019 & 2032
- Table 56: Indonesia Smart Lock Market Volume (K Unit) Forecast, by Application 2019 & 2032
- Table 57: Phillipes Smart Lock Market Revenue (Million) Forecast, by Application 2019 & 2032
- Table 58: Phillipes Smart Lock Market Volume (K Unit) Forecast, by Application 2019 & 2032
- Table 59: Singapore Smart Lock Market Revenue (Million) Forecast, by Application 2019 & 2032
- Table 60: Singapore Smart Lock Market Volume (K Unit) Forecast, by Application 2019 & 2032
- Table 61: Thailandc Smart Lock Market Revenue (Million) Forecast, by Application 2019 & 2032
- Table 62: Thailandc Smart Lock Market Volume (K Unit) Forecast, by Application 2019 & 2032
- Table 63: Rest of Asia Pacific Smart Lock Market Revenue (Million) Forecast, by Application 2019 & 2032
- Table 64: Rest of Asia Pacific Smart Lock Market Volume (K Unit) Forecast, by Application 2019 & 2032
- Table 65: Global Smart Lock Market Revenue Million Forecast, by Country 2019 & 2032
- Table 66: Global Smart Lock Market Volume K Unit Forecast, by Country 2019 & 2032
- Table 67: Brazil Smart Lock Market Revenue (Million) Forecast, by Application 2019 & 2032
- Table 68: Brazil Smart Lock Market Volume (K Unit) Forecast, by Application 2019 & 2032
- Table 69: Argentina Smart Lock Market Revenue (Million) Forecast, by Application 2019 & 2032
- Table 70: Argentina Smart Lock Market Volume (K Unit) Forecast, by Application 2019 & 2032
- Table 71: Peru Smart Lock Market Revenue (Million) Forecast, by Application 2019 & 2032
- Table 72: Peru Smart Lock Market Volume (K Unit) Forecast, by Application 2019 & 2032
- Table 73: Chile Smart Lock Market Revenue (Million) Forecast, by Application 2019 & 2032
- Table 74: Chile Smart Lock Market Volume (K Unit) Forecast, by Application 2019 & 2032
- Table 75: Colombia Smart Lock Market Revenue (Million) Forecast, by Application 2019 & 2032
- Table 76: Colombia Smart Lock Market Volume (K Unit) Forecast, by Application 2019 & 2032
- Table 77: Ecuador Smart Lock Market Revenue (Million) Forecast, by Application 2019 & 2032
- Table 78: Ecuador Smart Lock Market Volume (K Unit) Forecast, by Application 2019 & 2032
- Table 79: Venezuela Smart Lock Market Revenue (Million) Forecast, by Application 2019 & 2032
- Table 80: Venezuela Smart Lock Market Volume (K Unit) Forecast, by Application 2019 & 2032
- Table 81: Rest of South America Smart Lock Market Revenue (Million) Forecast, by Application 2019 & 2032
- Table 82: Rest of South America Smart Lock Market Volume (K Unit) Forecast, by Application 2019 & 2032
- Table 83: Global Smart Lock Market Revenue Million Forecast, by Country 2019 & 2032
- Table 84: Global Smart Lock Market Volume K Unit Forecast, by Country 2019 & 2032
- Table 85: United States Smart Lock Market Revenue (Million) Forecast, by Application 2019 & 2032
- Table 86: United States Smart Lock Market Volume (K Unit) Forecast, by Application 2019 & 2032
- Table 87: Canada Smart Lock Market Revenue (Million) Forecast, by Application 2019 & 2032
- Table 88: Canada Smart Lock Market Volume (K Unit) Forecast, by Application 2019 & 2032
- Table 89: Mexico Smart Lock Market Revenue (Million) Forecast, by Application 2019 & 2032
- Table 90: Mexico Smart Lock Market Volume (K Unit) Forecast, by Application 2019 & 2032
- Table 91: Global Smart Lock Market Revenue Million Forecast, by Country 2019 & 2032
- Table 92: Global Smart Lock Market Volume K Unit Forecast, by Country 2019 & 2032
- Table 93: United Arab Emirates Smart Lock Market Revenue (Million) Forecast, by Application 2019 & 2032
- Table 94: United Arab Emirates Smart Lock Market Volume (K Unit) Forecast, by Application 2019 & 2032
- Table 95: Saudi Arabia Smart Lock Market Revenue (Million) Forecast, by Application 2019 & 2032
- Table 96: Saudi Arabia Smart Lock Market Volume (K Unit) Forecast, by Application 2019 & 2032
- Table 97: South Africa Smart Lock Market Revenue (Million) Forecast, by Application 2019 & 2032
- Table 98: South Africa Smart Lock Market Volume (K Unit) Forecast, by Application 2019 & 2032
- Table 99: Rest of Middle East and Africa Smart Lock Market Revenue (Million) Forecast, by Application 2019 & 2032
- Table 100: Rest of Middle East and Africa Smart Lock Market Volume (K Unit) Forecast, by Application 2019 & 2032
- Table 101: Global Smart Lock Market Revenue Million Forecast, by Communication Technology 2019 & 2032
- Table 102: Global Smart Lock Market Volume K Unit Forecast, by Communication Technology 2019 & 2032
- Table 103: Global Smart Lock Market Revenue Million Forecast, by Authentication Method 2019 & 2032
- Table 104: Global Smart Lock Market Volume K Unit Forecast, by Authentication Method 2019 & 2032
- Table 105: Global Smart Lock Market Revenue Million Forecast, by End-user Application 2019 & 2032
- Table 106: Global Smart Lock Market Volume K Unit Forecast, by End-user Application 2019 & 2032
- Table 107: Global Smart Lock Market Revenue Million Forecast, by Country 2019 & 2032
- Table 108: Global Smart Lock Market Volume K Unit Forecast, by Country 2019 & 2032
- Table 109: Global Smart Lock Market Revenue Million Forecast, by Communication Technology 2019 & 2032
- Table 110: Global Smart Lock Market Volume K Unit Forecast, by Communication Technology 2019 & 2032
- Table 111: Global Smart Lock Market Revenue Million Forecast, by Authentication Method 2019 & 2032
- Table 112: Global Smart Lock Market Volume K Unit Forecast, by Authentication Method 2019 & 2032
- Table 113: Global Smart Lock Market Revenue Million Forecast, by End-user Application 2019 & 2032
- Table 114: Global Smart Lock Market Volume K Unit Forecast, by End-user Application 2019 & 2032
- Table 115: Global Smart Lock Market Revenue Million Forecast, by Country 2019 & 2032
- Table 116: Global Smart Lock Market Volume K Unit Forecast, by Country 2019 & 2032
- Table 117: Global Smart Lock Market Revenue Million Forecast, by Communication Technology 2019 & 2032
- Table 118: Global Smart Lock Market Volume K Unit Forecast, by Communication Technology 2019 & 2032
- Table 119: Global Smart Lock Market Revenue Million Forecast, by Authentication Method 2019 & 2032
- Table 120: Global Smart Lock Market Volume K Unit Forecast, by Authentication Method 2019 & 2032
- Table 121: Global Smart Lock Market Revenue Million Forecast, by End-user Application 2019 & 2032
- Table 122: Global Smart Lock Market Volume K Unit Forecast, by End-user Application 2019 & 2032
- Table 123: Global Smart Lock Market Revenue Million Forecast, by Country 2019 & 2032
- Table 124: Global Smart Lock Market Volume K Unit Forecast, by Country 2019 & 2032
- Table 125: Global Smart Lock Market Revenue Million Forecast, by Communication Technology 2019 & 2032
- Table 126: Global Smart Lock Market Volume K Unit Forecast, by Communication Technology 2019 & 2032
- Table 127: Global Smart Lock Market Revenue Million Forecast, by Authentication Method 2019 & 2032
- Table 128: Global Smart Lock Market Volume K Unit Forecast, by Authentication Method 2019 & 2032
- Table 129: Global Smart Lock Market Revenue Million Forecast, by End-user Application 2019 & 2032
- Table 130: Global Smart Lock Market Volume K Unit Forecast, by End-user Application 2019 & 2032
- Table 131: Global Smart Lock Market Revenue Million Forecast, by Country 2019 & 2032
- Table 132: Global Smart Lock Market Volume K Unit Forecast, by Country 2019 & 2032
Frequently Asked Questions
1. What is the projected Compound Annual Growth Rate (CAGR) of the Smart Lock Market?
The projected CAGR is approximately 15.40%.
2. Which companies are prominent players in the Smart Lock Market?
Key companies in the market include Netatmo (Legrand), Lockly, Yale Locks & Hardware, Allegion PLC (Schlage), U-TEC Group Inc, Hanman International Pte Ltd, Nuki Home Solutions, Kwikset (Spectrum Brands Inc ), Salto Systems SL, Dormakaba Group, August Inc, Master Lock Company LLC.
3. What are the main segments of the Smart Lock Market?
The market segments include Communication Technology, Authentication Method, End-user Application.
4. Can you provide details about the market size?
The market size is estimated to be USD 2.80 Million as of 2022.
5. What are some drivers contributing to market growth?
Increasing Safety and Security Concerns; Increasing Adoption of Smart Home Architecture.
6. What are the notable trends driving market growth?
Commercial Adoption is Expected to Grow Significantly.
7. Are there any restraints impacting market growth?
High cost involved in replacing the existing Deep UV with EUV lasers; Monopoly existing within the market.
8. Can you provide examples of recent developments in the market?
September 2022 - The first over-the-air remotely charged smart locks are now widely accessible to commercial developers of real estate in the United States and Canada, according to an announcement made today by Alfred International Inc., the intelligent lock innovator with industry-leading designs and flexibility, and Wi-Charge, the pioneer in long-range wireless power solutions. In the commercial and residential markets, Alfred ML2 smart mortise locks with wireless power options are establishing new benchmarks for safety, security, and automation. After extensive internal testing and live pilot installations, the locks have been certified.
9. What pricing options are available for accessing the report?
Pricing options include single-user, multi-user, and enterprise licenses priced at USD 4750, USD 5250, and USD 8750 respectively.
10. Is the market size provided in terms of value or volume?
The market size is provided in terms of value, measured in Million and volume, measured in K Unit.
11. Are there any specific market keywords associated with the report?
Yes, the market keyword associated with the report is "Smart Lock Market," which aids in identifying and referencing the specific market segment covered.
12. How do I determine which pricing option suits my needs best?
The pricing options vary based on user requirements and access needs. Individual users may opt for single-user licenses, while businesses requiring broader access may choose multi-user or enterprise licenses for cost-effective access to the report.
13. Are there any additional resources or data provided in the Smart Lock Market report?
While the report offers comprehensive insights, it's advisable to review the specific contents or supplementary materials provided to ascertain if additional resources or data are available.
14. How can I stay updated on further developments or reports in the Smart Lock Market?
To stay informed about further developments, trends, and reports in the Smart Lock Market, consider subscribing to industry newsletters, following relevant companies and organizations, or regularly checking reputable industry news sources and publications.
Methodology
Step 1 - Identification of Relevant Samples Size from Population Database


Step 2 - Approaches for Defining Global Market Size (Value, Volume* & Price*)

Note*: In applicable scenarios
Step 3 - Data Sources
Primary Research
- Web Analytics
- Survey Reports
- Research Institute
- Latest Research Reports
- Opinion Leaders
Secondary Research
- Annual Reports
- White Paper
- Latest Press Release
- Industry Association
- Paid Database
- Investor Presentations

Step 4 - Data Triangulation
Involves using different sources of information in order to increase the validity of a study
These sources are likely to be stakeholders in a program - participants, other researchers, program staff, other community members, and so on.
Then we put all data in single framework & apply various statistical tools to find out the dynamic on the market.
During the analysis stage, feedback from the stakeholder groups would be compared to determine areas of agreement as well as areas of divergence


