
Key Insights
The smart transformer market is experiencing robust growth, driven by the increasing demand for efficient and reliable power grids, particularly in the burgeoning renewable energy sector. The integration of smart transformers into smart grids enhances grid stability, improves power quality, and facilitates the integration of distributed generation sources like solar and wind power. This is further accelerated by the expansion of electric vehicle (EV) charging infrastructure and the rise of traction locomotives in the railway industry, both placing greater demands on power distribution networks. The market is segmented by application (smart grid, traction locomotives, and other applications) and type (distribution and power transformers). While the smart grid segment currently holds the largest market share, the traction locomotive segment is projected to witness significant growth due to the global push for electrification of rail transport. Major players like ABB, Siemens, and Hitachi are strategically investing in R&D and expanding their product portfolios to cater to this growing demand. Geographic analysis reveals strong growth across North America, Europe, and Asia-Pacific, with China and the United States leading as significant market contributors. However, regulatory hurdles and high initial investment costs related to deployment and infrastructure upgrades pose challenges to wider adoption. The overall market is expected to maintain a Compound Annual Growth Rate (CAGR) exceeding 2.50%, resulting in a substantial market expansion over the forecast period (2025-2033).
The competitive landscape is marked by the presence of both established multinational corporations and specialized transformer manufacturers. These companies are focusing on technological advancements, such as the integration of advanced sensors, digital communication technologies, and sophisticated monitoring systems. Furthermore, strategic partnerships and mergers and acquisitions are expected to shape the market dynamics in the coming years. The ongoing focus on grid modernization initiatives by governments globally is providing a conducive environment for the growth of the smart transformer market. The increasing adoption of predictive maintenance techniques, enabled by smart transformers, leads to reduced downtime and operational costs, further boosting market attractiveness. Future growth will also be influenced by the evolving technological landscape, including the integration of artificial intelligence (AI) and machine learning (ML) for enhanced grid management and improved asset utilization. This will contribute to a continuous evolution of smart transformer functionalities and consequently increase market value.
Smart Transformers Industry Report: 2019-2033
This comprehensive report provides an in-depth analysis of the global Smart Transformers Industry, offering invaluable insights for industry professionals, investors, and strategic decision-makers. With a study period spanning 2019-2033, a base year of 2025, and a forecast period of 2025-2033, this report offers a complete picture of the market's historical performance, current state, and future trajectory. The report projects a market size exceeding xx Million by 2033, presenting significant growth opportunities.
Smart Transformers Industry Market Structure & Innovation Trends
This section analyzes the competitive landscape of the smart transformers market, examining market concentration, innovation drivers, regulatory frameworks, and mergers & acquisitions (M&A) activity. We delve into the market share held by key players like ABB Ltd, Hitachi Ltd, and Siemens AG, alongside emerging competitors. The report also explores the influence of regulatory frameworks on market growth and the impact of technological advancements, such as the integration of AI and IoT, on innovation. We will quantify market share distribution and analyze M&A deal values exceeding xx Million in the historical period.
- Market Concentration: Analysis of the Herfindahl-Hirschman Index (HHI) to determine market concentration levels.
- Innovation Drivers: Detailed examination of technological advancements driving market growth.
- Regulatory Landscape: Assessment of global and regional regulations impacting the smart transformers market.
- Product Substitutes: Exploration of alternative technologies and their potential impact on market share.
- End-User Demographics: Analysis of the diverse end-user segments driving demand for smart transformers.
- M&A Activity: Review of significant M&A deals and their influence on market dynamics, including deal values and strategic implications.
Smart Transformers Industry Market Dynamics & Trends
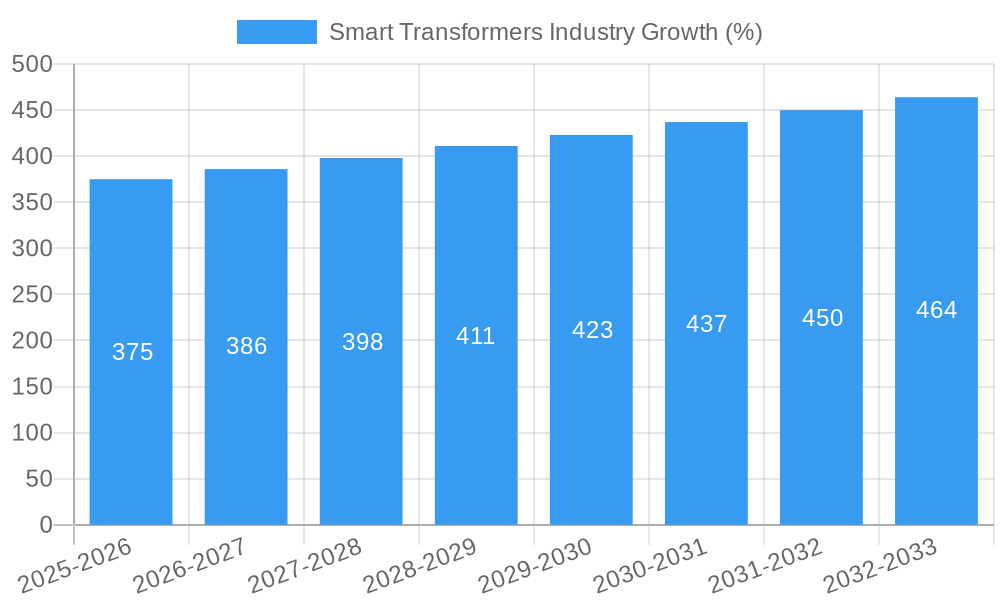
This section explores the key dynamics driving the growth of the smart transformers market. We analyze market growth drivers, technological disruptions, consumer preferences, and competitive dynamics, providing a comprehensive overview of the market's evolution. The report will quantify market growth using metrics such as Compound Annual Growth Rate (CAGR) and market penetration rates, projecting a CAGR of xx% during the forecast period. Specific factors influencing market expansion will be detailed, along with an assessment of current and emerging trends.
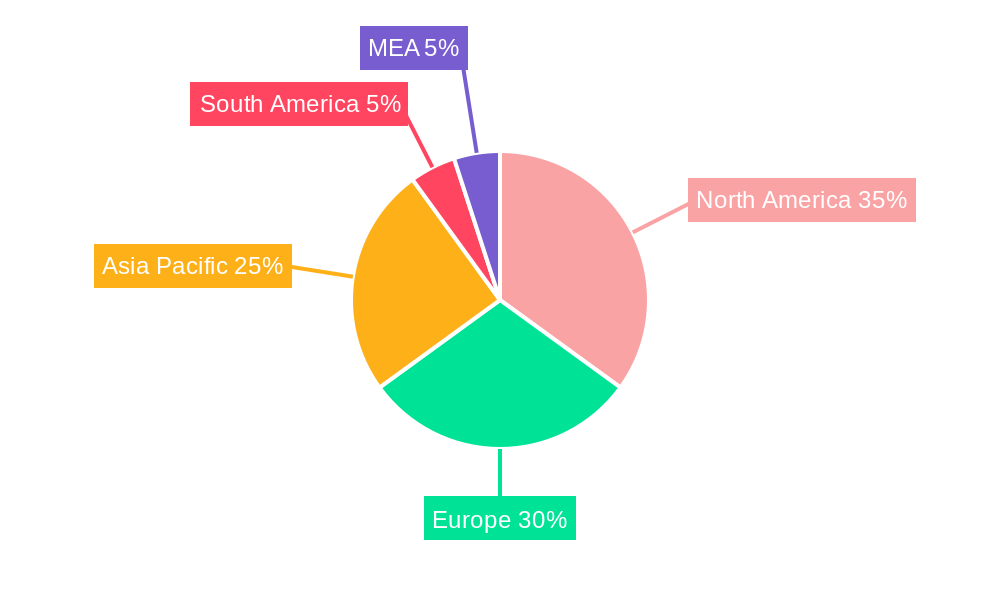
Dominant Regions & Segments in Smart Transformers Industry
This section identifies the leading regions and segments within the smart transformers market. We analyze market dominance based on application (Smart Grid, Traction Locomotive, Other Applications) and type (Distribution Transformers, Power Transformers). Key drivers for dominance in each region and segment are explored, including economic policies, infrastructure development, and technological adoption rates.
- Leading Regions: Detailed analysis of regional market leaders and underlying drivers for their success.
- Leading Applications: Examination of the application segment driving the highest demand and growth.
- Leading Types: Identification of the transformer type experiencing the most significant market expansion.
- Key Drivers: Analysis of economic policies, infrastructure projects, and technological advancements fueling growth in specific regions and segments.
Smart Transformers Industry Product Innovations
This section showcases recent product innovations in the smart transformers market, highlighting technological trends, competitive advantages, and market fit. We examine new features, improved efficiency, and enhanced functionalities driving the adoption of smart transformers across various applications. The impact of these innovations on market competition and overall market growth will be analyzed.
Report Scope & Segmentation Analysis
This section details the market segmentation across application (Smart Grid, Traction Locomotive, Other Applications) and type (Distribution Transformers, Power Transformers). We provide growth projections, market sizes, and a competitive analysis for each segment, highlighting key players and their market strategies.
- Smart Grid Applications: Market size, growth projections, and competitive analysis.
- Traction Locomotive Applications: Market size, growth projections, and competitive analysis.
- Other Applications: Market size, growth projections, and competitive analysis.
- Distribution Transformers: Market size, growth projections, and competitive analysis.
- Power Transformers: Market size, growth projections, and competitive analysis.
Key Drivers of Smart Transformers Industry Growth
This section outlines the key factors driving the growth of the smart transformers market. We focus on technological advancements (e.g., AI integration, improved efficiency), economic factors (e.g., rising energy demand, infrastructure investments), and regulatory changes (e.g., smart grid initiatives, environmental regulations) that are accelerating market expansion.
Challenges in the Smart Transformers Industry Sector
This section identifies the challenges faced by the smart transformers industry. We discuss regulatory hurdles, supply chain disruptions, and competitive pressures, quantifying their impact on market growth and profitability.
Emerging Opportunities in Smart Transformers Industry
This section highlights emerging trends and opportunities in the smart transformers market, focusing on new markets, technologies, and consumer preferences. We analyze the potential for market expansion and identify areas for strategic growth.
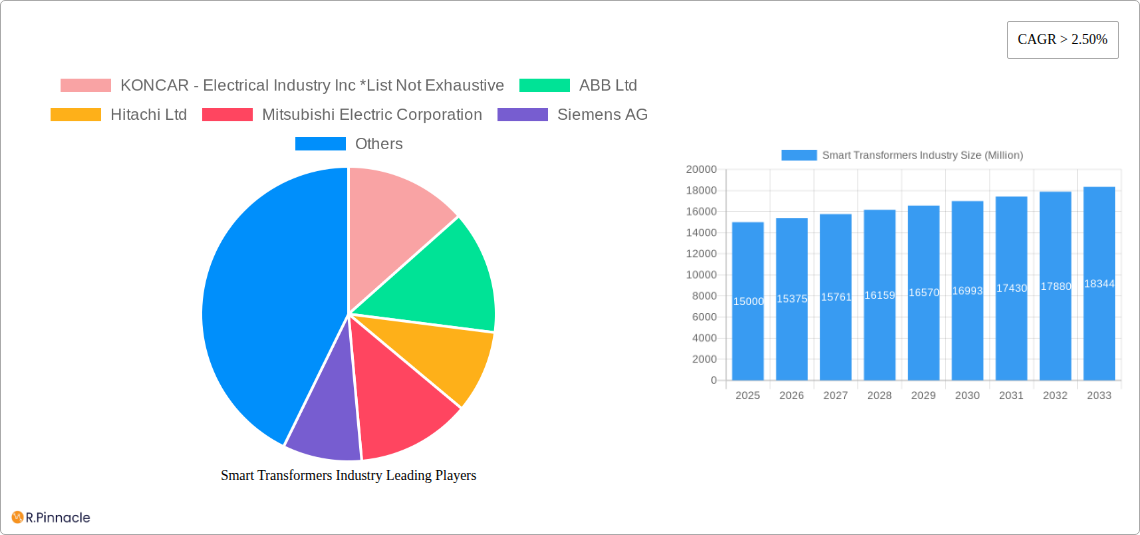
Leading Players in the Smart Transformers Industry Market
- KONCAR - Electrical Industry Inc
- ABB Ltd
- Hitachi Ltd
- Mitsubishi Electric Corporation
- Siemens AG
- Crompton Greaves
- Schneider Electric SE
- SPX Transformer Solutions Inc
- Eaton Corporation PLC
- General Electric Company
Key Developments in Smart Transformers Industry
- March 2021: Hitachi ABB Power Grids partnered with NTU Singapore on a smart grid development project, focusing on next-gen transformers.
- September 2021: Noor Energy 1 adopted Huawei's string inverters and Smart Transformer Stations for a more modular system.
- December 2021: Huawei planned to supply its string inverters and smart transformer stations for the Soudia Agro Solar PV Power Plant in Bangladesh.
Future Outlook for Smart Transformers Industry Market
This section summarizes the growth accelerators for the smart transformers market, focusing on future market potential and strategic opportunities. We analyze the long-term prospects for market expansion and highlight key areas for investment and innovation. The market is poised for significant growth driven by increasing demand for efficient and reliable energy solutions, coupled with ongoing advancements in smart grid technologies.
Smart Transformers Industry Segmentation
-
1. Type
- 1.1. Distribution Transformers
- 1.2. Power Transformers
-
2. Application
- 2.1. Smart Grid
- 2.2. Traction Locomotive
- 2.3. Other Applications
Smart Transformers Industry Segmentation By Geography
- 1. North America
- 2. Europe
- 3. Asia Pacific
- 4. South America
- 5. Middle East
Smart Transformers Industry REPORT HIGHLIGHTS
| Aspects | Details |
|---|---|
| Study Period | 2019-2033 |
| Base Year | 2024 |
| Estimated Year | 2025 |
| Forecast Period | 2025-2033 |
| Historical Period | 2019-2024 |
| Growth Rate | CAGR of > 2.50% from 2019-2033 |
| Segmentation |
|
Table of Contents
- 1. Introduction
- 1.1. Research Scope
- 1.2. Market Segmentation
- 1.3. Research Methodology
- 1.4. Definitions and Assumptions
- 2. Executive Summary
- 2.1. Introduction
- 3. Market Dynamics
- 3.1. Introduction
- 3.2. Market Drivers
- 3.2.1. 4.; Growing Power Demand from the Commercial and Industrial Sectors
- 3.3. Market Restrains
- 3.3.1. 4.; Stringent Environmental and Safety Regulations
- 3.4. Market Trends
- 3.4.1. Distribution Transformers to Dominate the Market
- 4. Market Factor Analysis
- 4.1. Porters Five Forces
- 4.2. Supply/Value Chain
- 4.3. PESTEL analysis
- 4.4. Market Entropy
- 4.5. Patent/Trademark Analysis
- 5. Global Smart Transformers Industry Analysis, Insights and Forecast, 2019-2031
- 5.1. Market Analysis, Insights and Forecast - by Type
- 5.1.1. Distribution Transformers
- 5.1.2. Power Transformers
- 5.2. Market Analysis, Insights and Forecast - by Application
- 5.2.1. Smart Grid
- 5.2.2. Traction Locomotive
- 5.2.3. Other Applications
- 5.3. Market Analysis, Insights and Forecast - by Region
- 5.3.1. North America
- 5.3.2. Europe
- 5.3.3. Asia Pacific
- 5.3.4. South America
- 5.3.5. Middle East
- 5.1. Market Analysis, Insights and Forecast - by Type
- 6. North America Smart Transformers Industry Analysis, Insights and Forecast, 2019-2031
- 6.1. Market Analysis, Insights and Forecast - by Type
- 6.1.1. Distribution Transformers
- 6.1.2. Power Transformers
- 6.2. Market Analysis, Insights and Forecast - by Application
- 6.2.1. Smart Grid
- 6.2.2. Traction Locomotive
- 6.2.3. Other Applications
- 6.1. Market Analysis, Insights and Forecast - by Type
- 7. Europe Smart Transformers Industry Analysis, Insights and Forecast, 2019-2031
- 7.1. Market Analysis, Insights and Forecast - by Type
- 7.1.1. Distribution Transformers
- 7.1.2. Power Transformers
- 7.2. Market Analysis, Insights and Forecast - by Application
- 7.2.1. Smart Grid
- 7.2.2. Traction Locomotive
- 7.2.3. Other Applications
- 7.1. Market Analysis, Insights and Forecast - by Type
- 8. Asia Pacific Smart Transformers Industry Analysis, Insights and Forecast, 2019-2031
- 8.1. Market Analysis, Insights and Forecast - by Type
- 8.1.1. Distribution Transformers
- 8.1.2. Power Transformers
- 8.2. Market Analysis, Insights and Forecast - by Application
- 8.2.1. Smart Grid
- 8.2.2. Traction Locomotive
- 8.2.3. Other Applications
- 8.1. Market Analysis, Insights and Forecast - by Type
- 9. South America Smart Transformers Industry Analysis, Insights and Forecast, 2019-2031
- 9.1. Market Analysis, Insights and Forecast - by Type
- 9.1.1. Distribution Transformers
- 9.1.2. Power Transformers
- 9.2. Market Analysis, Insights and Forecast - by Application
- 9.2.1. Smart Grid
- 9.2.2. Traction Locomotive
- 9.2.3. Other Applications
- 9.1. Market Analysis, Insights and Forecast - by Type
- 10. Middle East Smart Transformers Industry Analysis, Insights and Forecast, 2019-2031
- 10.1. Market Analysis, Insights and Forecast - by Type
- 10.1.1. Distribution Transformers
- 10.1.2. Power Transformers
- 10.2. Market Analysis, Insights and Forecast - by Application
- 10.2.1. Smart Grid
- 10.2.2. Traction Locomotive
- 10.2.3. Other Applications
- 10.1. Market Analysis, Insights and Forecast - by Type
- 11. North America Smart Transformers Industry Analysis, Insights and Forecast, 2019-2031
- 11.1. Market Analysis, Insights and Forecast - By Country/Sub-region
- 11.1.1 United States
- 11.1.2 Canada
- 11.1.3 Mexico
- 12. Europe Smart Transformers Industry Analysis, Insights and Forecast, 2019-2031
- 12.1. Market Analysis, Insights and Forecast - By Country/Sub-region
- 12.1.1 Germany
- 12.1.2 United Kingdom
- 12.1.3 France
- 12.1.4 Spain
- 12.1.5 Italy
- 12.1.6 Spain
- 12.1.7 Belgium
- 12.1.8 Netherland
- 12.1.9 Nordics
- 12.1.10 Rest of Europe
- 13. Asia Pacific Smart Transformers Industry Analysis, Insights and Forecast, 2019-2031
- 13.1. Market Analysis, Insights and Forecast - By Country/Sub-region
- 13.1.1 China
- 13.1.2 Japan
- 13.1.3 India
- 13.1.4 South Korea
- 13.1.5 Southeast Asia
- 13.1.6 Australia
- 13.1.7 Indonesia
- 13.1.8 Phillipes
- 13.1.9 Singapore
- 13.1.10 Thailandc
- 13.1.11 Rest of Asia Pacific
- 14. South America Smart Transformers Industry Analysis, Insights and Forecast, 2019-2031
- 14.1. Market Analysis, Insights and Forecast - By Country/Sub-region
- 14.1.1 Brazil
- 14.1.2 Argentina
- 14.1.3 Peru
- 14.1.4 Chile
- 14.1.5 Colombia
- 14.1.6 Ecuador
- 14.1.7 Venezuela
- 14.1.8 Rest of South America
- 15. North America Smart Transformers Industry Analysis, Insights and Forecast, 2019-2031
- 15.1. Market Analysis, Insights and Forecast - By Country/Sub-region
- 15.1.1 United States
- 15.1.2 Canada
- 15.1.3 Mexico
- 16. MEA Smart Transformers Industry Analysis, Insights and Forecast, 2019-2031
- 16.1. Market Analysis, Insights and Forecast - By Country/Sub-region
- 16.1.1 United Arab Emirates
- 16.1.2 Saudi Arabia
- 16.1.3 South Africa
- 16.1.4 Rest of Middle East and Africa
- 17. Competitive Analysis
- 17.1. Global Market Share Analysis 2024
- 17.2. Company Profiles
- 17.2.1 KONCAR - Electrical Industry Inc *List Not Exhaustive
- 17.2.1.1. Overview
- 17.2.1.2. Products
- 17.2.1.3. SWOT Analysis
- 17.2.1.4. Recent Developments
- 17.2.1.5. Financials (Based on Availability)
- 17.2.2 ABB Ltd
- 17.2.2.1. Overview
- 17.2.2.2. Products
- 17.2.2.3. SWOT Analysis
- 17.2.2.4. Recent Developments
- 17.2.2.5. Financials (Based on Availability)
- 17.2.3 Hitachi Ltd
- 17.2.3.1. Overview
- 17.2.3.2. Products
- 17.2.3.3. SWOT Analysis
- 17.2.3.4. Recent Developments
- 17.2.3.5. Financials (Based on Availability)
- 17.2.4 Mitsubishi Electric Corporation
- 17.2.4.1. Overview
- 17.2.4.2. Products
- 17.2.4.3. SWOT Analysis
- 17.2.4.4. Recent Developments
- 17.2.4.5. Financials (Based on Availability)
- 17.2.5 Siemens AG
- 17.2.5.1. Overview
- 17.2.5.2. Products
- 17.2.5.3. SWOT Analysis
- 17.2.5.4. Recent Developments
- 17.2.5.5. Financials (Based on Availability)
- 17.2.6 Crompton Greaves
- 17.2.6.1. Overview
- 17.2.6.2. Products
- 17.2.6.3. SWOT Analysis
- 17.2.6.4. Recent Developments
- 17.2.6.5. Financials (Based on Availability)
- 17.2.7 Schneider Electric SE
- 17.2.7.1. Overview
- 17.2.7.2. Products
- 17.2.7.3. SWOT Analysis
- 17.2.7.4. Recent Developments
- 17.2.7.5. Financials (Based on Availability)
- 17.2.8 SPX Transformer Solutions Inc
- 17.2.8.1. Overview
- 17.2.8.2. Products
- 17.2.8.3. SWOT Analysis
- 17.2.8.4. Recent Developments
- 17.2.8.5. Financials (Based on Availability)
- 17.2.9 Eaton Corporation PLC
- 17.2.9.1. Overview
- 17.2.9.2. Products
- 17.2.9.3. SWOT Analysis
- 17.2.9.4. Recent Developments
- 17.2.9.5. Financials (Based on Availability)
- 17.2.10 General Electric Company
- 17.2.10.1. Overview
- 17.2.10.2. Products
- 17.2.10.3. SWOT Analysis
- 17.2.10.4. Recent Developments
- 17.2.10.5. Financials (Based on Availability)
- 17.2.1 KONCAR - Electrical Industry Inc *List Not Exhaustive
List of Figures
- Figure 1: Global Smart Transformers Industry Revenue Breakdown (Million, %) by Region 2024 & 2032
- Figure 2: North America Smart Transformers Industry Revenue (Million), by Country 2024 & 2032
- Figure 3: North America Smart Transformers Industry Revenue Share (%), by Country 2024 & 2032
- Figure 4: Europe Smart Transformers Industry Revenue (Million), by Country 2024 & 2032
- Figure 5: Europe Smart Transformers Industry Revenue Share (%), by Country 2024 & 2032
- Figure 6: Asia Pacific Smart Transformers Industry Revenue (Million), by Country 2024 & 2032
- Figure 7: Asia Pacific Smart Transformers Industry Revenue Share (%), by Country 2024 & 2032
- Figure 8: South America Smart Transformers Industry Revenue (Million), by Country 2024 & 2032
- Figure 9: South America Smart Transformers Industry Revenue Share (%), by Country 2024 & 2032
- Figure 10: North America Smart Transformers Industry Revenue (Million), by Country 2024 & 2032
- Figure 11: North America Smart Transformers Industry Revenue Share (%), by Country 2024 & 2032
- Figure 12: MEA Smart Transformers Industry Revenue (Million), by Country 2024 & 2032
- Figure 13: MEA Smart Transformers Industry Revenue Share (%), by Country 2024 & 2032
- Figure 14: North America Smart Transformers Industry Revenue (Million), by Type 2024 & 2032
- Figure 15: North America Smart Transformers Industry Revenue Share (%), by Type 2024 & 2032
- Figure 16: North America Smart Transformers Industry Revenue (Million), by Application 2024 & 2032
- Figure 17: North America Smart Transformers Industry Revenue Share (%), by Application 2024 & 2032
- Figure 18: North America Smart Transformers Industry Revenue (Million), by Country 2024 & 2032
- Figure 19: North America Smart Transformers Industry Revenue Share (%), by Country 2024 & 2032
- Figure 20: Europe Smart Transformers Industry Revenue (Million), by Type 2024 & 2032
- Figure 21: Europe Smart Transformers Industry Revenue Share (%), by Type 2024 & 2032
- Figure 22: Europe Smart Transformers Industry Revenue (Million), by Application 2024 & 2032
- Figure 23: Europe Smart Transformers Industry Revenue Share (%), by Application 2024 & 2032
- Figure 24: Europe Smart Transformers Industry Revenue (Million), by Country 2024 & 2032
- Figure 25: Europe Smart Transformers Industry Revenue Share (%), by Country 2024 & 2032
- Figure 26: Asia Pacific Smart Transformers Industry Revenue (Million), by Type 2024 & 2032
- Figure 27: Asia Pacific Smart Transformers Industry Revenue Share (%), by Type 2024 & 2032
- Figure 28: Asia Pacific Smart Transformers Industry Revenue (Million), by Application 2024 & 2032
- Figure 29: Asia Pacific Smart Transformers Industry Revenue Share (%), by Application 2024 & 2032
- Figure 30: Asia Pacific Smart Transformers Industry Revenue (Million), by Country 2024 & 2032
- Figure 31: Asia Pacific Smart Transformers Industry Revenue Share (%), by Country 2024 & 2032
- Figure 32: South America Smart Transformers Industry Revenue (Million), by Type 2024 & 2032
- Figure 33: South America Smart Transformers Industry Revenue Share (%), by Type 2024 & 2032
- Figure 34: South America Smart Transformers Industry Revenue (Million), by Application 2024 & 2032
- Figure 35: South America Smart Transformers Industry Revenue Share (%), by Application 2024 & 2032
- Figure 36: South America Smart Transformers Industry Revenue (Million), by Country 2024 & 2032
- Figure 37: South America Smart Transformers Industry Revenue Share (%), by Country 2024 & 2032
- Figure 38: Middle East Smart Transformers Industry Revenue (Million), by Type 2024 & 2032
- Figure 39: Middle East Smart Transformers Industry Revenue Share (%), by Type 2024 & 2032
- Figure 40: Middle East Smart Transformers Industry Revenue (Million), by Application 2024 & 2032
- Figure 41: Middle East Smart Transformers Industry Revenue Share (%), by Application 2024 & 2032
- Figure 42: Middle East Smart Transformers Industry Revenue (Million), by Country 2024 & 2032
- Figure 43: Middle East Smart Transformers Industry Revenue Share (%), by Country 2024 & 2032
List of Tables
- Table 1: Global Smart Transformers Industry Revenue Million Forecast, by Region 2019 & 2032
- Table 2: Global Smart Transformers Industry Revenue Million Forecast, by Type 2019 & 2032
- Table 3: Global Smart Transformers Industry Revenue Million Forecast, by Application 2019 & 2032
- Table 4: Global Smart Transformers Industry Revenue Million Forecast, by Region 2019 & 2032
- Table 5: Global Smart Transformers Industry Revenue Million Forecast, by Country 2019 & 2032
- Table 6: United States Smart Transformers Industry Revenue (Million) Forecast, by Application 2019 & 2032
- Table 7: Canada Smart Transformers Industry Revenue (Million) Forecast, by Application 2019 & 2032
- Table 8: Mexico Smart Transformers Industry Revenue (Million) Forecast, by Application 2019 & 2032
- Table 9: Global Smart Transformers Industry Revenue Million Forecast, by Country 2019 & 2032
- Table 10: Germany Smart Transformers Industry Revenue (Million) Forecast, by Application 2019 & 2032
- Table 11: United Kingdom Smart Transformers Industry Revenue (Million) Forecast, by Application 2019 & 2032
- Table 12: France Smart Transformers Industry Revenue (Million) Forecast, by Application 2019 & 2032
- Table 13: Spain Smart Transformers Industry Revenue (Million) Forecast, by Application 2019 & 2032
- Table 14: Italy Smart Transformers Industry Revenue (Million) Forecast, by Application 2019 & 2032
- Table 15: Spain Smart Transformers Industry Revenue (Million) Forecast, by Application 2019 & 2032
- Table 16: Belgium Smart Transformers Industry Revenue (Million) Forecast, by Application 2019 & 2032
- Table 17: Netherland Smart Transformers Industry Revenue (Million) Forecast, by Application 2019 & 2032
- Table 18: Nordics Smart Transformers Industry Revenue (Million) Forecast, by Application 2019 & 2032
- Table 19: Rest of Europe Smart Transformers Industry Revenue (Million) Forecast, by Application 2019 & 2032
- Table 20: Global Smart Transformers Industry Revenue Million Forecast, by Country 2019 & 2032
- Table 21: China Smart Transformers Industry Revenue (Million) Forecast, by Application 2019 & 2032
- Table 22: Japan Smart Transformers Industry Revenue (Million) Forecast, by Application 2019 & 2032
- Table 23: India Smart Transformers Industry Revenue (Million) Forecast, by Application 2019 & 2032
- Table 24: South Korea Smart Transformers Industry Revenue (Million) Forecast, by Application 2019 & 2032
- Table 25: Southeast Asia Smart Transformers Industry Revenue (Million) Forecast, by Application 2019 & 2032
- Table 26: Australia Smart Transformers Industry Revenue (Million) Forecast, by Application 2019 & 2032
- Table 27: Indonesia Smart Transformers Industry Revenue (Million) Forecast, by Application 2019 & 2032
- Table 28: Phillipes Smart Transformers Industry Revenue (Million) Forecast, by Application 2019 & 2032
- Table 29: Singapore Smart Transformers Industry Revenue (Million) Forecast, by Application 2019 & 2032
- Table 30: Thailandc Smart Transformers Industry Revenue (Million) Forecast, by Application 2019 & 2032
- Table 31: Rest of Asia Pacific Smart Transformers Industry Revenue (Million) Forecast, by Application 2019 & 2032
- Table 32: Global Smart Transformers Industry Revenue Million Forecast, by Country 2019 & 2032
- Table 33: Brazil Smart Transformers Industry Revenue (Million) Forecast, by Application 2019 & 2032
- Table 34: Argentina Smart Transformers Industry Revenue (Million) Forecast, by Application 2019 & 2032
- Table 35: Peru Smart Transformers Industry Revenue (Million) Forecast, by Application 2019 & 2032
- Table 36: Chile Smart Transformers Industry Revenue (Million) Forecast, by Application 2019 & 2032
- Table 37: Colombia Smart Transformers Industry Revenue (Million) Forecast, by Application 2019 & 2032
- Table 38: Ecuador Smart Transformers Industry Revenue (Million) Forecast, by Application 2019 & 2032
- Table 39: Venezuela Smart Transformers Industry Revenue (Million) Forecast, by Application 2019 & 2032
- Table 40: Rest of South America Smart Transformers Industry Revenue (Million) Forecast, by Application 2019 & 2032
- Table 41: Global Smart Transformers Industry Revenue Million Forecast, by Country 2019 & 2032
- Table 42: United States Smart Transformers Industry Revenue (Million) Forecast, by Application 2019 & 2032
- Table 43: Canada Smart Transformers Industry Revenue (Million) Forecast, by Application 2019 & 2032
- Table 44: Mexico Smart Transformers Industry Revenue (Million) Forecast, by Application 2019 & 2032
- Table 45: Global Smart Transformers Industry Revenue Million Forecast, by Country 2019 & 2032
- Table 46: United Arab Emirates Smart Transformers Industry Revenue (Million) Forecast, by Application 2019 & 2032
- Table 47: Saudi Arabia Smart Transformers Industry Revenue (Million) Forecast, by Application 2019 & 2032
- Table 48: South Africa Smart Transformers Industry Revenue (Million) Forecast, by Application 2019 & 2032
- Table 49: Rest of Middle East and Africa Smart Transformers Industry Revenue (Million) Forecast, by Application 2019 & 2032
- Table 50: Global Smart Transformers Industry Revenue Million Forecast, by Type 2019 & 2032
- Table 51: Global Smart Transformers Industry Revenue Million Forecast, by Application 2019 & 2032
- Table 52: Global Smart Transformers Industry Revenue Million Forecast, by Country 2019 & 2032
- Table 53: Global Smart Transformers Industry Revenue Million Forecast, by Type 2019 & 2032
- Table 54: Global Smart Transformers Industry Revenue Million Forecast, by Application 2019 & 2032
- Table 55: Global Smart Transformers Industry Revenue Million Forecast, by Country 2019 & 2032
- Table 56: Global Smart Transformers Industry Revenue Million Forecast, by Type 2019 & 2032
- Table 57: Global Smart Transformers Industry Revenue Million Forecast, by Application 2019 & 2032
- Table 58: Global Smart Transformers Industry Revenue Million Forecast, by Country 2019 & 2032
- Table 59: Global Smart Transformers Industry Revenue Million Forecast, by Type 2019 & 2032
- Table 60: Global Smart Transformers Industry Revenue Million Forecast, by Application 2019 & 2032
- Table 61: Global Smart Transformers Industry Revenue Million Forecast, by Country 2019 & 2032
- Table 62: Global Smart Transformers Industry Revenue Million Forecast, by Type 2019 & 2032
- Table 63: Global Smart Transformers Industry Revenue Million Forecast, by Application 2019 & 2032
- Table 64: Global Smart Transformers Industry Revenue Million Forecast, by Country 2019 & 2032
Frequently Asked Questions
1. What is the projected Compound Annual Growth Rate (CAGR) of the Smart Transformers Industry?
The projected CAGR is approximately > 2.50%.
2. Which companies are prominent players in the Smart Transformers Industry?
Key companies in the market include KONCAR - Electrical Industry Inc *List Not Exhaustive, ABB Ltd, Hitachi Ltd, Mitsubishi Electric Corporation, Siemens AG, Crompton Greaves, Schneider Electric SE, SPX Transformer Solutions Inc, Eaton Corporation PLC, General Electric Company.
3. What are the main segments of the Smart Transformers Industry?
The market segments include Type, Application.
4. Can you provide details about the market size?
The market size is estimated to be USD XX Million as of 2022.
5. What are some drivers contributing to market growth?
4.; Growing Power Demand from the Commercial and Industrial Sectors.
6. What are the notable trends driving market growth?
Distribution Transformers to Dominate the Market.
7. Are there any restraints impacting market growth?
4.; Stringent Environmental and Safety Regulations.
8. Can you provide examples of recent developments in the market?
In March 2021, Hitachi ABB Power Grids partnered with research institute Nanyang Technological University, Singapore (NTU Singapore) on a government-led smart grid development project. The partnership is expected to also work on the creation of next-gen transformers compatible with the smart grid.
9. What pricing options are available for accessing the report?
Pricing options include single-user, multi-user, and enterprise licenses priced at USD 4750, USD 5250, and USD 8750 respectively.
10. Is the market size provided in terms of value or volume?
The market size is provided in terms of value, measured in Million.
11. Are there any specific market keywords associated with the report?
Yes, the market keyword associated with the report is "Smart Transformers Industry," which aids in identifying and referencing the specific market segment covered.
12. How do I determine which pricing option suits my needs best?
The pricing options vary based on user requirements and access needs. Individual users may opt for single-user licenses, while businesses requiring broader access may choose multi-user or enterprise licenses for cost-effective access to the report.
13. Are there any additional resources or data provided in the Smart Transformers Industry report?
While the report offers comprehensive insights, it's advisable to review the specific contents or supplementary materials provided to ascertain if additional resources or data are available.
14. How can I stay updated on further developments or reports in the Smart Transformers Industry?
To stay informed about further developments, trends, and reports in the Smart Transformers Industry, consider subscribing to industry newsletters, following relevant companies and organizations, or regularly checking reputable industry news sources and publications.
Methodology
Step 1 - Identification of Relevant Samples Size from Population Database


Step 2 - Approaches for Defining Global Market Size (Value, Volume* & Price*)

Note*: In applicable scenarios
Step 3 - Data Sources
Primary Research
- Web Analytics
- Survey Reports
- Research Institute
- Latest Research Reports
- Opinion Leaders
Secondary Research
- Annual Reports
- White Paper
- Latest Press Release
- Industry Association
- Paid Database
- Investor Presentations

Step 4 - Data Triangulation
Involves using different sources of information in order to increase the validity of a study
These sources are likely to be stakeholders in a program - participants, other researchers, program staff, other community members, and so on.
Then we put all data in single framework & apply various statistical tools to find out the dynamic on the market.
During the analysis stage, feedback from the stakeholder groups would be compared to determine areas of agreement as well as areas of divergence


