
Key Insights
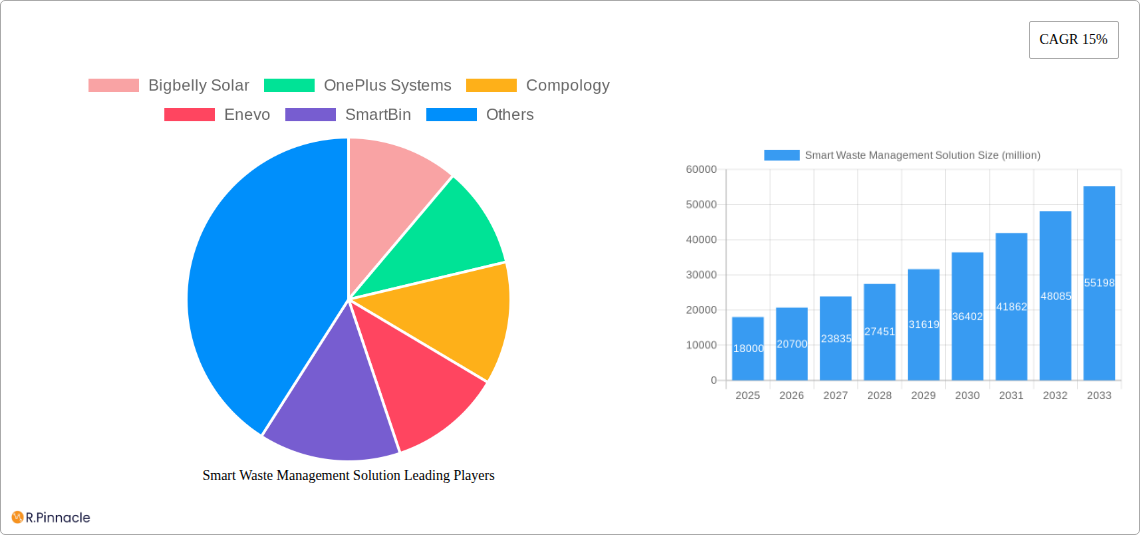
The global smart waste management solutions market is experiencing robust growth, projected to reach a market size of $18 billion in 2025, expanding at a Compound Annual Growth Rate (CAGR) of 15% from 2025 to 2033. This surge is driven by several key factors. Increasing urbanization leads to a greater volume of waste, necessitating efficient and sustainable waste management strategies. Smart solutions, incorporating IoT sensors, data analytics, and AI-powered route optimization, offer significant improvements in waste collection efficiency, reducing operational costs and environmental impact. Growing environmental awareness among citizens and governments is pushing for more sustainable waste handling practices, further fueling market demand. Furthermore, the rising adoption of smart city initiatives globally creates a fertile ground for the deployment of smart waste management systems. The integration of these solutions with existing waste management infrastructure is relatively straightforward, allowing for seamless implementation and faster return on investment. The increasing focus on waste diversion and recycling, along with stringent environmental regulations in several regions, contribute to this market's substantial growth trajectory.
Market segmentation is primarily driven by the type of technology employed (e.g., smart bins, waste tracking software), the application areas (residential, commercial, industrial), and geographic location. Key players like Bigbelly Solar, OnePlus Systems, Compology, Enevo, SmartBin, Urbiotica, and IoTsens are actively shaping the market landscape through innovation and strategic partnerships. Although challenges such as high initial investment costs and potential data security concerns exist, the long-term benefits of enhanced efficiency, reduced environmental footprint, and improved public health outweigh these limitations, ensuring the sustained growth of the smart waste management solutions market. The forecast period of 2025-2033 shows significant potential for market expansion as more cities and municipalities embrace these technologies to address their growing waste management challenges.
This comprehensive report provides an in-depth analysis of the global smart waste management solution market, offering actionable insights for industry professionals, investors, and strategic decision-makers. The study period covers 2019-2033, with a base year of 2025 and a forecast period of 2025-2033. The report projects a market valued at $xx million in 2025, experiencing significant growth throughout the forecast period. This report leverages extensive research and data analysis to provide a clear understanding of market dynamics, key players, and future opportunities.
Smart Waste Management Solution Market Structure & Innovation Trends
This section analyzes the competitive landscape, including market concentration, innovation drivers, regulatory frameworks, and market dynamics. The global smart waste management solution market is characterized by a moderately concentrated structure with several key players holding significant market share. Bigbelly Solar, OnePlus Systems, Compology, Enevo, SmartBin, Urbiotica, and IoTsens are among the prominent companies shaping the market.
- Market Concentration: The top five players hold an estimated xx% of the market share in 2025.
- Innovation Drivers: Increasing urbanization, stringent environmental regulations, and the rising adoption of IoT technologies are major drivers of innovation.
- Regulatory Frameworks: Government initiatives promoting waste reduction and smart city development significantly influence market growth.
- Product Substitutes: Traditional waste management systems present a key competitive challenge, although smart solutions offer superior efficiency and cost-effectiveness.
- End-User Demographics: Municipal corporations, commercial establishments, and industrial facilities are the primary end-users.
- M&A Activities: The market has witnessed several mergers and acquisitions (M&A) deals in recent years, with a total estimated value exceeding $xx million between 2019 and 2024. These deals have primarily focused on expanding technological capabilities and geographical reach.
Smart Waste Management Solution Market Dynamics & Trends
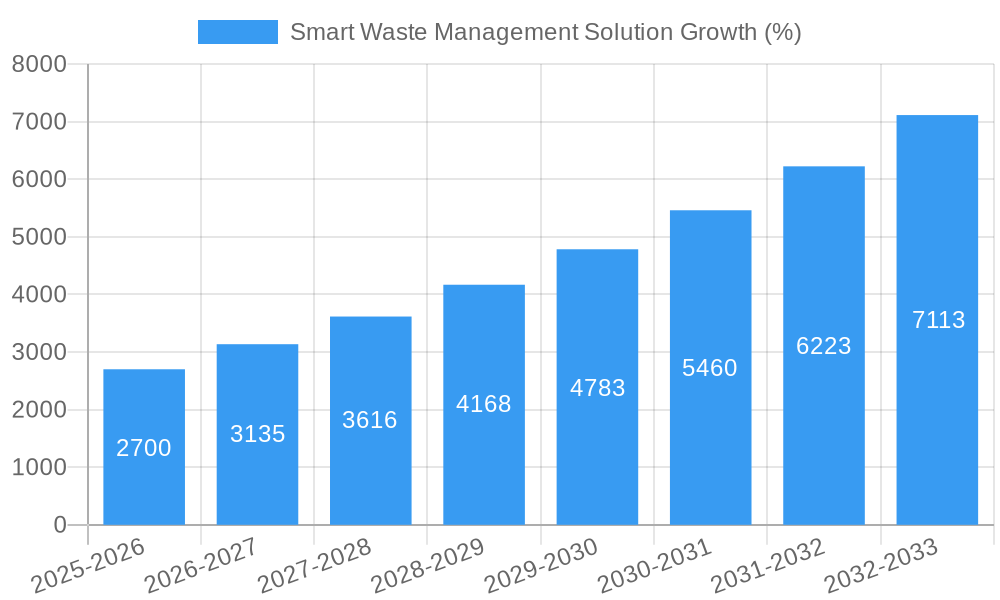
The global smart waste management solution market is experiencing robust growth, driven by several key factors. The Compound Annual Growth Rate (CAGR) is projected at xx% during the forecast period (2025-2033). Market penetration is expected to increase significantly, driven by:
- Technological Disruptions: Advancements in sensor technology, AI, and data analytics are revolutionizing waste management practices.
- Consumer Preferences: Growing environmental awareness among consumers is fueling demand for sustainable waste management solutions.
- Competitive Dynamics: The market is highly competitive, with companies constantly innovating to improve their offerings and gain market share. This includes strategic partnerships, product diversification, and geographical expansion.
- Market Growth Drivers: The increasing volume of waste generated globally, coupled with the need for efficient and sustainable waste management practices, is a primary growth driver. Smart waste management solutions offer significant improvements in efficiency, cost reduction, and environmental sustainability.
Dominant Regions & Segments in Smart Waste Management Solution
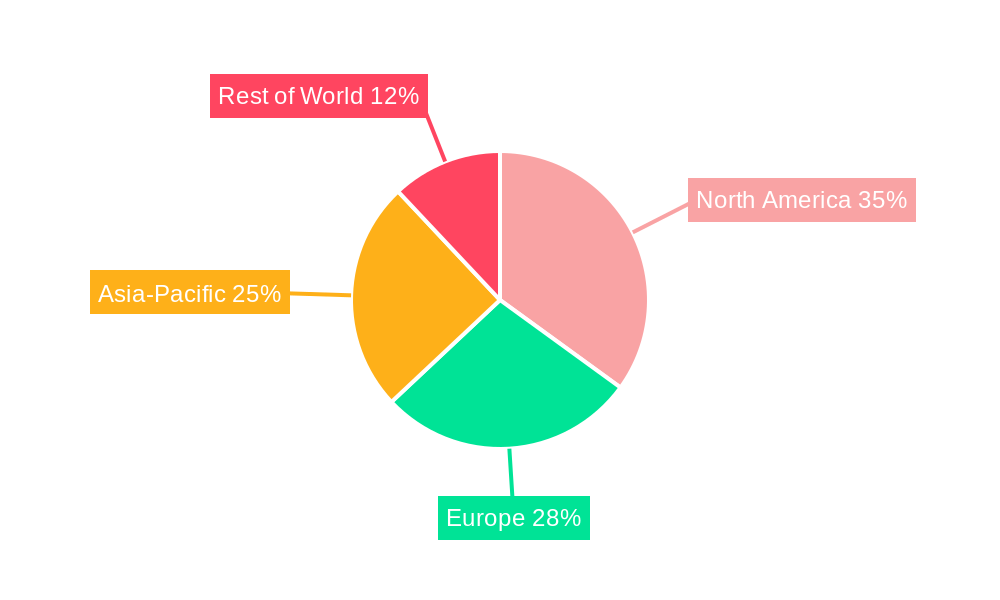
North America currently holds the largest market share in the smart waste management solution market, followed by Europe and Asia-Pacific. This dominance is primarily attributed to:
- North America: Strong government support for smart city initiatives, high technological adoption rates, and a well-established waste management infrastructure.
- Europe: Stringent environmental regulations, increasing urbanization, and significant investments in smart city projects.
- Asia-Pacific: Rapid urbanization, rising environmental concerns, and a growing need for efficient waste management solutions are driving market growth in this region.
Key Drivers:
- Economic Policies: Government incentives and funding programs supporting the adoption of smart waste management solutions.
- Infrastructure: Investments in advanced infrastructure, such as smart sensors and data networks, are essential for the successful implementation of these solutions.
- Technological Advancements: Continuous innovation in sensor technologies, AI, and data analytics is improving the efficiency and effectiveness of smart waste management systems.
Smart Waste Management Solution Product Innovations
Recent years have witnessed significant product innovations in the smart waste management sector. New products incorporate advanced features like real-time waste level monitoring, optimized waste collection routes, and predictive maintenance capabilities. These advancements provide improved operational efficiency, reduced costs, and enhanced environmental sustainability. The market is seeing increasing integration of AI and IoT technologies for real-time data analysis and decision-making. This leads to more effective waste management strategies and reduced environmental impact.
Report Scope & Segmentation Analysis
This report segments the smart waste management solution market based on solution type (e.g., smart bins, waste compaction systems, software platforms), deployment type (cloud-based, on-premise), application (residential, commercial, industrial), and geography (North America, Europe, Asia-Pacific, etc.). Each segment presents unique growth projections, market sizes, and competitive dynamics, providing detailed insights for strategic planning. For example, the smart bins segment is projected to witness significant growth driven by increasing adoption in urban areas.
Key Drivers of Smart Waste Management Solution Growth
The growth of the smart waste management solution market is driven by a convergence of factors:
- Technological Advancements: The development of advanced sensors, IoT devices, and AI algorithms is enabling real-time monitoring and optimization of waste management processes.
- Economic Benefits: Improved efficiency, reduced labor costs, and optimized waste collection routes contribute to significant cost savings for municipalities and businesses.
- Environmental Regulations: Stringent environmental regulations are pushing organizations towards more sustainable waste management practices.
Challenges in the Smart Waste Management Solution Sector
The smart waste management solution sector faces several challenges:
- High Initial Investment Costs: The implementation of smart waste management systems requires a significant upfront investment, potentially hindering adoption in resource-constrained regions.
- Data Security and Privacy Concerns: The collection and storage of sensitive data raise concerns about data security and privacy, requiring robust security measures.
- Integration Challenges: Integrating smart waste management systems with existing waste management infrastructure can be complex and time-consuming.
Emerging Opportunities in Smart Waste Management Solution
Several emerging opportunities are shaping the future of the smart waste management solution market:
- Expansion into New Markets: Developing economies present significant growth potential for smart waste management solutions.
- Integration with Smart City Initiatives: Smart waste management solutions are increasingly becoming an integral part of broader smart city initiatives.
- Development of Innovative Solutions: Continuous innovation in areas such as waste sorting, recycling, and anaerobic digestion is creating new opportunities.
Leading Players in the Smart Waste Management Solution Market
Key Developments in Smart Waste Management Solution Industry
- 2022 Q4: Compology launched a new AI-powered waste management platform.
- 2023 Q1: Enevo secured a major contract with a large municipal corporation for smart waste bin deployment.
- 2023 Q2: Bigbelly Solar partnered with a technology company to integrate advanced sensor technology into its smart bins.
- (Add other developments as available)
Future Outlook for Smart Waste Management Solution Market
The future outlook for the smart waste management solution market is positive, driven by continued technological innovation, increasing environmental awareness, and supportive government policies. The market is expected to witness significant growth, driven by expansion into new markets, integration with smart city initiatives, and the development of innovative solutions addressing the challenges of waste management in an increasingly urbanized world. Strategic opportunities exist for companies that can successfully innovate, adapt, and meet the evolving needs of the market.
Smart Waste Management Solution Segmentation
-
1. Application
- 1.1. Public Occasion
- 1.2. Non-Public Occasion
-
2. Types
- 2.1. Software
- 2.2. Hardware
- 2.3. Service
Smart Waste Management Solution Segmentation By Geography
-
1. North America
- 1.1. United States
- 1.2. Canada
- 1.3. Mexico
-
2. South America
- 2.1. Brazil
- 2.2. Argentina
- 2.3. Rest of South America
-
3. Europe
- 3.1. United Kingdom
- 3.2. Germany
- 3.3. France
- 3.4. Italy
- 3.5. Spain
- 3.6. Russia
- 3.7. Benelux
- 3.8. Nordics
- 3.9. Rest of Europe
-
4. Middle East & Africa
- 4.1. Turkey
- 4.2. Israel
- 4.3. GCC
- 4.4. North Africa
- 4.5. South Africa
- 4.6. Rest of Middle East & Africa
-
5. Asia Pacific
- 5.1. China
- 5.2. India
- 5.3. Japan
- 5.4. South Korea
- 5.5. ASEAN
- 5.6. Oceania
- 5.7. Rest of Asia Pacific
Smart Waste Management Solution REPORT HIGHLIGHTS
| Aspects | Details |
|---|---|
| Study Period | 2019-2033 |
| Base Year | 2024 |
| Estimated Year | 2025 |
| Forecast Period | 2025-2033 |
| Historical Period | 2019-2024 |
| Growth Rate | CAGR of 15% from 2019-2033 |
| Segmentation |
|
Table of Contents
- 1. Introduction
- 1.1. Research Scope
- 1.2. Market Segmentation
- 1.3. Research Methodology
- 1.4. Definitions and Assumptions
- 2. Executive Summary
- 2.1. Introduction
- 3. Market Dynamics
- 3.1. Introduction
- 3.2. Market Drivers
- 3.3. Market Restrains
- 3.4. Market Trends
- 4. Market Factor Analysis
- 4.1. Porters Five Forces
- 4.2. Supply/Value Chain
- 4.3. PESTEL analysis
- 4.4. Market Entropy
- 4.5. Patent/Trademark Analysis
- 5. Global Smart Waste Management Solution Analysis, Insights and Forecast, 2019-2031
- 5.1. Market Analysis, Insights and Forecast - by Application
- 5.1.1. Public Occasion
- 5.1.2. Non-Public Occasion
- 5.2. Market Analysis, Insights and Forecast - by Types
- 5.2.1. Software
- 5.2.2. Hardware
- 5.2.3. Service
- 5.3. Market Analysis, Insights and Forecast - by Region
- 5.3.1. North America
- 5.3.2. South America
- 5.3.3. Europe
- 5.3.4. Middle East & Africa
- 5.3.5. Asia Pacific
- 5.1. Market Analysis, Insights and Forecast - by Application
- 6. North America Smart Waste Management Solution Analysis, Insights and Forecast, 2019-2031
- 6.1. Market Analysis, Insights and Forecast - by Application
- 6.1.1. Public Occasion
- 6.1.2. Non-Public Occasion
- 6.2. Market Analysis, Insights and Forecast - by Types
- 6.2.1. Software
- 6.2.2. Hardware
- 6.2.3. Service
- 6.1. Market Analysis, Insights and Forecast - by Application
- 7. South America Smart Waste Management Solution Analysis, Insights and Forecast, 2019-2031
- 7.1. Market Analysis, Insights and Forecast - by Application
- 7.1.1. Public Occasion
- 7.1.2. Non-Public Occasion
- 7.2. Market Analysis, Insights and Forecast - by Types
- 7.2.1. Software
- 7.2.2. Hardware
- 7.2.3. Service
- 7.1. Market Analysis, Insights and Forecast - by Application
- 8. Europe Smart Waste Management Solution Analysis, Insights and Forecast, 2019-2031
- 8.1. Market Analysis, Insights and Forecast - by Application
- 8.1.1. Public Occasion
- 8.1.2. Non-Public Occasion
- 8.2. Market Analysis, Insights and Forecast - by Types
- 8.2.1. Software
- 8.2.2. Hardware
- 8.2.3. Service
- 8.1. Market Analysis, Insights and Forecast - by Application
- 9. Middle East & Africa Smart Waste Management Solution Analysis, Insights and Forecast, 2019-2031
- 9.1. Market Analysis, Insights and Forecast - by Application
- 9.1.1. Public Occasion
- 9.1.2. Non-Public Occasion
- 9.2. Market Analysis, Insights and Forecast - by Types
- 9.2.1. Software
- 9.2.2. Hardware
- 9.2.3. Service
- 9.1. Market Analysis, Insights and Forecast - by Application
- 10. Asia Pacific Smart Waste Management Solution Analysis, Insights and Forecast, 2019-2031
- 10.1. Market Analysis, Insights and Forecast - by Application
- 10.1.1. Public Occasion
- 10.1.2. Non-Public Occasion
- 10.2. Market Analysis, Insights and Forecast - by Types
- 10.2.1. Software
- 10.2.2. Hardware
- 10.2.3. Service
- 10.1. Market Analysis, Insights and Forecast - by Application
- 11. Competitive Analysis
- 11.1. Global Market Share Analysis 2024
- 11.2. Company Profiles
- 11.2.1 Bigbelly Solar
- 11.2.1.1. Overview
- 11.2.1.2. Products
- 11.2.1.3. SWOT Analysis
- 11.2.1.4. Recent Developments
- 11.2.1.5. Financials (Based on Availability)
- 11.2.2 OnePlus Systems
- 11.2.2.1. Overview
- 11.2.2.2. Products
- 11.2.2.3. SWOT Analysis
- 11.2.2.4. Recent Developments
- 11.2.2.5. Financials (Based on Availability)
- 11.2.3 Compology
- 11.2.3.1. Overview
- 11.2.3.2. Products
- 11.2.3.3. SWOT Analysis
- 11.2.3.4. Recent Developments
- 11.2.3.5. Financials (Based on Availability)
- 11.2.4 Enevo
- 11.2.4.1. Overview
- 11.2.4.2. Products
- 11.2.4.3. SWOT Analysis
- 11.2.4.4. Recent Developments
- 11.2.4.5. Financials (Based on Availability)
- 11.2.5 SmartBin
- 11.2.5.1. Overview
- 11.2.5.2. Products
- 11.2.5.3. SWOT Analysis
- 11.2.5.4. Recent Developments
- 11.2.5.5. Financials (Based on Availability)
- 11.2.6 Urbiotica
- 11.2.6.1. Overview
- 11.2.6.2. Products
- 11.2.6.3. SWOT Analysis
- 11.2.6.4. Recent Developments
- 11.2.6.5. Financials (Based on Availability)
- 11.2.7 IoTsens
- 11.2.7.1. Overview
- 11.2.7.2. Products
- 11.2.7.3. SWOT Analysis
- 11.2.7.4. Recent Developments
- 11.2.7.5. Financials (Based on Availability)
- 11.2.1 Bigbelly Solar
List of Figures
- Figure 1: Global Smart Waste Management Solution Revenue Breakdown (million, %) by Region 2024 & 2032
- Figure 2: North America Smart Waste Management Solution Revenue (million), by Application 2024 & 2032
- Figure 3: North America Smart Waste Management Solution Revenue Share (%), by Application 2024 & 2032
- Figure 4: North America Smart Waste Management Solution Revenue (million), by Types 2024 & 2032
- Figure 5: North America Smart Waste Management Solution Revenue Share (%), by Types 2024 & 2032
- Figure 6: North America Smart Waste Management Solution Revenue (million), by Country 2024 & 2032
- Figure 7: North America Smart Waste Management Solution Revenue Share (%), by Country 2024 & 2032
- Figure 8: South America Smart Waste Management Solution Revenue (million), by Application 2024 & 2032
- Figure 9: South America Smart Waste Management Solution Revenue Share (%), by Application 2024 & 2032
- Figure 10: South America Smart Waste Management Solution Revenue (million), by Types 2024 & 2032
- Figure 11: South America Smart Waste Management Solution Revenue Share (%), by Types 2024 & 2032
- Figure 12: South America Smart Waste Management Solution Revenue (million), by Country 2024 & 2032
- Figure 13: South America Smart Waste Management Solution Revenue Share (%), by Country 2024 & 2032
- Figure 14: Europe Smart Waste Management Solution Revenue (million), by Application 2024 & 2032
- Figure 15: Europe Smart Waste Management Solution Revenue Share (%), by Application 2024 & 2032
- Figure 16: Europe Smart Waste Management Solution Revenue (million), by Types 2024 & 2032
- Figure 17: Europe Smart Waste Management Solution Revenue Share (%), by Types 2024 & 2032
- Figure 18: Europe Smart Waste Management Solution Revenue (million), by Country 2024 & 2032
- Figure 19: Europe Smart Waste Management Solution Revenue Share (%), by Country 2024 & 2032
- Figure 20: Middle East & Africa Smart Waste Management Solution Revenue (million), by Application 2024 & 2032
- Figure 21: Middle East & Africa Smart Waste Management Solution Revenue Share (%), by Application 2024 & 2032
- Figure 22: Middle East & Africa Smart Waste Management Solution Revenue (million), by Types 2024 & 2032
- Figure 23: Middle East & Africa Smart Waste Management Solution Revenue Share (%), by Types 2024 & 2032
- Figure 24: Middle East & Africa Smart Waste Management Solution Revenue (million), by Country 2024 & 2032
- Figure 25: Middle East & Africa Smart Waste Management Solution Revenue Share (%), by Country 2024 & 2032
- Figure 26: Asia Pacific Smart Waste Management Solution Revenue (million), by Application 2024 & 2032
- Figure 27: Asia Pacific Smart Waste Management Solution Revenue Share (%), by Application 2024 & 2032
- Figure 28: Asia Pacific Smart Waste Management Solution Revenue (million), by Types 2024 & 2032
- Figure 29: Asia Pacific Smart Waste Management Solution Revenue Share (%), by Types 2024 & 2032
- Figure 30: Asia Pacific Smart Waste Management Solution Revenue (million), by Country 2024 & 2032
- Figure 31: Asia Pacific Smart Waste Management Solution Revenue Share (%), by Country 2024 & 2032
List of Tables
- Table 1: Global Smart Waste Management Solution Revenue million Forecast, by Region 2019 & 2032
- Table 2: Global Smart Waste Management Solution Revenue million Forecast, by Application 2019 & 2032
- Table 3: Global Smart Waste Management Solution Revenue million Forecast, by Types 2019 & 2032
- Table 4: Global Smart Waste Management Solution Revenue million Forecast, by Region 2019 & 2032
- Table 5: Global Smart Waste Management Solution Revenue million Forecast, by Application 2019 & 2032
- Table 6: Global Smart Waste Management Solution Revenue million Forecast, by Types 2019 & 2032
- Table 7: Global Smart Waste Management Solution Revenue million Forecast, by Country 2019 & 2032
- Table 8: United States Smart Waste Management Solution Revenue (million) Forecast, by Application 2019 & 2032
- Table 9: Canada Smart Waste Management Solution Revenue (million) Forecast, by Application 2019 & 2032
- Table 10: Mexico Smart Waste Management Solution Revenue (million) Forecast, by Application 2019 & 2032
- Table 11: Global Smart Waste Management Solution Revenue million Forecast, by Application 2019 & 2032
- Table 12: Global Smart Waste Management Solution Revenue million Forecast, by Types 2019 & 2032
- Table 13: Global Smart Waste Management Solution Revenue million Forecast, by Country 2019 & 2032
- Table 14: Brazil Smart Waste Management Solution Revenue (million) Forecast, by Application 2019 & 2032
- Table 15: Argentina Smart Waste Management Solution Revenue (million) Forecast, by Application 2019 & 2032
- Table 16: Rest of South America Smart Waste Management Solution Revenue (million) Forecast, by Application 2019 & 2032
- Table 17: Global Smart Waste Management Solution Revenue million Forecast, by Application 2019 & 2032
- Table 18: Global Smart Waste Management Solution Revenue million Forecast, by Types 2019 & 2032
- Table 19: Global Smart Waste Management Solution Revenue million Forecast, by Country 2019 & 2032
- Table 20: United Kingdom Smart Waste Management Solution Revenue (million) Forecast, by Application 2019 & 2032
- Table 21: Germany Smart Waste Management Solution Revenue (million) Forecast, by Application 2019 & 2032
- Table 22: France Smart Waste Management Solution Revenue (million) Forecast, by Application 2019 & 2032
- Table 23: Italy Smart Waste Management Solution Revenue (million) Forecast, by Application 2019 & 2032
- Table 24: Spain Smart Waste Management Solution Revenue (million) Forecast, by Application 2019 & 2032
- Table 25: Russia Smart Waste Management Solution Revenue (million) Forecast, by Application 2019 & 2032
- Table 26: Benelux Smart Waste Management Solution Revenue (million) Forecast, by Application 2019 & 2032
- Table 27: Nordics Smart Waste Management Solution Revenue (million) Forecast, by Application 2019 & 2032
- Table 28: Rest of Europe Smart Waste Management Solution Revenue (million) Forecast, by Application 2019 & 2032
- Table 29: Global Smart Waste Management Solution Revenue million Forecast, by Application 2019 & 2032
- Table 30: Global Smart Waste Management Solution Revenue million Forecast, by Types 2019 & 2032
- Table 31: Global Smart Waste Management Solution Revenue million Forecast, by Country 2019 & 2032
- Table 32: Turkey Smart Waste Management Solution Revenue (million) Forecast, by Application 2019 & 2032
- Table 33: Israel Smart Waste Management Solution Revenue (million) Forecast, by Application 2019 & 2032
- Table 34: GCC Smart Waste Management Solution Revenue (million) Forecast, by Application 2019 & 2032
- Table 35: North Africa Smart Waste Management Solution Revenue (million) Forecast, by Application 2019 & 2032
- Table 36: South Africa Smart Waste Management Solution Revenue (million) Forecast, by Application 2019 & 2032
- Table 37: Rest of Middle East & Africa Smart Waste Management Solution Revenue (million) Forecast, by Application 2019 & 2032
- Table 38: Global Smart Waste Management Solution Revenue million Forecast, by Application 2019 & 2032
- Table 39: Global Smart Waste Management Solution Revenue million Forecast, by Types 2019 & 2032
- Table 40: Global Smart Waste Management Solution Revenue million Forecast, by Country 2019 & 2032
- Table 41: China Smart Waste Management Solution Revenue (million) Forecast, by Application 2019 & 2032
- Table 42: India Smart Waste Management Solution Revenue (million) Forecast, by Application 2019 & 2032
- Table 43: Japan Smart Waste Management Solution Revenue (million) Forecast, by Application 2019 & 2032
- Table 44: South Korea Smart Waste Management Solution Revenue (million) Forecast, by Application 2019 & 2032
- Table 45: ASEAN Smart Waste Management Solution Revenue (million) Forecast, by Application 2019 & 2032
- Table 46: Oceania Smart Waste Management Solution Revenue (million) Forecast, by Application 2019 & 2032
- Table 47: Rest of Asia Pacific Smart Waste Management Solution Revenue (million) Forecast, by Application 2019 & 2032
Frequently Asked Questions
1. What is the projected Compound Annual Growth Rate (CAGR) of the Smart Waste Management Solution?
The projected CAGR is approximately 15%.
2. Which companies are prominent players in the Smart Waste Management Solution?
Key companies in the market include Bigbelly Solar, OnePlus Systems, Compology, Enevo, SmartBin, Urbiotica, IoTsens.
3. What are the main segments of the Smart Waste Management Solution?
The market segments include Application, Types.
4. Can you provide details about the market size?
The market size is estimated to be USD 18 million as of 2022.
5. What are some drivers contributing to market growth?
N/A
6. What are the notable trends driving market growth?
N/A
7. Are there any restraints impacting market growth?
N/A
8. Can you provide examples of recent developments in the market?
N/A
9. What pricing options are available for accessing the report?
Pricing options include single-user, multi-user, and enterprise licenses priced at USD 3950.00, USD 5925.00, and USD 7900.00 respectively.
10. Is the market size provided in terms of value or volume?
The market size is provided in terms of value, measured in million.
11. Are there any specific market keywords associated with the report?
Yes, the market keyword associated with the report is "Smart Waste Management Solution," which aids in identifying and referencing the specific market segment covered.
12. How do I determine which pricing option suits my needs best?
The pricing options vary based on user requirements and access needs. Individual users may opt for single-user licenses, while businesses requiring broader access may choose multi-user or enterprise licenses for cost-effective access to the report.
13. Are there any additional resources or data provided in the Smart Waste Management Solution report?
While the report offers comprehensive insights, it's advisable to review the specific contents or supplementary materials provided to ascertain if additional resources or data are available.
14. How can I stay updated on further developments or reports in the Smart Waste Management Solution?
To stay informed about further developments, trends, and reports in the Smart Waste Management Solution, consider subscribing to industry newsletters, following relevant companies and organizations, or regularly checking reputable industry news sources and publications.
Methodology
Step 1 - Identification of Relevant Samples Size from Population Database


Step 2 - Approaches for Defining Global Market Size (Value, Volume* & Price*)

Note*: In applicable scenarios
Step 3 - Data Sources
Primary Research
- Web Analytics
- Survey Reports
- Research Institute
- Latest Research Reports
- Opinion Leaders
Secondary Research
- Annual Reports
- White Paper
- Latest Press Release
- Industry Association
- Paid Database
- Investor Presentations

Step 4 - Data Triangulation
Involves using different sources of information in order to increase the validity of a study
These sources are likely to be stakeholders in a program - participants, other researchers, program staff, other community members, and so on.
Then we put all data in single framework & apply various statistical tools to find out the dynamic on the market.
During the analysis stage, feedback from the stakeholder groups would be compared to determine areas of agreement as well as areas of divergence


