
Key Insights
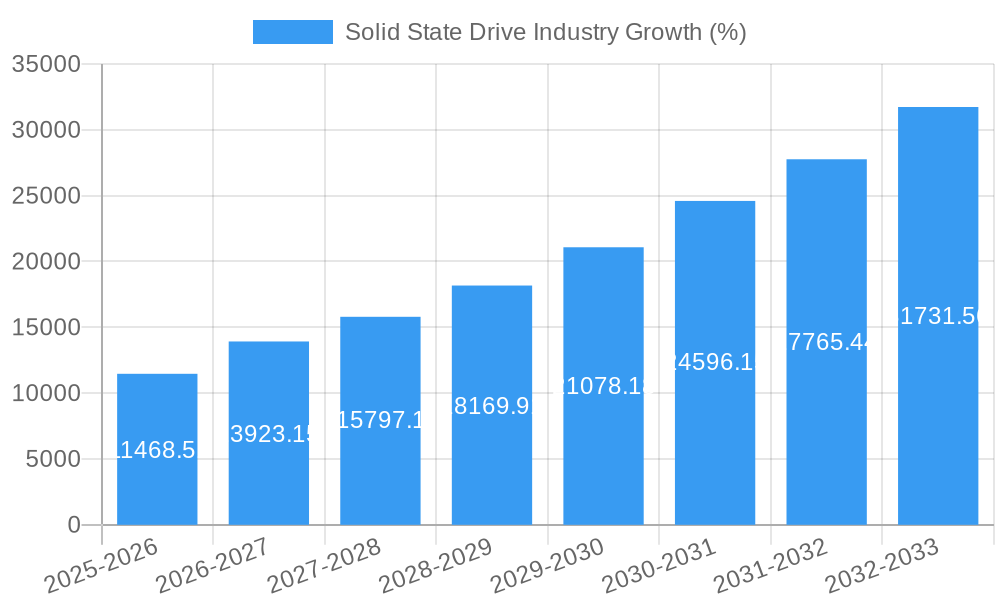
The Solid State Drive (SSD) market is experiencing robust growth, projected to reach $65.47 billion in 2025 and maintain a Compound Annual Growth Rate (CAGR) of 17.56% from 2025 to 2033. This expansion is driven by several key factors. The increasing demand for faster data storage and processing speeds across enterprise and client applications is a primary driver. The transition from traditional hard disk drives (HDDs) to SSDs is accelerating, fueled by the superior performance, durability, and power efficiency offered by SSD technology. Furthermore, advancements in SSD interface technologies like PCIe are enabling higher data transfer rates and enhancing overall system performance, further stimulating market growth. The rising adoption of cloud computing and big data analytics also contributes significantly to the increased demand for high-performance storage solutions like SSDs. Segment-wise, the PCIe interface SSDs are anticipated to dominate the market due to their speed advantage, while the enterprise sector is projected to witness higher growth compared to the client segment owing to the significant data storage requirements of large organizations. Geographic growth is largely driven by regions with strong technological adoption rates and substantial investments in data infrastructure, with North America and Asia-Pacific leading the charge.
Despite the positive outlook, certain challenges could temper the growth trajectory. Price remains a significant factor, especially for high-capacity SSDs, potentially limiting adoption in price-sensitive markets. The availability of alternative storage solutions and the potential for technological disruptions could also impact future growth. However, continuous innovation in SSD technology, focusing on increased storage density, improved power efficiency, and cost reductions, is expected to overcome these challenges and sustain market expansion in the long term. The competitive landscape is characterized by established players like Samsung, Western Digital, and Micron, who are constantly innovating to maintain their market share, while new entrants are continuously emerging, further intensifying the competition.

Solid State Drive (SSD) Industry Market Report: 2019-2033
This comprehensive report provides an in-depth analysis of the global Solid State Drive (SSD) industry, covering market structure, dynamics, leading players, and future trends. With a study period spanning 2019-2033, a base year of 2025, and a forecast period of 2025-2033, this report is an essential resource for industry professionals, investors, and anyone seeking to understand the evolving landscape of SSD technology. The report incorporates data from key players like Samsung Group, Seagate Technology LLC, Micron Technology Inc, and more. Market sizes are expressed in Millions.
Solid State Drive Industry Market Structure & Innovation Trends
This section analyzes the competitive landscape of the SSD market, exploring market concentration, innovation drivers, regulatory influences, and mergers and acquisitions (M&A) activity from 2019 to 2024.
Market Concentration: The SSD market is moderately concentrated, with a few major players holding significant market share. Samsung Group, Western Digital Corporation, and SK Hynix Inc are among the leading players, collectively controlling an estimated xx Million market share in 2024. Smaller players like Micron Technology Inc, ADATA Technology Co Ltd, and Kingston Technology Corporation compete primarily through specialized product offerings or niche market segments.
Innovation Drivers: The primary drivers of innovation include increasing demand for higher storage capacities, faster data transfer speeds, and improved power efficiency. The adoption of advanced technologies like PCIe 5.0 and 3D NAND flash memory is driving significant advancements in SSD performance and cost reduction.
Regulatory Frameworks: Government regulations regarding data privacy and security are influencing the development of secure SSDs with enhanced encryption capabilities. Furthermore, environmental regulations are driving the development of more energy-efficient SSDs.
Product Substitutes: While traditional hard disk drives (HDDs) remain a viable alternative, the performance and durability advantages of SSDs are leading to their increased adoption across various applications.
End-User Demographics: The primary end-users of SSDs include consumers (for personal computers and laptops), enterprises (for data centers and servers), and various industry sectors (e.g., automotive, healthcare, and industrial automation).
M&A Activities: The SSD industry has witnessed significant M&A activity in recent years, with deals focused on expanding market reach, acquiring advanced technologies, and strengthening vertical integration. The total value of M&A deals in the historical period (2019-2024) is estimated at xx Million.
Solid State Drive Industry Market Dynamics & Trends
This section delves into the market dynamics influencing SSD growth, including technological advancements, consumer preferences, and competitive dynamics. The market is experiencing robust growth, with a Compound Annual Growth Rate (CAGR) of xx% projected from 2025 to 2033, driven by factors like increasing data generation, growing demand for cloud storage, and the proliferation of mobile and IoT devices. Market penetration is expected to reach xx% by 2033. Technological disruptions, such as the transition from SATA to PCIe interfaces and the adoption of NVMe technology, are continuously shaping the competitive landscape.
Dominant Regions & Segments in Solid State Drive Industry
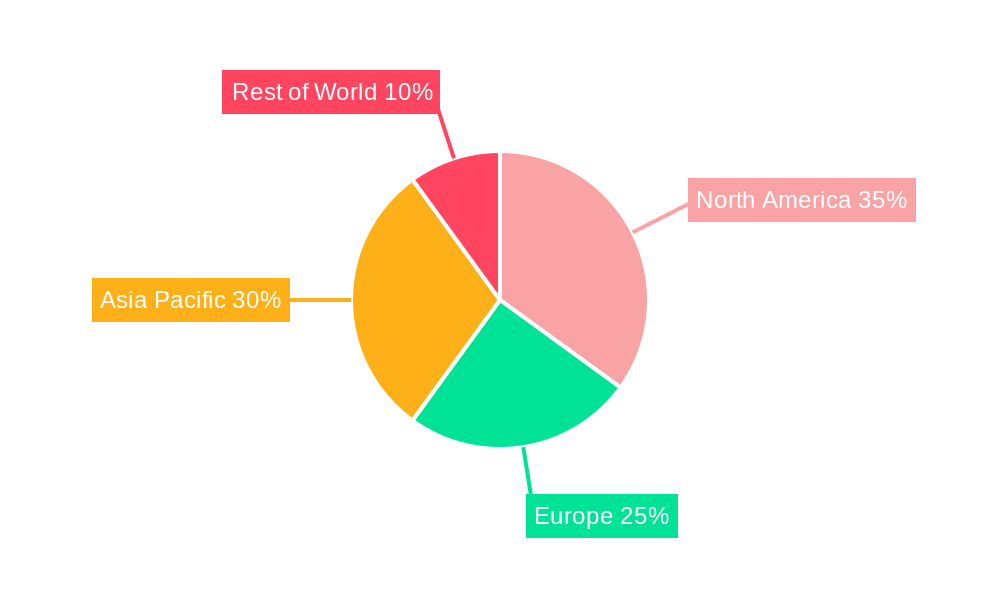
This section identifies the leading regions and segments within the SSD market. Analysis indicates that North America and Asia-Pacific are the dominant regions, fueled by robust technological advancements, substantial IT infrastructure investment, and expanding end-user applications.
Key Drivers:
- North America: Strong demand from data centers and enterprise users, coupled with advanced technological capabilities and supportive government policies.
- Asia-Pacific: Rapid growth in consumer electronics and data center infrastructure, along with increasing investments in emerging technologies.
Segment Dominance:
- By SSD Interface: PCIe interfaces are gaining significant traction due to their superior performance, outpacing SATA and SAS interfaces in terms of growth. The PCIe segment is anticipated to lead the market in the forecast period.
- By Application: The Enterprise segment dominates the market owing to the high storage requirements of data centers and enterprise applications. Client SSD sales exhibit significant growth, yet their market share remains below that of the enterprise sector.
Solid State Drive Industry Product Innovations
Recent product developments highlight the ongoing trend towards faster, higher-capacity, and more energy-efficient SSDs. New generations of 3D NAND flash memory are significantly improving density and performance, while the adoption of PCIe 5.0 technology is enabling unprecedented data transfer speeds. These advancements directly cater to the demands of data centers and high-performance computing applications.
Report Scope & Segmentation Analysis
This report segments the SSD market by SSD Interface (SATA, SAS, PCIe) and by Application (Enterprise, Client). Each segment features detailed analysis of market size, growth projections, and competitive dynamics. The PCIe segment is projected to experience the highest growth due to its superior performance capabilities. The Enterprise segment is anticipated to maintain its market dominance due to the growing demand for high-capacity storage solutions in data centers and enterprise applications.
Key Drivers of Solid State Drive Industry Growth
The growth of the SSD industry is propelled by several factors, including:
- Technological Advancements: Continuous improvement in NAND flash technology, leading to higher densities, faster speeds, and lower costs.
- Data Explosion: The ever-increasing volume of data generated requires higher-capacity and faster storage solutions.
- Cloud Computing: The growth of cloud computing services is driving demand for high-performance storage infrastructure in data centers.
Challenges in the Solid State Drive Industry Sector
The SSD industry faces various challenges, including:
- Supply Chain Disruptions: Geopolitical events and natural disasters can cause significant disruptions to the supply chain, impacting production and pricing.
- Price Volatility: The pricing of NAND flash memory can be volatile, affecting the profitability of SSD manufacturers.
- Intense Competition: The SSD market is highly competitive, with established players and emerging companies vying for market share.
Emerging Opportunities in Solid State Drive Industry
Several opportunities are emerging in the SSD industry, including:
- New Applications: The increasing adoption of SSDs in new applications such as autonomous vehicles, industrial automation, and high-performance computing.
- Next-Generation Technologies: Emerging technologies such as NVMe-oF and CXL are creating new opportunities for SSD manufacturers.
- Emerging Markets: Expanding market penetration in developing countries presents significant growth potential.
Leading Players in the Solid State Drive Industry Market
- Samsung Group
- Seagate Technology LLC
- Micron Technology Inc
- Transcend Information Inc
- ADATA Technology Co Ltd
- Western Digital Corporation
- SK Hynix Inc
- Teclast Electronics Co Limite
- Kingston Technology Corporation
- Intel Corporation
Key Developments in Solid State Drive Industry
- July 2022: Kioxia announces new speed levels with its Enterprise NVMe SSD family, utilizing PCIe 5.0 technology. This significantly enhances data center performance.
- July 2022: Innodisk releases new 2.5" SATA and M.2 SSDs optimized for edge AI applications, focusing on low latency and high DWPD.
- June 2022: Micron introduces the 5400 SATA SSD, leveraging 176-layer NAND technology for critical infrastructure applications.
- April 2022: SK Hynix and Solidigm introduce solid-state SSDs for data centers, utilizing SK Hynix's 128-layer NAND flash innovation.
Future Outlook for Solid State Drive Industry Market
The future of the SSD industry appears bright, driven by sustained technological advancements, escalating data demands, and the increasing adoption of cloud computing. Strategic opportunities lie in developing high-capacity, high-performance SSDs that cater to the demands of emerging applications such as artificial intelligence, machine learning, and the Internet of Things. The market is poised for continued expansion, with substantial growth potential across diverse segments and geographical regions.
Solid State Drive Industry Segmentation
-
1. SSD I
- 1.1. SATA
- 1.2. SAS
- 1.3. PCIE
-
2. Appli
- 2.1. Enterprise
- 2.2. Client
Solid State Drive Industry Segmentation By Geography
-
1. North America
- 1.1. United States
- 1.2. Canada
-
2. Europe
- 2.1. Germany
- 2.2. United Kingdom
- 2.3. France
-
3. Asia
- 3.1. China
- 3.2. Taiwan
- 3.3. South Korea
- 4. Australia and New Zealand
- 5. Latin America
- 6. Middle East and Africa
Solid State Drive Industry REPORT HIGHLIGHTS
| Aspects | Details |
|---|---|
| Study Period | 2019-2033 |
| Base Year | 2024 |
| Estimated Year | 2025 |
| Forecast Period | 2025-2033 |
| Historical Period | 2019-2024 |
| Growth Rate | CAGR of 17.56% from 2019-2033 |
| Segmentation |
|
Table of Contents
- 1. Introduction
- 1.1. Research Scope
- 1.2. Market Segmentation
- 1.3. Research Methodology
- 1.4. Definitions and Assumptions
- 2. Executive Summary
- 2.1. Introduction
- 3. Market Dynamics
- 3.1. Introduction
- 3.2. Market Drivers
- 3.2.1. 4.; Growing Adoption in Data Center Applications4.; High Demand from the High-end Cloud Segment 4.; Greater Utility of SSD over HDD in Key Verticals
- 3.3. Market Restrains
- 3.3.1. Slow Pace in Development of Applications Despite Heavy investments in R&D; Commplexities in Hardware Designing
- 3.4. Market Trends
- 3.4.1. Rising Demand from Enterprise Segment to Augment the Market Growth
- 4. Market Factor Analysis
- 4.1. Porters Five Forces
- 4.2. Supply/Value Chain
- 4.3. PESTEL analysis
- 4.4. Market Entropy
- 4.5. Patent/Trademark Analysis
- 5. Global Solid State Drive Industry Analysis, Insights and Forecast, 2019-2031
- 5.1. Market Analysis, Insights and Forecast - by SSD I
- 5.1.1. SATA
- 5.1.2. SAS
- 5.1.3. PCIE
- 5.2. Market Analysis, Insights and Forecast - by Appli
- 5.2.1. Enterprise
- 5.2.2. Client
- 5.3. Market Analysis, Insights and Forecast - by Region
- 5.3.1. North America
- 5.3.2. Europe
- 5.3.3. Asia
- 5.3.4. Australia and New Zealand
- 5.3.5. Latin America
- 5.3.6. Middle East and Africa
- 5.1. Market Analysis, Insights and Forecast - by SSD I
- 6. North America Solid State Drive Industry Analysis, Insights and Forecast, 2019-2031
- 6.1. Market Analysis, Insights and Forecast - by SSD I
- 6.1.1. SATA
- 6.1.2. SAS
- 6.1.3. PCIE
- 6.2. Market Analysis, Insights and Forecast - by Appli
- 6.2.1. Enterprise
- 6.2.2. Client
- 6.1. Market Analysis, Insights and Forecast - by SSD I
- 7. Europe Solid State Drive Industry Analysis, Insights and Forecast, 2019-2031
- 7.1. Market Analysis, Insights and Forecast - by SSD I
- 7.1.1. SATA
- 7.1.2. SAS
- 7.1.3. PCIE
- 7.2. Market Analysis, Insights and Forecast - by Appli
- 7.2.1. Enterprise
- 7.2.2. Client
- 7.1. Market Analysis, Insights and Forecast - by SSD I
- 8. Asia Solid State Drive Industry Analysis, Insights and Forecast, 2019-2031
- 8.1. Market Analysis, Insights and Forecast - by SSD I
- 8.1.1. SATA
- 8.1.2. SAS
- 8.1.3. PCIE
- 8.2. Market Analysis, Insights and Forecast - by Appli
- 8.2.1. Enterprise
- 8.2.2. Client
- 8.1. Market Analysis, Insights and Forecast - by SSD I
- 9. Australia and New Zealand Solid State Drive Industry Analysis, Insights and Forecast, 2019-2031
- 9.1. Market Analysis, Insights and Forecast - by SSD I
- 9.1.1. SATA
- 9.1.2. SAS
- 9.1.3. PCIE
- 9.2. Market Analysis, Insights and Forecast - by Appli
- 9.2.1. Enterprise
- 9.2.2. Client
- 9.1. Market Analysis, Insights and Forecast - by SSD I
- 10. Latin America Solid State Drive Industry Analysis, Insights and Forecast, 2019-2031
- 10.1. Market Analysis, Insights and Forecast - by SSD I
- 10.1.1. SATA
- 10.1.2. SAS
- 10.1.3. PCIE
- 10.2. Market Analysis, Insights and Forecast - by Appli
- 10.2.1. Enterprise
- 10.2.2. Client
- 10.1. Market Analysis, Insights and Forecast - by SSD I
- 11. Middle East and Africa Solid State Drive Industry Analysis, Insights and Forecast, 2019-2031
- 11.1. Market Analysis, Insights and Forecast - by SSD I
- 11.1.1. SATA
- 11.1.2. SAS
- 11.1.3. PCIE
- 11.2. Market Analysis, Insights and Forecast - by Appli
- 11.2.1. Enterprise
- 11.2.2. Client
- 11.1. Market Analysis, Insights and Forecast - by SSD I
- 12. North America Solid State Drive Industry Analysis, Insights and Forecast, 2019-2031
- 12.1. Market Analysis, Insights and Forecast - By Country/Sub-region
- 12.1.1 United States
- 12.1.2 Canada
- 13. Europe Solid State Drive Industry Analysis, Insights and Forecast, 2019-2031
- 13.1. Market Analysis, Insights and Forecast - By Country/Sub-region
- 13.1.1 Germany
- 13.1.2 United Kingdom
- 13.1.3 France
- 13.1.4 Rest of Europe
- 14. Asia Pacific Solid State Drive Industry Analysis, Insights and Forecast, 2019-2031
- 14.1. Market Analysis, Insights and Forecast - By Country/Sub-region
- 14.1.1 China
- 14.1.2 Taiwan
- 14.1.3 South Korea
- 14.1.4 Rest of Asia Pacific
- 15. Rest of the World Solid State Drive Industry Analysis, Insights and Forecast, 2019-2031
- 15.1. Market Analysis, Insights and Forecast - By Country/Sub-region
- 15.1.1.
- 16. Competitive Analysis
- 16.1. Global Market Share Analysis 2024
- 16.2. Company Profiles
- 16.2.1 Samsung Group
- 16.2.1.1. Overview
- 16.2.1.2. Products
- 16.2.1.3. SWOT Analysis
- 16.2.1.4. Recent Developments
- 16.2.1.5. Financials (Based on Availability)
- 16.2.2 Seagate Technology LLC
- 16.2.2.1. Overview
- 16.2.2.2. Products
- 16.2.2.3. SWOT Analysis
- 16.2.2.4. Recent Developments
- 16.2.2.5. Financials (Based on Availability)
- 16.2.3 Micron Technology Inc
- 16.2.3.1. Overview
- 16.2.3.2. Products
- 16.2.3.3. SWOT Analysis
- 16.2.3.4. Recent Developments
- 16.2.3.5. Financials (Based on Availability)
- 16.2.4 Transcend Information Inc
- 16.2.4.1. Overview
- 16.2.4.2. Products
- 16.2.4.3. SWOT Analysis
- 16.2.4.4. Recent Developments
- 16.2.4.5. Financials (Based on Availability)
- 16.2.5 ADATA Technology Co Ltd
- 16.2.5.1. Overview
- 16.2.5.2. Products
- 16.2.5.3. SWOT Analysis
- 16.2.5.4. Recent Developments
- 16.2.5.5. Financials (Based on Availability)
- 16.2.6 Western Digital Corporation
- 16.2.6.1. Overview
- 16.2.6.2. Products
- 16.2.6.3. SWOT Analysis
- 16.2.6.4. Recent Developments
- 16.2.6.5. Financials (Based on Availability)
- 16.2.7 SK Hynix Inc
- 16.2.7.1. Overview
- 16.2.7.2. Products
- 16.2.7.3. SWOT Analysis
- 16.2.7.4. Recent Developments
- 16.2.7.5. Financials (Based on Availability)
- 16.2.8 Teclast Electronics Co Limite
- 16.2.8.1. Overview
- 16.2.8.2. Products
- 16.2.8.3. SWOT Analysis
- 16.2.8.4. Recent Developments
- 16.2.8.5. Financials (Based on Availability)
- 16.2.9 Kingston Technology Corporation
- 16.2.9.1. Overview
- 16.2.9.2. Products
- 16.2.9.3. SWOT Analysis
- 16.2.9.4. Recent Developments
- 16.2.9.5. Financials (Based on Availability)
- 16.2.10 Intel Corporation
- 16.2.10.1. Overview
- 16.2.10.2. Products
- 16.2.10.3. SWOT Analysis
- 16.2.10.4. Recent Developments
- 16.2.10.5. Financials (Based on Availability)
- 16.2.1 Samsung Group
List of Figures
- Figure 1: Global Solid State Drive Industry Revenue Breakdown (Million, %) by Region 2024 & 2032
- Figure 2: North America Solid State Drive Industry Revenue (Million), by Country 2024 & 2032
- Figure 3: North America Solid State Drive Industry Revenue Share (%), by Country 2024 & 2032
- Figure 4: Europe Solid State Drive Industry Revenue (Million), by Country 2024 & 2032
- Figure 5: Europe Solid State Drive Industry Revenue Share (%), by Country 2024 & 2032
- Figure 6: Asia Pacific Solid State Drive Industry Revenue (Million), by Country 2024 & 2032
- Figure 7: Asia Pacific Solid State Drive Industry Revenue Share (%), by Country 2024 & 2032
- Figure 8: Rest of the World Solid State Drive Industry Revenue (Million), by Country 2024 & 2032
- Figure 9: Rest of the World Solid State Drive Industry Revenue Share (%), by Country 2024 & 2032
- Figure 10: North America Solid State Drive Industry Revenue (Million), by SSD I 2024 & 2032
- Figure 11: North America Solid State Drive Industry Revenue Share (%), by SSD I 2024 & 2032
- Figure 12: North America Solid State Drive Industry Revenue (Million), by Appli 2024 & 2032
- Figure 13: North America Solid State Drive Industry Revenue Share (%), by Appli 2024 & 2032
- Figure 14: North America Solid State Drive Industry Revenue (Million), by Country 2024 & 2032
- Figure 15: North America Solid State Drive Industry Revenue Share (%), by Country 2024 & 2032
- Figure 16: Europe Solid State Drive Industry Revenue (Million), by SSD I 2024 & 2032
- Figure 17: Europe Solid State Drive Industry Revenue Share (%), by SSD I 2024 & 2032
- Figure 18: Europe Solid State Drive Industry Revenue (Million), by Appli 2024 & 2032
- Figure 19: Europe Solid State Drive Industry Revenue Share (%), by Appli 2024 & 2032
- Figure 20: Europe Solid State Drive Industry Revenue (Million), by Country 2024 & 2032
- Figure 21: Europe Solid State Drive Industry Revenue Share (%), by Country 2024 & 2032
- Figure 22: Asia Solid State Drive Industry Revenue (Million), by SSD I 2024 & 2032
- Figure 23: Asia Solid State Drive Industry Revenue Share (%), by SSD I 2024 & 2032
- Figure 24: Asia Solid State Drive Industry Revenue (Million), by Appli 2024 & 2032
- Figure 25: Asia Solid State Drive Industry Revenue Share (%), by Appli 2024 & 2032
- Figure 26: Asia Solid State Drive Industry Revenue (Million), by Country 2024 & 2032
- Figure 27: Asia Solid State Drive Industry Revenue Share (%), by Country 2024 & 2032
- Figure 28: Australia and New Zealand Solid State Drive Industry Revenue (Million), by SSD I 2024 & 2032
- Figure 29: Australia and New Zealand Solid State Drive Industry Revenue Share (%), by SSD I 2024 & 2032
- Figure 30: Australia and New Zealand Solid State Drive Industry Revenue (Million), by Appli 2024 & 2032
- Figure 31: Australia and New Zealand Solid State Drive Industry Revenue Share (%), by Appli 2024 & 2032
- Figure 32: Australia and New Zealand Solid State Drive Industry Revenue (Million), by Country 2024 & 2032
- Figure 33: Australia and New Zealand Solid State Drive Industry Revenue Share (%), by Country 2024 & 2032
- Figure 34: Latin America Solid State Drive Industry Revenue (Million), by SSD I 2024 & 2032
- Figure 35: Latin America Solid State Drive Industry Revenue Share (%), by SSD I 2024 & 2032
- Figure 36: Latin America Solid State Drive Industry Revenue (Million), by Appli 2024 & 2032
- Figure 37: Latin America Solid State Drive Industry Revenue Share (%), by Appli 2024 & 2032
- Figure 38: Latin America Solid State Drive Industry Revenue (Million), by Country 2024 & 2032
- Figure 39: Latin America Solid State Drive Industry Revenue Share (%), by Country 2024 & 2032
- Figure 40: Middle East and Africa Solid State Drive Industry Revenue (Million), by SSD I 2024 & 2032
- Figure 41: Middle East and Africa Solid State Drive Industry Revenue Share (%), by SSD I 2024 & 2032
- Figure 42: Middle East and Africa Solid State Drive Industry Revenue (Million), by Appli 2024 & 2032
- Figure 43: Middle East and Africa Solid State Drive Industry Revenue Share (%), by Appli 2024 & 2032
- Figure 44: Middle East and Africa Solid State Drive Industry Revenue (Million), by Country 2024 & 2032
- Figure 45: Middle East and Africa Solid State Drive Industry Revenue Share (%), by Country 2024 & 2032
List of Tables
- Table 1: Global Solid State Drive Industry Revenue Million Forecast, by Region 2019 & 2032
- Table 2: Global Solid State Drive Industry Revenue Million Forecast, by SSD I 2019 & 2032
- Table 3: Global Solid State Drive Industry Revenue Million Forecast, by Appli 2019 & 2032
- Table 4: Global Solid State Drive Industry Revenue Million Forecast, by Region 2019 & 2032
- Table 5: Global Solid State Drive Industry Revenue Million Forecast, by Country 2019 & 2032
- Table 6: United States Solid State Drive Industry Revenue (Million) Forecast, by Application 2019 & 2032
- Table 7: Canada Solid State Drive Industry Revenue (Million) Forecast, by Application 2019 & 2032
- Table 8: Global Solid State Drive Industry Revenue Million Forecast, by Country 2019 & 2032
- Table 9: Germany Solid State Drive Industry Revenue (Million) Forecast, by Application 2019 & 2032
- Table 10: United Kingdom Solid State Drive Industry Revenue (Million) Forecast, by Application 2019 & 2032
- Table 11: France Solid State Drive Industry Revenue (Million) Forecast, by Application 2019 & 2032
- Table 12: Rest of Europe Solid State Drive Industry Revenue (Million) Forecast, by Application 2019 & 2032
- Table 13: Global Solid State Drive Industry Revenue Million Forecast, by Country 2019 & 2032
- Table 14: China Solid State Drive Industry Revenue (Million) Forecast, by Application 2019 & 2032
- Table 15: Taiwan Solid State Drive Industry Revenue (Million) Forecast, by Application 2019 & 2032
- Table 16: South Korea Solid State Drive Industry Revenue (Million) Forecast, by Application 2019 & 2032
- Table 17: Rest of Asia Pacific Solid State Drive Industry Revenue (Million) Forecast, by Application 2019 & 2032
- Table 18: Global Solid State Drive Industry Revenue Million Forecast, by Country 2019 & 2032
- Table 19: Solid State Drive Industry Revenue (Million) Forecast, by Application 2019 & 2032
- Table 20: Global Solid State Drive Industry Revenue Million Forecast, by SSD I 2019 & 2032
- Table 21: Global Solid State Drive Industry Revenue Million Forecast, by Appli 2019 & 2032
- Table 22: Global Solid State Drive Industry Revenue Million Forecast, by Country 2019 & 2032
- Table 23: United States Solid State Drive Industry Revenue (Million) Forecast, by Application 2019 & 2032
- Table 24: Canada Solid State Drive Industry Revenue (Million) Forecast, by Application 2019 & 2032
- Table 25: Global Solid State Drive Industry Revenue Million Forecast, by SSD I 2019 & 2032
- Table 26: Global Solid State Drive Industry Revenue Million Forecast, by Appli 2019 & 2032
- Table 27: Global Solid State Drive Industry Revenue Million Forecast, by Country 2019 & 2032
- Table 28: Germany Solid State Drive Industry Revenue (Million) Forecast, by Application 2019 & 2032
- Table 29: United Kingdom Solid State Drive Industry Revenue (Million) Forecast, by Application 2019 & 2032
- Table 30: France Solid State Drive Industry Revenue (Million) Forecast, by Application 2019 & 2032
- Table 31: Global Solid State Drive Industry Revenue Million Forecast, by SSD I 2019 & 2032
- Table 32: Global Solid State Drive Industry Revenue Million Forecast, by Appli 2019 & 2032
- Table 33: Global Solid State Drive Industry Revenue Million Forecast, by Country 2019 & 2032
- Table 34: China Solid State Drive Industry Revenue (Million) Forecast, by Application 2019 & 2032
- Table 35: Taiwan Solid State Drive Industry Revenue (Million) Forecast, by Application 2019 & 2032
- Table 36: South Korea Solid State Drive Industry Revenue (Million) Forecast, by Application 2019 & 2032
- Table 37: Global Solid State Drive Industry Revenue Million Forecast, by SSD I 2019 & 2032
- Table 38: Global Solid State Drive Industry Revenue Million Forecast, by Appli 2019 & 2032
- Table 39: Global Solid State Drive Industry Revenue Million Forecast, by Country 2019 & 2032
- Table 40: Global Solid State Drive Industry Revenue Million Forecast, by SSD I 2019 & 2032
- Table 41: Global Solid State Drive Industry Revenue Million Forecast, by Appli 2019 & 2032
- Table 42: Global Solid State Drive Industry Revenue Million Forecast, by Country 2019 & 2032
- Table 43: Global Solid State Drive Industry Revenue Million Forecast, by SSD I 2019 & 2032
- Table 44: Global Solid State Drive Industry Revenue Million Forecast, by Appli 2019 & 2032
- Table 45: Global Solid State Drive Industry Revenue Million Forecast, by Country 2019 & 2032
Frequently Asked Questions
1. What is the projected Compound Annual Growth Rate (CAGR) of the Solid State Drive Industry?
The projected CAGR is approximately 17.56%.
2. Which companies are prominent players in the Solid State Drive Industry?
Key companies in the market include Samsung Group, Seagate Technology LLC, Micron Technology Inc, Transcend Information Inc, ADATA Technology Co Ltd, Western Digital Corporation, SK Hynix Inc, Teclast Electronics Co Limite, Kingston Technology Corporation, Intel Corporation.
3. What are the main segments of the Solid State Drive Industry?
The market segments include SSD I, Appli.
4. Can you provide details about the market size?
The market size is estimated to be USD 65.47 Million as of 2022.
5. What are some drivers contributing to market growth?
4.; Growing Adoption in Data Center Applications4.; High Demand from the High-end Cloud Segment 4.; Greater Utility of SSD over HDD in Key Verticals.
6. What are the notable trends driving market growth?
Rising Demand from Enterprise Segment to Augment the Market Growth.
7. Are there any restraints impacting market growth?
Slow Pace in Development of Applications Despite Heavy investments in R&D; Commplexities in Hardware Designing.
8. Can you provide examples of recent developments in the market?
July 2022 - Kioxia Announces New Speed Levels with Enterprise NVMe SSD Family Designed using PCIe 5.0 Technology. The KIOXIA CM7 line series is built with PCIe 5.0 technology in E3.S and 2.5-inch Enterprise and Datacenter Standard Form Factor (EDSFF). The EDSFF E3 series allows the upcoming era of SSDs using PCIe 5.0 and above to satisfy future data center designs while supporting a wide range of new applications and devices.
9. What pricing options are available for accessing the report?
Pricing options include single-user, multi-user, and enterprise licenses priced at USD 4750, USD 5250, and USD 8750 respectively.
10. Is the market size provided in terms of value or volume?
The market size is provided in terms of value, measured in Million.
11. Are there any specific market keywords associated with the report?
Yes, the market keyword associated with the report is "Solid State Drive Industry," which aids in identifying and referencing the specific market segment covered.
12. How do I determine which pricing option suits my needs best?
The pricing options vary based on user requirements and access needs. Individual users may opt for single-user licenses, while businesses requiring broader access may choose multi-user or enterprise licenses for cost-effective access to the report.
13. Are there any additional resources or data provided in the Solid State Drive Industry report?
While the report offers comprehensive insights, it's advisable to review the specific contents or supplementary materials provided to ascertain if additional resources or data are available.
14. How can I stay updated on further developments or reports in the Solid State Drive Industry?
To stay informed about further developments, trends, and reports in the Solid State Drive Industry, consider subscribing to industry newsletters, following relevant companies and organizations, or regularly checking reputable industry news sources and publications.
Methodology
Step 1 - Identification of Relevant Samples Size from Population Database


Step 2 - Approaches for Defining Global Market Size (Value, Volume* & Price*)

Note*: In applicable scenarios
Step 3 - Data Sources
Primary Research
- Web Analytics
- Survey Reports
- Research Institute
- Latest Research Reports
- Opinion Leaders
Secondary Research
- Annual Reports
- White Paper
- Latest Press Release
- Industry Association
- Paid Database
- Investor Presentations

Step 4 - Data Triangulation
Involves using different sources of information in order to increase the validity of a study
These sources are likely to be stakeholders in a program - participants, other researchers, program staff, other community members, and so on.
Then we put all data in single framework & apply various statistical tools to find out the dynamic on the market.
During the analysis stage, feedback from the stakeholder groups would be compared to determine areas of agreement as well as areas of divergence


