
Key Insights
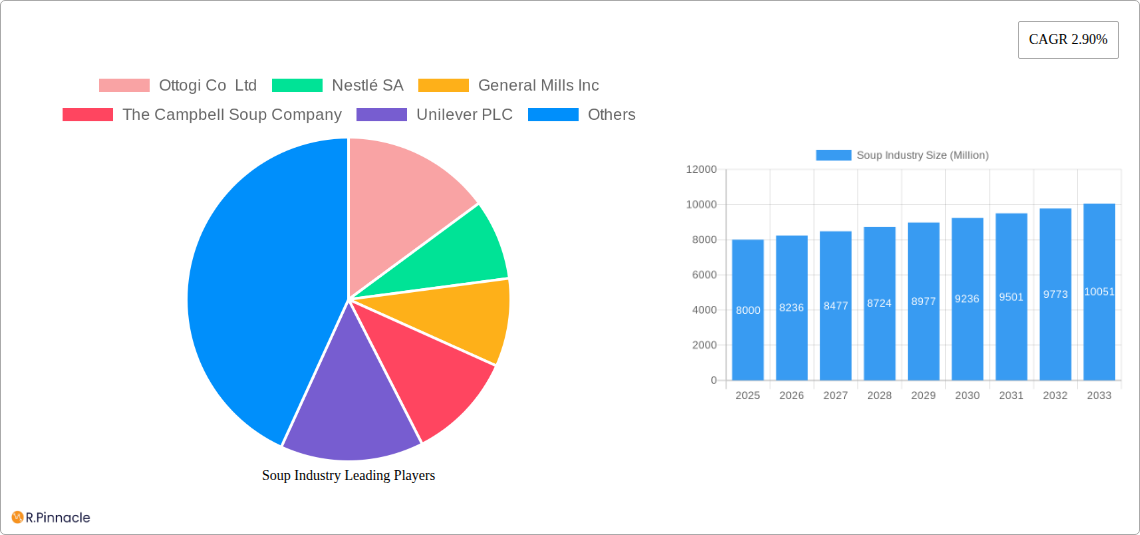
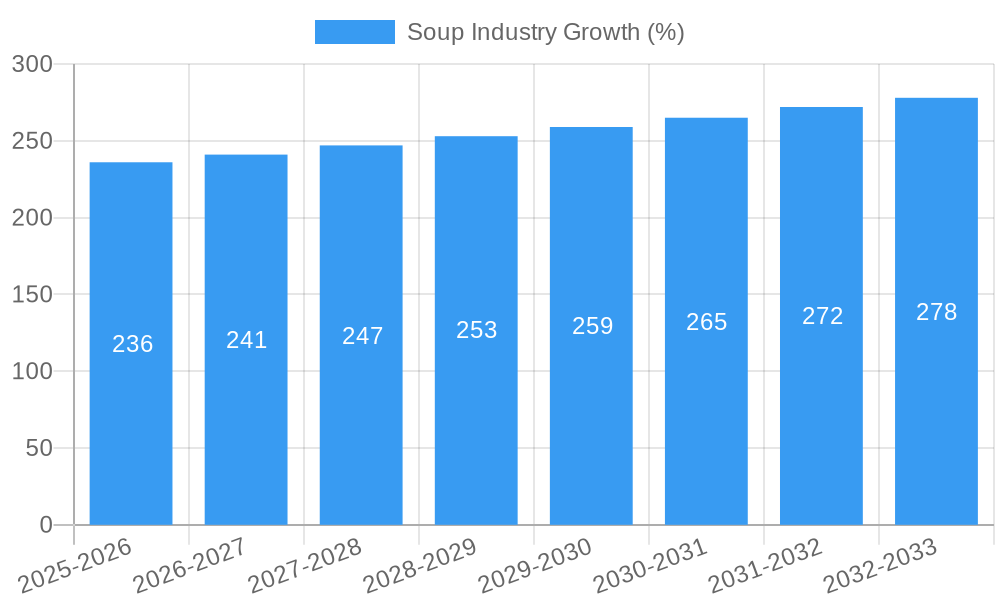
The global soup market, valued at approximately $XX million in 2025, is projected to exhibit a Compound Annual Growth Rate (CAGR) of 2.90% from 2025 to 2033. This growth is fueled by several key factors. The increasing preference for convenient and healthy meal options is driving demand, particularly for ready-to-eat and single-serving soups. Health-conscious consumers are increasingly opting for vegetarian and low-sodium options, contributing to the segment's expansion. Furthermore, innovative packaging solutions, such as pouches and shelf-stable options, are enhancing product shelf life and appeal, driving sales across diverse distribution channels. The rise of e-commerce platforms is also significantly contributing to market growth, providing wider access to a diverse range of soup products. However, fluctuating raw material prices and intense competition among established players pose potential challenges.
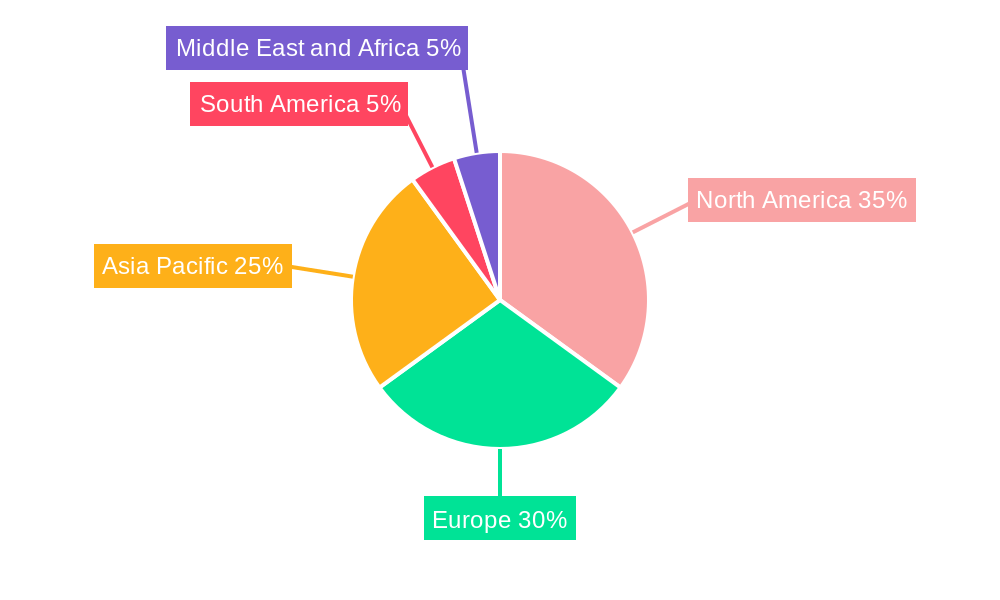
Despite these challenges, the market demonstrates robust potential. The growing popularity of ethnic and gourmet soups is creating new opportunities for product diversification. Companies are strategically investing in research and development to introduce innovative flavors and formulations to cater to evolving consumer preferences. Regional variations also play a significant role; North America and Europe currently hold substantial market share, but the Asia-Pacific region presents considerable growth opportunities due to rising disposable incomes and changing dietary habits. The market is segmented by product type (canned/preserved, chilled, dehydrated, frozen, instant, UHT), packaging (canned, pouched, other), category (vegetarian, non-vegetarian), and distribution channels (supermarkets, convenience stores, online retail). Companies like Nestlé, Campbell Soup, and Unilever are key players leveraging their brand recognition and extensive distribution networks to maintain market leadership. The continued focus on product innovation and strategic market expansion will be critical for success in this dynamic sector.
Soup Industry Market Report: 2019-2033
This comprehensive report provides a detailed analysis of the global soup industry, offering invaluable insights for industry professionals, investors, and strategists. With a study period spanning 2019-2033, a base year of 2025, and a forecast period of 2025-2033, this report leverages historical data (2019-2024) to project future market trends and opportunities. The report covers a market valued at several billion dollars, offering a granular look at key segments and competitive dynamics.
Soup Industry Market Structure & Innovation Trends
The global soup industry exhibits a moderately concentrated market structure, with key players like Nestlé SA, Campbell Soup Company, and Unilever PLC holding significant market share. However, smaller, specialized brands like Tideford Organic Foods and Upton's Naturals are making inroads with innovative, niche products, particularly in the growing vegetarian and vegan segments. The market is driven by ongoing innovation in flavors, packaging, and convenience, alongside increasing consumer demand for healthier and more sustainable options. Regulatory frameworks concerning food safety and labeling significantly influence market practices. Product substitutes, such as ready-made meals and other convenience foods, pose a competitive threat. The industry has witnessed several M&A activities in recent years, though precise deal values for all transactions are unavailable and estimated at xx Million.
- Market Concentration: High, with top 5 players holding an estimated xx% market share.
- Innovation Drivers: Healthier options, convenient packaging, diverse flavors.
- Regulatory Frameworks: Food safety standards, labeling regulations.
- Product Substitutes: Ready meals, instant noodles.
- End-User Demographics: Growing demand from health-conscious consumers and busy professionals.
- M&A Activities: Several acquisitions and mergers have occurred in the last 5 years, with estimated deal values totaling xx Million.
Soup Industry Market Dynamics & Trends
The global soup industry is experiencing steady growth, driven primarily by rising disposable incomes, changing lifestyles, and increased consumer preference for convenient and ready-to-eat meals. Technological advancements in packaging and preservation techniques are expanding product shelf life and enhancing overall consumer experience. The market witnesses a dynamic interplay of established players and emerging brands, leading to intense competition and a constant drive for innovation. Consumer preferences are shifting towards healthier, more natural, and ethically sourced options, including vegetarian and vegan soups.
- CAGR (2025-2033): Estimated at xx%
- Market Penetration: High in developed nations, growing in emerging markets.
- Market Growth Drivers: Increasing disposable income, changing lifestyles, demand for convenient food.
- Technological Disruptions: Improved packaging, new preservation techniques.
- Consumer Preferences: Growing demand for healthy, sustainable, and diverse flavor profiles.
- Competitive Dynamics: Intense competition amongst established and emerging players.
Dominant Regions & Segments in Soup Industry
The North American and European markets currently dominate the global soup industry, driven by high consumer demand and established distribution channels. However, Asia-Pacific is witnessing significant growth, fuelled by rising disposable incomes and changing dietary habits. Within the segments, canned and preserved soups maintain the largest market share due to long shelf life and cost-effectiveness. Supermarkets/hypermarkets form the principal distribution channel, although online retail is rapidly gaining traction. Non-vegetarian soups still hold a larger market share compared to vegetarian soups globally, but the vegetarian segment is demonstrating faster growth.
- Leading Region: North America
- Leading Country: USA
- Leading Segment (Category): Non-vegetarian Soup
- Leading Segment (Packaging): Canned
- Leading Segment (Distribution Channel): Supermarkets/Hypermarkets
- Leading Segment (Type): Canned/Preserved
Key Drivers (Examples):
- Developed infrastructure in North America and Europe facilitating distribution.
- Increasing disposable incomes and changing consumption patterns in Asia-Pacific.
- Growing consumer preference for convenience in all regions.
Soup Industry Product Innovations
Recent product innovations in the soup industry reflect trends toward healthier, more convenient, and ethically sourced products. Manufacturers are focusing on organic, vegan, and gluten-free options, alongside new and exciting flavor profiles to meet evolving consumer preferences. Technological advancements in packaging are also key, improving shelf life and reducing waste. Companies are also leveraging technological advancements in flavor enhancement and preservation to create superior products that stand out in a competitive market.
Report Scope & Segmentation Analysis
This report segments the soup industry comprehensively based on several key parameters:
- Category: Vegetarian Soup (xx Million), Non-vegetarian Soup (xx Million), experiencing xx% and xx% CAGR respectively during the forecast period.
- Packaging: Canned (xx Million), Pouched (xx Million), Other Packaging (xx Million), with xx%, xx%, and xx% CAGR respectively over the forecast period.
- Distribution Channel: Supermarkets/Hypermarkets (xx Million), Convenience Stores (xx Million), Online Retail Stores (xx Million), Other Distribution Channels (xx Million), exhibiting xx%, xx%, xx%, and xx% CAGRs respectively during the forecast period.
- Type: Canned/Preserved (xx Million), Chilled (xx Million), Dehydrated (xx Million), Frozen (xx Million), Instant (xx Million), UHT (xx Million), with respective CAGRs at xx%, xx%, xx%, xx%, xx%, and xx% during the forecast period. Each segment displays unique competitive dynamics.
Key Drivers of Soup Industry Growth
The soup industry's growth is fueled by several factors. Rising disposable incomes, particularly in emerging economies, are enabling increased spending on convenient and ready-to-eat food items. Changes in lifestyle, with more individuals opting for quick and easy meals, are further boosting market demand. Technological innovations, leading to better preservation techniques and enhanced product shelf life, are also crucial drivers of this market expansion. Government regulations promoting food safety and standardization are also shaping industry growth.
Challenges in the Soup Industry Sector
The soup industry faces challenges including intense competition from substitute products, fluctuating raw material prices, and stringent regulatory requirements. Supply chain disruptions, particularly concerning key ingredients, pose significant risk. Changes in consumer preferences and the increasing need for healthy and sustainable products also present challenges. These factors may affect profits and production. The estimated impact on overall industry growth due to these challenges is projected to be xx%.
Emerging Opportunities in Soup Industry
The soup industry presents exciting opportunities for expansion in emerging markets with growing middle classes and increasing demand for convenience foods. The rising popularity of health-conscious options like organic, vegan, and gluten-free soups creates significant potential for growth. Technological innovations, such as the introduction of novel flavors and improved packaging, are also contributing to new opportunities. Exploring non-traditional channels like online retail and meal kit services opens new avenues for market penetration.
Leading Players in the Soup Industry Market
- Ottogi Co Ltd
- Nestlé SA
- General Mills Inc
- The Campbell Soup Company
- Unilever PLC
- Conagra Brands Inc
- WA Baxter & Sons (Holdings) Limited
- The Kraft Heinz Company
- Tideford Organic Foods Limited
- B&G Foods Holding Corp
- Upton's Naturals Co
- Premier Foods Group Limited
Key Developments in Soup Industry
- September 2022: Tideford Organics launched new soup flavors and doubled its retail distribution.
- July 2022: Upton's Naturals introduced three new vegan soup recipes.
- June 2022: Campbell Soup Company announced plans for new soup flavors.
Future Outlook for Soup Industry Market
The future of the soup industry looks promising, driven by continued innovation, expanding consumer base, and the growing demand for convenient and healthy meal options. Strategic partnerships, targeted product development, and aggressive marketing are key strategies for success. The market is projected to experience substantial growth, with new opportunities emerging in emerging markets and niche segments. Sustaining competitiveness will require adaptation to ever-changing consumer preferences and technological advancements.
Soup Industry Segmentation
-
1. Type
- 1.1. Canned/Preserved
- 1.2. Chilled
- 1.3. Dehydrated
- 1.4. Frozen
- 1.5. Instant
- 1.6. UHT
-
2. Category
- 2.1. Vegetarian Soup
- 2.2. Non-vegetarian Soup
-
3. Packaging
- 3.1. Canned
- 3.2. Pouched
- 3.3. Other Packaging
-
4. Distribution Channel
- 4.1. Supermarkets/Hypermarkets
- 4.2. Convenience Stores
- 4.3. Online Retail Stores
- 4.4. Other Distribution Channels
Soup Industry Segmentation By Geography
-
1. North America
- 1.1. United States
- 1.2. Canada
- 1.3. Mexico
- 1.4. Rest of North America
-
2. Europe
- 2.1. Spain
- 2.2. United Kingdom
- 2.3. Germany
- 2.4. France
- 2.5. Italy
- 2.6. Russia
- 2.7. Rest of Europe
-
3. Asia Pacific
- 3.1. China
- 3.2. Japan
- 3.3. India
- 3.4. Australia
- 3.5. Rest of Asia Pacific
-
4. South America
- 4.1. Brazil
- 4.2. Argentina
- 4.3. Rest of South America
- 5. Middle East
-
6. South Africa
- 6.1. Saudi Arabia
- 6.2. Rest of Middle East
Soup Industry REPORT HIGHLIGHTS
| Aspects | Details |
|---|---|
| Study Period | 2019-2033 |
| Base Year | 2024 |
| Estimated Year | 2025 |
| Forecast Period | 2025-2033 |
| Historical Period | 2019-2024 |
| Growth Rate | CAGR of 2.90% from 2019-2033 |
| Segmentation |
|
Table of Contents
- 1. Introduction
- 1.1. Research Scope
- 1.2. Market Segmentation
- 1.3. Research Methodology
- 1.4. Definitions and Assumptions
- 2. Executive Summary
- 2.1. Introduction
- 3. Market Dynamics
- 3.1. Introduction
- 3.2. Market Drivers
- 3.2.1. Ready-to-eat and easy-to-prepare soups cater to the busy lifestyles of consumers driving demand for convenient food options
- 3.3. Market Restrains
- 3.3.1. Competition from Fresh and Homemade Alternatives
- 3.4. Market Trends
- 3.4.1. Increased demand for plant-based and vegan diets has led to a rise in plant-based soups
- 4. Market Factor Analysis
- 4.1. Porters Five Forces
- 4.2. Supply/Value Chain
- 4.3. PESTEL analysis
- 4.4. Market Entropy
- 4.5. Patent/Trademark Analysis
- 5. Global Soup Industry Analysis, Insights and Forecast, 2019-2031
- 5.1. Market Analysis, Insights and Forecast - by Type
- 5.1.1. Canned/Preserved
- 5.1.2. Chilled
- 5.1.3. Dehydrated
- 5.1.4. Frozen
- 5.1.5. Instant
- 5.1.6. UHT
- 5.2. Market Analysis, Insights and Forecast - by Category
- 5.2.1. Vegetarian Soup
- 5.2.2. Non-vegetarian Soup
- 5.3. Market Analysis, Insights and Forecast - by Packaging
- 5.3.1. Canned
- 5.3.2. Pouched
- 5.3.3. Other Packaging
- 5.4. Market Analysis, Insights and Forecast - by Distribution Channel
- 5.4.1. Supermarkets/Hypermarkets
- 5.4.2. Convenience Stores
- 5.4.3. Online Retail Stores
- 5.4.4. Other Distribution Channels
- 5.5. Market Analysis, Insights and Forecast - by Region
- 5.5.1. North America
- 5.5.2. Europe
- 5.5.3. Asia Pacific
- 5.5.4. South America
- 5.5.5. Middle East
- 5.5.6. South Africa
- 5.1. Market Analysis, Insights and Forecast - by Type
- 6. North America Soup Industry Analysis, Insights and Forecast, 2019-2031
- 6.1. Market Analysis, Insights and Forecast - by Type
- 6.1.1. Canned/Preserved
- 6.1.2. Chilled
- 6.1.3. Dehydrated
- 6.1.4. Frozen
- 6.1.5. Instant
- 6.1.6. UHT
- 6.2. Market Analysis, Insights and Forecast - by Category
- 6.2.1. Vegetarian Soup
- 6.2.2. Non-vegetarian Soup
- 6.3. Market Analysis, Insights and Forecast - by Packaging
- 6.3.1. Canned
- 6.3.2. Pouched
- 6.3.3. Other Packaging
- 6.4. Market Analysis, Insights and Forecast - by Distribution Channel
- 6.4.1. Supermarkets/Hypermarkets
- 6.4.2. Convenience Stores
- 6.4.3. Online Retail Stores
- 6.4.4. Other Distribution Channels
- 6.1. Market Analysis, Insights and Forecast - by Type
- 7. Europe Soup Industry Analysis, Insights and Forecast, 2019-2031
- 7.1. Market Analysis, Insights and Forecast - by Type
- 7.1.1. Canned/Preserved
- 7.1.2. Chilled
- 7.1.3. Dehydrated
- 7.1.4. Frozen
- 7.1.5. Instant
- 7.1.6. UHT
- 7.2. Market Analysis, Insights and Forecast - by Category
- 7.2.1. Vegetarian Soup
- 7.2.2. Non-vegetarian Soup
- 7.3. Market Analysis, Insights and Forecast - by Packaging
- 7.3.1. Canned
- 7.3.2. Pouched
- 7.3.3. Other Packaging
- 7.4. Market Analysis, Insights and Forecast - by Distribution Channel
- 7.4.1. Supermarkets/Hypermarkets
- 7.4.2. Convenience Stores
- 7.4.3. Online Retail Stores
- 7.4.4. Other Distribution Channels
- 7.1. Market Analysis, Insights and Forecast - by Type
- 8. Asia Pacific Soup Industry Analysis, Insights and Forecast, 2019-2031
- 8.1. Market Analysis, Insights and Forecast - by Type
- 8.1.1. Canned/Preserved
- 8.1.2. Chilled
- 8.1.3. Dehydrated
- 8.1.4. Frozen
- 8.1.5. Instant
- 8.1.6. UHT
- 8.2. Market Analysis, Insights and Forecast - by Category
- 8.2.1. Vegetarian Soup
- 8.2.2. Non-vegetarian Soup
- 8.3. Market Analysis, Insights and Forecast - by Packaging
- 8.3.1. Canned
- 8.3.2. Pouched
- 8.3.3. Other Packaging
- 8.4. Market Analysis, Insights and Forecast - by Distribution Channel
- 8.4.1. Supermarkets/Hypermarkets
- 8.4.2. Convenience Stores
- 8.4.3. Online Retail Stores
- 8.4.4. Other Distribution Channels
- 8.1. Market Analysis, Insights and Forecast - by Type
- 9. South America Soup Industry Analysis, Insights and Forecast, 2019-2031
- 9.1. Market Analysis, Insights and Forecast - by Type
- 9.1.1. Canned/Preserved
- 9.1.2. Chilled
- 9.1.3. Dehydrated
- 9.1.4. Frozen
- 9.1.5. Instant
- 9.1.6. UHT
- 9.2. Market Analysis, Insights and Forecast - by Category
- 9.2.1. Vegetarian Soup
- 9.2.2. Non-vegetarian Soup
- 9.3. Market Analysis, Insights and Forecast - by Packaging
- 9.3.1. Canned
- 9.3.2. Pouched
- 9.3.3. Other Packaging
- 9.4. Market Analysis, Insights and Forecast - by Distribution Channel
- 9.4.1. Supermarkets/Hypermarkets
- 9.4.2. Convenience Stores
- 9.4.3. Online Retail Stores
- 9.4.4. Other Distribution Channels
- 9.1. Market Analysis, Insights and Forecast - by Type
- 10. Middle East Soup Industry Analysis, Insights and Forecast, 2019-2031
- 10.1. Market Analysis, Insights and Forecast - by Type
- 10.1.1. Canned/Preserved
- 10.1.2. Chilled
- 10.1.3. Dehydrated
- 10.1.4. Frozen
- 10.1.5. Instant
- 10.1.6. UHT
- 10.2. Market Analysis, Insights and Forecast - by Category
- 10.2.1. Vegetarian Soup
- 10.2.2. Non-vegetarian Soup
- 10.3. Market Analysis, Insights and Forecast - by Packaging
- 10.3.1. Canned
- 10.3.2. Pouched
- 10.3.3. Other Packaging
- 10.4. Market Analysis, Insights and Forecast - by Distribution Channel
- 10.4.1. Supermarkets/Hypermarkets
- 10.4.2. Convenience Stores
- 10.4.3. Online Retail Stores
- 10.4.4. Other Distribution Channels
- 10.1. Market Analysis, Insights and Forecast - by Type
- 11. South Africa Soup Industry Analysis, Insights and Forecast, 2019-2031
- 11.1. Market Analysis, Insights and Forecast - by Type
- 11.1.1. Canned/Preserved
- 11.1.2. Chilled
- 11.1.3. Dehydrated
- 11.1.4. Frozen
- 11.1.5. Instant
- 11.1.6. UHT
- 11.2. Market Analysis, Insights and Forecast - by Category
- 11.2.1. Vegetarian Soup
- 11.2.2. Non-vegetarian Soup
- 11.3. Market Analysis, Insights and Forecast - by Packaging
- 11.3.1. Canned
- 11.3.2. Pouched
- 11.3.3. Other Packaging
- 11.4. Market Analysis, Insights and Forecast - by Distribution Channel
- 11.4.1. Supermarkets/Hypermarkets
- 11.4.2. Convenience Stores
- 11.4.3. Online Retail Stores
- 11.4.4. Other Distribution Channels
- 11.1. Market Analysis, Insights and Forecast - by Type
- 12. North America Soup Industry Analysis, Insights and Forecast, 2019-2031
- 12.1. Market Analysis, Insights and Forecast - By Country/Sub-region
- 12.1.1 United States
- 12.1.2 Canada
- 12.1.3 Mexico
- 12.1.4 Rest of North America
- 13. Europe Soup Industry Analysis, Insights and Forecast, 2019-2031
- 13.1. Market Analysis, Insights and Forecast - By Country/Sub-region
- 13.1.1 Spain
- 13.1.2 United Kingdom
- 13.1.3 Germany
- 13.1.4 France
- 13.1.5 Italy
- 13.1.6 Russia
- 13.1.7 Rest of Europe
- 14. Asia Pacific Soup Industry Analysis, Insights and Forecast, 2019-2031
- 14.1. Market Analysis, Insights and Forecast - By Country/Sub-region
- 14.1.1 China
- 14.1.2 Japan
- 14.1.3 India
- 14.1.4 Australia
- 14.1.5 Rest of Asia Pacific
- 15. South America Soup Industry Analysis, Insights and Forecast, 2019-2031
- 15.1. Market Analysis, Insights and Forecast - By Country/Sub-region
- 15.1.1 Brazil
- 15.1.2 Argentina
- 15.1.3 Rest of South America
- 16. Middle East and Africa Soup Industry Analysis, Insights and Forecast, 2019-2031
- 16.1. Market Analysis, Insights and Forecast - By Country/Sub-region
- 16.1.1 South Africa
- 16.1.2 United Arab Emirates
- 16.1.3 Rest of Middle East and Africa
- 17. Competitive Analysis
- 17.1. Global Market Share Analysis 2024
- 17.2. Company Profiles
- 17.2.1 Ottogi Co Ltd
- 17.2.1.1. Overview
- 17.2.1.2. Products
- 17.2.1.3. SWOT Analysis
- 17.2.1.4. Recent Developments
- 17.2.1.5. Financials (Based on Availability)
- 17.2.2 Nestlé SA
- 17.2.2.1. Overview
- 17.2.2.2. Products
- 17.2.2.3. SWOT Analysis
- 17.2.2.4. Recent Developments
- 17.2.2.5. Financials (Based on Availability)
- 17.2.3 General Mills Inc
- 17.2.3.1. Overview
- 17.2.3.2. Products
- 17.2.3.3. SWOT Analysis
- 17.2.3.4. Recent Developments
- 17.2.3.5. Financials (Based on Availability)
- 17.2.4 The Campbell Soup Company
- 17.2.4.1. Overview
- 17.2.4.2. Products
- 17.2.4.3. SWOT Analysis
- 17.2.4.4. Recent Developments
- 17.2.4.5. Financials (Based on Availability)
- 17.2.5 Unilever PLC
- 17.2.5.1. Overview
- 17.2.5.2. Products
- 17.2.5.3. SWOT Analysis
- 17.2.5.4. Recent Developments
- 17.2.5.5. Financials (Based on Availability)
- 17.2.6 Conagra Brands Inc
- 17.2.6.1. Overview
- 17.2.6.2. Products
- 17.2.6.3. SWOT Analysis
- 17.2.6.4. Recent Developments
- 17.2.6.5. Financials (Based on Availability)
- 17.2.7 WA Baxter & Sons (Holdings) Limited
- 17.2.7.1. Overview
- 17.2.7.2. Products
- 17.2.7.3. SWOT Analysis
- 17.2.7.4. Recent Developments
- 17.2.7.5. Financials (Based on Availability)
- 17.2.8 The Kraft Heinz Company
- 17.2.8.1. Overview
- 17.2.8.2. Products
- 17.2.8.3. SWOT Analysis
- 17.2.8.4. Recent Developments
- 17.2.8.5. Financials (Based on Availability)
- 17.2.9 Tideford Organic Foods Limited
- 17.2.9.1. Overview
- 17.2.9.2. Products
- 17.2.9.3. SWOT Analysis
- 17.2.9.4. Recent Developments
- 17.2.9.5. Financials (Based on Availability)
- 17.2.10 B&G Foods Holding Corp
- 17.2.10.1. Overview
- 17.2.10.2. Products
- 17.2.10.3. SWOT Analysis
- 17.2.10.4. Recent Developments
- 17.2.10.5. Financials (Based on Availability)
- 17.2.11 Upton's Naturals Co
- 17.2.11.1. Overview
- 17.2.11.2. Products
- 17.2.11.3. SWOT Analysis
- 17.2.11.4. Recent Developments
- 17.2.11.5. Financials (Based on Availability)
- 17.2.12 Premier Foods Group Limited
- 17.2.12.1. Overview
- 17.2.12.2. Products
- 17.2.12.3. SWOT Analysis
- 17.2.12.4. Recent Developments
- 17.2.12.5. Financials (Based on Availability)
- 17.2.1 Ottogi Co Ltd
List of Figures
- Figure 1: Global Soup Industry Revenue Breakdown (Million, %) by Region 2024 & 2032
- Figure 2: North America Soup Industry Revenue (Million), by Country 2024 & 2032
- Figure 3: North America Soup Industry Revenue Share (%), by Country 2024 & 2032
- Figure 4: Europe Soup Industry Revenue (Million), by Country 2024 & 2032
- Figure 5: Europe Soup Industry Revenue Share (%), by Country 2024 & 2032
- Figure 6: Asia Pacific Soup Industry Revenue (Million), by Country 2024 & 2032
- Figure 7: Asia Pacific Soup Industry Revenue Share (%), by Country 2024 & 2032
- Figure 8: South America Soup Industry Revenue (Million), by Country 2024 & 2032
- Figure 9: South America Soup Industry Revenue Share (%), by Country 2024 & 2032
- Figure 10: Middle East and Africa Soup Industry Revenue (Million), by Country 2024 & 2032
- Figure 11: Middle East and Africa Soup Industry Revenue Share (%), by Country 2024 & 2032
- Figure 12: North America Soup Industry Revenue (Million), by Type 2024 & 2032
- Figure 13: North America Soup Industry Revenue Share (%), by Type 2024 & 2032
- Figure 14: North America Soup Industry Revenue (Million), by Category 2024 & 2032
- Figure 15: North America Soup Industry Revenue Share (%), by Category 2024 & 2032
- Figure 16: North America Soup Industry Revenue (Million), by Packaging 2024 & 2032
- Figure 17: North America Soup Industry Revenue Share (%), by Packaging 2024 & 2032
- Figure 18: North America Soup Industry Revenue (Million), by Distribution Channel 2024 & 2032
- Figure 19: North America Soup Industry Revenue Share (%), by Distribution Channel 2024 & 2032
- Figure 20: North America Soup Industry Revenue (Million), by Country 2024 & 2032
- Figure 21: North America Soup Industry Revenue Share (%), by Country 2024 & 2032
- Figure 22: Europe Soup Industry Revenue (Million), by Type 2024 & 2032
- Figure 23: Europe Soup Industry Revenue Share (%), by Type 2024 & 2032
- Figure 24: Europe Soup Industry Revenue (Million), by Category 2024 & 2032
- Figure 25: Europe Soup Industry Revenue Share (%), by Category 2024 & 2032
- Figure 26: Europe Soup Industry Revenue (Million), by Packaging 2024 & 2032
- Figure 27: Europe Soup Industry Revenue Share (%), by Packaging 2024 & 2032
- Figure 28: Europe Soup Industry Revenue (Million), by Distribution Channel 2024 & 2032
- Figure 29: Europe Soup Industry Revenue Share (%), by Distribution Channel 2024 & 2032
- Figure 30: Europe Soup Industry Revenue (Million), by Country 2024 & 2032
- Figure 31: Europe Soup Industry Revenue Share (%), by Country 2024 & 2032
- Figure 32: Asia Pacific Soup Industry Revenue (Million), by Type 2024 & 2032
- Figure 33: Asia Pacific Soup Industry Revenue Share (%), by Type 2024 & 2032
- Figure 34: Asia Pacific Soup Industry Revenue (Million), by Category 2024 & 2032
- Figure 35: Asia Pacific Soup Industry Revenue Share (%), by Category 2024 & 2032
- Figure 36: Asia Pacific Soup Industry Revenue (Million), by Packaging 2024 & 2032
- Figure 37: Asia Pacific Soup Industry Revenue Share (%), by Packaging 2024 & 2032
- Figure 38: Asia Pacific Soup Industry Revenue (Million), by Distribution Channel 2024 & 2032
- Figure 39: Asia Pacific Soup Industry Revenue Share (%), by Distribution Channel 2024 & 2032
- Figure 40: Asia Pacific Soup Industry Revenue (Million), by Country 2024 & 2032
- Figure 41: Asia Pacific Soup Industry Revenue Share (%), by Country 2024 & 2032
- Figure 42: South America Soup Industry Revenue (Million), by Type 2024 & 2032
- Figure 43: South America Soup Industry Revenue Share (%), by Type 2024 & 2032
- Figure 44: South America Soup Industry Revenue (Million), by Category 2024 & 2032
- Figure 45: South America Soup Industry Revenue Share (%), by Category 2024 & 2032
- Figure 46: South America Soup Industry Revenue (Million), by Packaging 2024 & 2032
- Figure 47: South America Soup Industry Revenue Share (%), by Packaging 2024 & 2032
- Figure 48: South America Soup Industry Revenue (Million), by Distribution Channel 2024 & 2032
- Figure 49: South America Soup Industry Revenue Share (%), by Distribution Channel 2024 & 2032
- Figure 50: South America Soup Industry Revenue (Million), by Country 2024 & 2032
- Figure 51: South America Soup Industry Revenue Share (%), by Country 2024 & 2032
- Figure 52: Middle East Soup Industry Revenue (Million), by Type 2024 & 2032
- Figure 53: Middle East Soup Industry Revenue Share (%), by Type 2024 & 2032
- Figure 54: Middle East Soup Industry Revenue (Million), by Category 2024 & 2032
- Figure 55: Middle East Soup Industry Revenue Share (%), by Category 2024 & 2032
- Figure 56: Middle East Soup Industry Revenue (Million), by Packaging 2024 & 2032
- Figure 57: Middle East Soup Industry Revenue Share (%), by Packaging 2024 & 2032
- Figure 58: Middle East Soup Industry Revenue (Million), by Distribution Channel 2024 & 2032
- Figure 59: Middle East Soup Industry Revenue Share (%), by Distribution Channel 2024 & 2032
- Figure 60: Middle East Soup Industry Revenue (Million), by Country 2024 & 2032
- Figure 61: Middle East Soup Industry Revenue Share (%), by Country 2024 & 2032
- Figure 62: South Africa Soup Industry Revenue (Million), by Type 2024 & 2032
- Figure 63: South Africa Soup Industry Revenue Share (%), by Type 2024 & 2032
- Figure 64: South Africa Soup Industry Revenue (Million), by Category 2024 & 2032
- Figure 65: South Africa Soup Industry Revenue Share (%), by Category 2024 & 2032
- Figure 66: South Africa Soup Industry Revenue (Million), by Packaging 2024 & 2032
- Figure 67: South Africa Soup Industry Revenue Share (%), by Packaging 2024 & 2032
- Figure 68: South Africa Soup Industry Revenue (Million), by Distribution Channel 2024 & 2032
- Figure 69: South Africa Soup Industry Revenue Share (%), by Distribution Channel 2024 & 2032
- Figure 70: South Africa Soup Industry Revenue (Million), by Country 2024 & 2032
- Figure 71: South Africa Soup Industry Revenue Share (%), by Country 2024 & 2032
List of Tables
- Table 1: Global Soup Industry Revenue Million Forecast, by Region 2019 & 2032
- Table 2: Global Soup Industry Revenue Million Forecast, by Type 2019 & 2032
- Table 3: Global Soup Industry Revenue Million Forecast, by Category 2019 & 2032
- Table 4: Global Soup Industry Revenue Million Forecast, by Packaging 2019 & 2032
- Table 5: Global Soup Industry Revenue Million Forecast, by Distribution Channel 2019 & 2032
- Table 6: Global Soup Industry Revenue Million Forecast, by Region 2019 & 2032
- Table 7: Global Soup Industry Revenue Million Forecast, by Country 2019 & 2032
- Table 8: United States Soup Industry Revenue (Million) Forecast, by Application 2019 & 2032
- Table 9: Canada Soup Industry Revenue (Million) Forecast, by Application 2019 & 2032
- Table 10: Mexico Soup Industry Revenue (Million) Forecast, by Application 2019 & 2032
- Table 11: Rest of North America Soup Industry Revenue (Million) Forecast, by Application 2019 & 2032
- Table 12: Global Soup Industry Revenue Million Forecast, by Country 2019 & 2032
- Table 13: Spain Soup Industry Revenue (Million) Forecast, by Application 2019 & 2032
- Table 14: United Kingdom Soup Industry Revenue (Million) Forecast, by Application 2019 & 2032
- Table 15: Germany Soup Industry Revenue (Million) Forecast, by Application 2019 & 2032
- Table 16: France Soup Industry Revenue (Million) Forecast, by Application 2019 & 2032
- Table 17: Italy Soup Industry Revenue (Million) Forecast, by Application 2019 & 2032
- Table 18: Russia Soup Industry Revenue (Million) Forecast, by Application 2019 & 2032
- Table 19: Rest of Europe Soup Industry Revenue (Million) Forecast, by Application 2019 & 2032
- Table 20: Global Soup Industry Revenue Million Forecast, by Country 2019 & 2032
- Table 21: China Soup Industry Revenue (Million) Forecast, by Application 2019 & 2032
- Table 22: Japan Soup Industry Revenue (Million) Forecast, by Application 2019 & 2032
- Table 23: India Soup Industry Revenue (Million) Forecast, by Application 2019 & 2032
- Table 24: Australia Soup Industry Revenue (Million) Forecast, by Application 2019 & 2032
- Table 25: Rest of Asia Pacific Soup Industry Revenue (Million) Forecast, by Application 2019 & 2032
- Table 26: Global Soup Industry Revenue Million Forecast, by Country 2019 & 2032
- Table 27: Brazil Soup Industry Revenue (Million) Forecast, by Application 2019 & 2032
- Table 28: Argentina Soup Industry Revenue (Million) Forecast, by Application 2019 & 2032
- Table 29: Rest of South America Soup Industry Revenue (Million) Forecast, by Application 2019 & 2032
- Table 30: Global Soup Industry Revenue Million Forecast, by Country 2019 & 2032
- Table 31: South Africa Soup Industry Revenue (Million) Forecast, by Application 2019 & 2032
- Table 32: United Arab Emirates Soup Industry Revenue (Million) Forecast, by Application 2019 & 2032
- Table 33: Rest of Middle East and Africa Soup Industry Revenue (Million) Forecast, by Application 2019 & 2032
- Table 34: Global Soup Industry Revenue Million Forecast, by Type 2019 & 2032
- Table 35: Global Soup Industry Revenue Million Forecast, by Category 2019 & 2032
- Table 36: Global Soup Industry Revenue Million Forecast, by Packaging 2019 & 2032
- Table 37: Global Soup Industry Revenue Million Forecast, by Distribution Channel 2019 & 2032
- Table 38: Global Soup Industry Revenue Million Forecast, by Country 2019 & 2032
- Table 39: United States Soup Industry Revenue (Million) Forecast, by Application 2019 & 2032
- Table 40: Canada Soup Industry Revenue (Million) Forecast, by Application 2019 & 2032
- Table 41: Mexico Soup Industry Revenue (Million) Forecast, by Application 2019 & 2032
- Table 42: Rest of North America Soup Industry Revenue (Million) Forecast, by Application 2019 & 2032
- Table 43: Global Soup Industry Revenue Million Forecast, by Type 2019 & 2032
- Table 44: Global Soup Industry Revenue Million Forecast, by Category 2019 & 2032
- Table 45: Global Soup Industry Revenue Million Forecast, by Packaging 2019 & 2032
- Table 46: Global Soup Industry Revenue Million Forecast, by Distribution Channel 2019 & 2032
- Table 47: Global Soup Industry Revenue Million Forecast, by Country 2019 & 2032
- Table 48: Spain Soup Industry Revenue (Million) Forecast, by Application 2019 & 2032
- Table 49: United Kingdom Soup Industry Revenue (Million) Forecast, by Application 2019 & 2032
- Table 50: Germany Soup Industry Revenue (Million) Forecast, by Application 2019 & 2032
- Table 51: France Soup Industry Revenue (Million) Forecast, by Application 2019 & 2032
- Table 52: Italy Soup Industry Revenue (Million) Forecast, by Application 2019 & 2032
- Table 53: Russia Soup Industry Revenue (Million) Forecast, by Application 2019 & 2032
- Table 54: Rest of Europe Soup Industry Revenue (Million) Forecast, by Application 2019 & 2032
- Table 55: Global Soup Industry Revenue Million Forecast, by Type 2019 & 2032
- Table 56: Global Soup Industry Revenue Million Forecast, by Category 2019 & 2032
- Table 57: Global Soup Industry Revenue Million Forecast, by Packaging 2019 & 2032
- Table 58: Global Soup Industry Revenue Million Forecast, by Distribution Channel 2019 & 2032
- Table 59: Global Soup Industry Revenue Million Forecast, by Country 2019 & 2032
- Table 60: China Soup Industry Revenue (Million) Forecast, by Application 2019 & 2032
- Table 61: Japan Soup Industry Revenue (Million) Forecast, by Application 2019 & 2032
- Table 62: India Soup Industry Revenue (Million) Forecast, by Application 2019 & 2032
- Table 63: Australia Soup Industry Revenue (Million) Forecast, by Application 2019 & 2032
- Table 64: Rest of Asia Pacific Soup Industry Revenue (Million) Forecast, by Application 2019 & 2032
- Table 65: Global Soup Industry Revenue Million Forecast, by Type 2019 & 2032
- Table 66: Global Soup Industry Revenue Million Forecast, by Category 2019 & 2032
- Table 67: Global Soup Industry Revenue Million Forecast, by Packaging 2019 & 2032
- Table 68: Global Soup Industry Revenue Million Forecast, by Distribution Channel 2019 & 2032
- Table 69: Global Soup Industry Revenue Million Forecast, by Country 2019 & 2032
- Table 70: Brazil Soup Industry Revenue (Million) Forecast, by Application 2019 & 2032
- Table 71: Argentina Soup Industry Revenue (Million) Forecast, by Application 2019 & 2032
- Table 72: Rest of South America Soup Industry Revenue (Million) Forecast, by Application 2019 & 2032
- Table 73: Global Soup Industry Revenue Million Forecast, by Type 2019 & 2032
- Table 74: Global Soup Industry Revenue Million Forecast, by Category 2019 & 2032
- Table 75: Global Soup Industry Revenue Million Forecast, by Packaging 2019 & 2032
- Table 76: Global Soup Industry Revenue Million Forecast, by Distribution Channel 2019 & 2032
- Table 77: Global Soup Industry Revenue Million Forecast, by Country 2019 & 2032
- Table 78: Global Soup Industry Revenue Million Forecast, by Type 2019 & 2032
- Table 79: Global Soup Industry Revenue Million Forecast, by Category 2019 & 2032
- Table 80: Global Soup Industry Revenue Million Forecast, by Packaging 2019 & 2032
- Table 81: Global Soup Industry Revenue Million Forecast, by Distribution Channel 2019 & 2032
- Table 82: Global Soup Industry Revenue Million Forecast, by Country 2019 & 2032
- Table 83: Saudi Arabia Soup Industry Revenue (Million) Forecast, by Application 2019 & 2032
- Table 84: Rest of Middle East Soup Industry Revenue (Million) Forecast, by Application 2019 & 2032
Frequently Asked Questions
1. What is the projected Compound Annual Growth Rate (CAGR) of the Soup Industry?
The projected CAGR is approximately 2.90%.
2. Which companies are prominent players in the Soup Industry?
Key companies in the market include Ottogi Co Ltd, Nestlé SA, General Mills Inc, The Campbell Soup Company, Unilever PLC, Conagra Brands Inc, WA Baxter & Sons (Holdings) Limited, The Kraft Heinz Company, Tideford Organic Foods Limited, B&G Foods Holding Corp, Upton's Naturals Co, Premier Foods Group Limited.
3. What are the main segments of the Soup Industry?
The market segments include Type, Category, Packaging, Distribution Channel.
4. Can you provide details about the market size?
The market size is estimated to be USD XX Million as of 2022.
5. What are some drivers contributing to market growth?
Ready-to-eat and easy-to-prepare soups cater to the busy lifestyles of consumers driving demand for convenient food options.
6. What are the notable trends driving market growth?
Increased demand for plant-based and vegan diets has led to a rise in plant-based soups.
7. Are there any restraints impacting market growth?
Competition from Fresh and Homemade Alternatives.
8. Can you provide examples of recent developments in the market?
In September 2022, Tideford Organics, the UK's plant-based, vegan, and gluten-free soup brand, launched a range of new soup flavors and improved recipes and doubled its retail distribution from last year. Its Inspired line launched Indian Cauliflower Masala, Lebanese Lentil + Kale, and Malaysian Coconut + Noodle soups. As well as Butternut + Sage from its Favourites collection.
9. What pricing options are available for accessing the report?
Pricing options include single-user, multi-user, and enterprise licenses priced at USD 4750, USD 5250, and USD 8750 respectively.
10. Is the market size provided in terms of value or volume?
The market size is provided in terms of value, measured in Million.
11. Are there any specific market keywords associated with the report?
Yes, the market keyword associated with the report is "Soup Industry," which aids in identifying and referencing the specific market segment covered.
12. How do I determine which pricing option suits my needs best?
The pricing options vary based on user requirements and access needs. Individual users may opt for single-user licenses, while businesses requiring broader access may choose multi-user or enterprise licenses for cost-effective access to the report.
13. Are there any additional resources or data provided in the Soup Industry report?
While the report offers comprehensive insights, it's advisable to review the specific contents or supplementary materials provided to ascertain if additional resources or data are available.
14. How can I stay updated on further developments or reports in the Soup Industry?
To stay informed about further developments, trends, and reports in the Soup Industry, consider subscribing to industry newsletters, following relevant companies and organizations, or regularly checking reputable industry news sources and publications.
Methodology
Step 1 - Identification of Relevant Samples Size from Population Database


Step 2 - Approaches for Defining Global Market Size (Value, Volume* & Price*)

Note*: In applicable scenarios
Step 3 - Data Sources
Primary Research
- Web Analytics
- Survey Reports
- Research Institute
- Latest Research Reports
- Opinion Leaders
Secondary Research
- Annual Reports
- White Paper
- Latest Press Release
- Industry Association
- Paid Database
- Investor Presentations

Step 4 - Data Triangulation
Involves using different sources of information in order to increase the validity of a study
These sources are likely to be stakeholders in a program - participants, other researchers, program staff, other community members, and so on.
Then we put all data in single framework & apply various statistical tools to find out the dynamic on the market.
During the analysis stage, feedback from the stakeholder groups would be compared to determine areas of agreement as well as areas of divergence


