
Key Insights
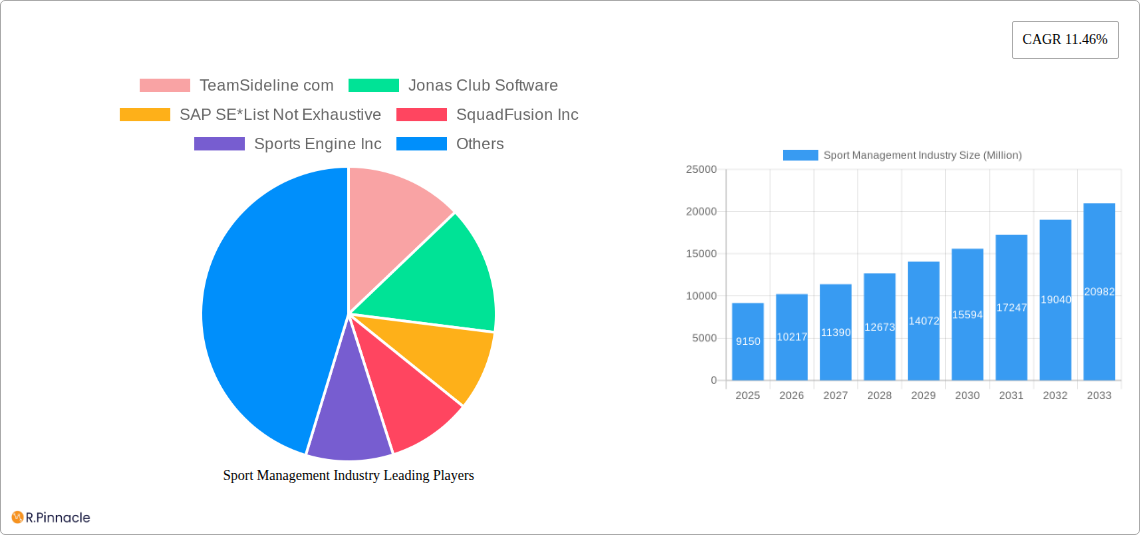
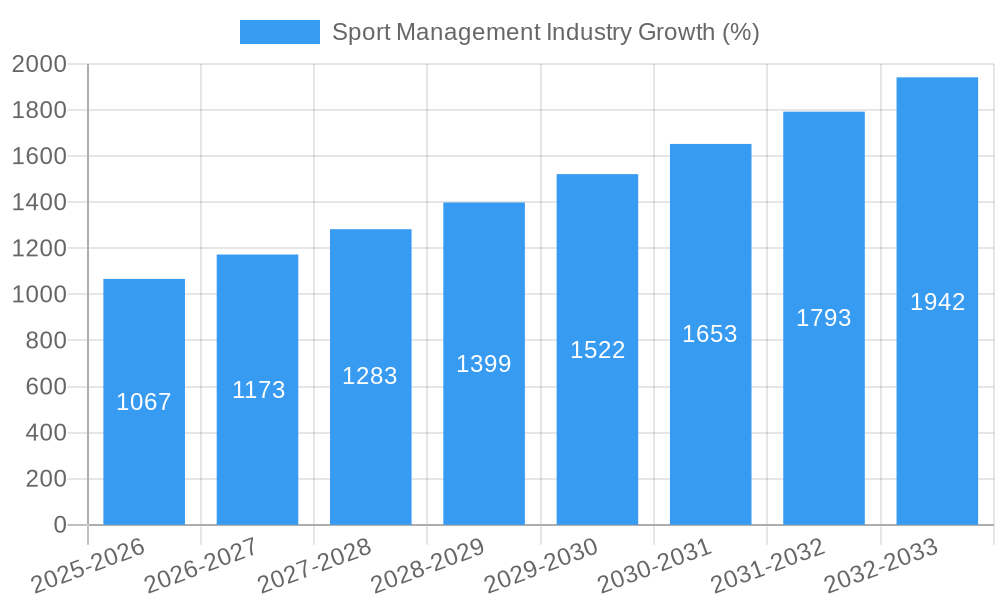
The global sports management software market, valued at $9.15 billion in 2025, is projected to experience robust growth, driven by the increasing adoption of technology within the sports industry. This expansion is fueled by several key factors. Firstly, the rising popularity of sports globally and the subsequent need for efficient management solutions are significantly boosting demand. Secondly, the increasing sophistication of sports analytics and the need for data-driven decision-making are compelling organizations to invest in advanced software solutions. Thirdly, cloud-based solutions are gaining traction, offering scalability, accessibility, and cost-effectiveness, further propelling market growth. The market's segmentation, encompassing on-premise and cloud deployments across event management, marketing, client management, and other applications, reflects the diverse needs of the sports ecosystem. Leading players, including TeamSideline, Jonas Club Software, SAP SE, SquadFusion, Sports Engine, Stack Sports, Omnify, Active Network, Jersey Watch, LeagueApps, and CourtReserve, are actively shaping the competitive landscape through innovation and strategic acquisitions. The market's growth trajectory, with a CAGR of 11.46% from 2025-2033, demonstrates considerable potential for further expansion.
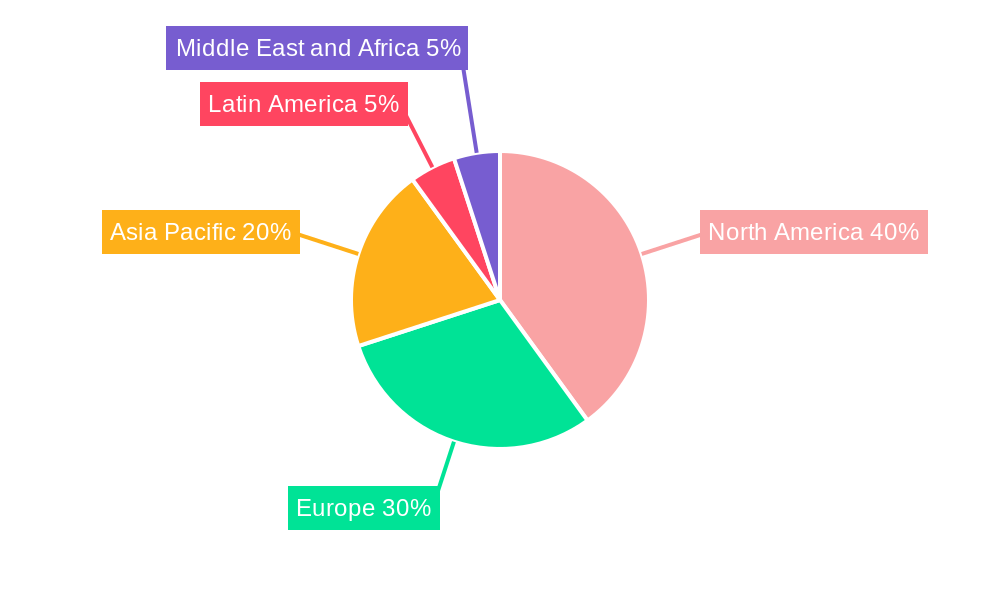
The geographical distribution of the market is expected to be diverse, with North America holding a significant market share due to the mature sports infrastructure and substantial investment in technology. Europe and Asia-Pacific are also anticipated to show strong growth, fueled by rising participation in sports and increasing technological adoption. However, the market’s growth is not without challenges. Factors such as high initial investment costs for sophisticated software and the need for ongoing training and support could potentially restrain market expansion in some regions. Furthermore, data security and privacy concerns remain crucial considerations for organizations adopting cloud-based solutions. Nevertheless, the overall outlook for the sports management software market remains positive, driven by consistent technological advancements and the ongoing professionalization of sports management at all levels.
This comprehensive report provides an in-depth analysis of the global Sport Management Industry, projecting a market value exceeding $XX Million by 2033. Ideal for industry professionals, investors, and strategic planners, this report offers actionable insights and forecasts covering the period 2019-2033 (Study Period), with a focus on the Base Year (2025) and Forecast Period (2025-2033). The Historical Period covered is 2019-2024.
Sport Management Industry Market Structure & Innovation Trends
This section analyzes the competitive landscape of the Sport Management Industry, exploring market concentration, innovation drivers, and regulatory influences. We delve into the impact of mergers and acquisitions (M&A) activity, examining deal values and their implications for market share distribution. The industry exhibits a moderately concentrated structure, with key players like SAP SE, Sports Engine Inc, and Stack Sports holding significant market shares. However, numerous smaller players, such as TeamSideline, Jonas Club Software, SquadFusion Inc, Omnify Inc, Active Network LLC, Jersey Watch, LeagueApps, and CourtReserve.com, contribute to a dynamic competitive environment.
- Market Concentration: The top 5 players hold an estimated xx% market share, leaving room for growth and competition amongst smaller players.
- Innovation Drivers: Technological advancements in software and data analytics are driving innovation, leading to more efficient management solutions. The increasing demand for personalized fan experiences also fuels innovation.
- Regulatory Frameworks: Varying regulations across different regions impact market entry and operational strategies. Compliance costs and complexities influence market dynamics.
- Product Substitutes: The emergence of simpler, cheaper alternatives poses a threat to established players, particularly in the event management segment.
- End-User Demographics: The market comprises various end-users, including professional sports organizations, amateur leagues, and individual athletes. Understanding the unique needs of each group is crucial for success.
- M&A Activities: The acquisition of Jet Sports Management by Wasserman (July 2022) highlights the increasing consolidation trend, signaling a shift towards larger, more integrated players. The total value of M&A deals in the industry exceeded $XX Million in the period 2019-2024.
Sport Management Industry Market Dynamics & Trends
This section explores the key factors driving market growth, technological disruptions, consumer preferences, and competitive dynamics within the Sport Management Industry. The market exhibits a strong growth trajectory, fueled by increasing participation in sports activities, technological advancements, and the growing adoption of data-driven decision-making. We project a Compound Annual Growth Rate (CAGR) of xx% during the forecast period (2025-2033). Market penetration of cloud-based solutions is expected to reach xx% by 2033. This growth is further supported by the rising popularity of fantasy sports and esports, generating new revenue streams and influencing the demand for sophisticated management tools. The increasing focus on fan engagement and personalized experiences through mobile applications and social media further contributes to market expansion. However, economic downturns and changing consumer preferences pose potential challenges. Competitive dynamics are shaped by technological innovation, strategic alliances, and M&A activities, continuously reshaping the market landscape.
Dominant Regions & Segments in Sport Management Industry
This section identifies the leading regions and segments within the Sport Management Industry. The North American market currently holds the largest market share, driven by strong technological infrastructure, high sports participation rates, and a favorable regulatory environment. However, the Asia-Pacific region demonstrates significant growth potential due to rising disposable incomes and a surge in sports participation.
- Leading Region: North America
- Key Drivers: Strong technological infrastructure, high sports participation rates, and a favorable regulatory environment.
- Leading Segment (Deployment): Cloud
- Key Drivers: Scalability, cost-effectiveness, and accessibility.
- Leading Segment (Application): Event Management and Scheduling
- Key Drivers: Essential for efficient operations across all sports segments.
Detailed analysis within each segment reveals the specific factors influencing market dominance. For instance, the cloud-based deployment model gains traction due to its cost-effectiveness and scalability, while event management and scheduling applications remain the most widely adopted segment, reflecting the fundamental operational needs of the sports industry.
Sport Management Industry Product Innovations
The Sport Management Industry witnesses continuous product innovation, largely driven by advancements in data analytics, mobile technology, and artificial intelligence. New applications are emerging to enhance event management, player performance analysis, and fan engagement. For example, the recent development of a new app solution by Sport:80 for the American Kennel Club's Agility League (September 2022) illustrates the ongoing adaptation to specific market segments and the integration of mobile technology. These innovations offer enhanced efficiency, data-driven insights, and improved user experiences, further shaping market competition.
Report Scope & Segmentation Analysis
This report segments the Sport Management Industry based on deployment (on-premise and cloud), and application (event management and scheduling, marketing management, client management, and other applications). Each segment exhibits distinct growth trajectories, market sizes, and competitive dynamics. For example, the cloud segment is expected to experience higher growth compared to on-premise solutions. Similarly, event management and scheduling application dominates the market, followed by marketing and client management applications. Market sizes and growth projections are provided for each segment in detail within the full report.
Key Drivers of Sport Management Industry Growth
The Sport Management Industry's growth is fueled by several factors: the increasing popularity of sports globally, advancements in technology enabling more efficient management, and the growing demand for data-driven insights. Furthermore, the rising adoption of cloud-based solutions contributes to market expansion. Finally, strategic partnerships and acquisitions further consolidate market power and fuel industry development.
Challenges in the Sport Management Industry Sector
Despite the significant growth potential, the Sport Management Industry faces challenges. These include high initial investment costs for software and technology, the need for continuous software updates and maintenance, and intense competition among providers. Additionally, data security and privacy concerns remain key obstacles to market expansion.
Emerging Opportunities in Sport Management Industry
The industry presents significant opportunities in emerging markets, particularly in developing economies with growing sports participation. The integration of artificial intelligence (AI) and machine learning (ML) for performance analysis and predictive modeling offers promising growth areas. Furthermore, the increasing adoption of mobile technology opens avenues for enhanced fan engagement and personalized experiences.
Leading Players in the Sport Management Industry Market
- TeamSideline.com
- Jonas Club Software
- SAP SE
- SquadFusion Inc
- Sports Engine Inc
- Stack Sports
- Omnify Inc
- Active Network LLC
- Jersey Watch
- LeagueApps
- CourtReserve.com
Key Developments in Sport Management Industry Industry
- September 2022: Sport:80 launches a new app for the American Kennel Club's Agility League, showcasing the increasing adoption of mobile technology in niche sports segments.
- July 2022: Wasserman's acquisition of Jet Sports Management signifies industry consolidation and expansion into the MLB market. This acquisition highlights the strategic importance of M&A activities in shaping market dynamics.
Future Outlook for Sport Management Industry Market
The Sport Management Industry anticipates sustained growth driven by technological advancements, expanding sports participation globally, and the increasing demand for data-driven decision-making. The integration of AI and ML will further enhance efficiency and provide valuable insights, leading to greater market penetration and improved customer experience. The industry is poised for substantial growth in the coming years, with continued consolidation and innovation shaping the market landscape.
Sport Management Industry Segmentation
-
1. Deployment
- 1.1. On-Premise
- 1.2. Cloud
-
2. Application
- 2.1. Event Management and Scheduling
- 2.2. Marketing Management
- 2.3. Client Management
- 2.4. Other Applications
Sport Management Industry Segmentation By Geography
- 1. North America
- 2. Europe
- 3. Asia Pacific
- 4. Latin America
- 5. Middle East and Africa
Sport Management Industry REPORT HIGHLIGHTS
| Aspects | Details |
|---|---|
| Study Period | 2019-2033 |
| Base Year | 2024 |
| Estimated Year | 2025 |
| Forecast Period | 2025-2033 |
| Historical Period | 2019-2024 |
| Growth Rate | CAGR of 11.46% from 2019-2033 |
| Segmentation |
|
Table of Contents
- 1. Introduction
- 1.1. Research Scope
- 1.2. Market Segmentation
- 1.3. Research Methodology
- 1.4. Definitions and Assumptions
- 2. Executive Summary
- 2.1. Introduction
- 3. Market Dynamics
- 3.1. Introduction
- 3.2. Market Drivers
- 3.2.1. Growing Investment in Sports Industry; Growing Inclination of Sports League Among Women
- 3.3. Market Restrains
- 3.3.1. Data Security Issue
- 3.4. Market Trends
- 3.4.1. Growing Inclination of Sports League Among Women
- 4. Market Factor Analysis
- 4.1. Porters Five Forces
- 4.2. Supply/Value Chain
- 4.3. PESTEL analysis
- 4.4. Market Entropy
- 4.5. Patent/Trademark Analysis
- 5. Global Sport Management Industry Analysis, Insights and Forecast, 2019-2031
- 5.1. Market Analysis, Insights and Forecast - by Deployment
- 5.1.1. On-Premise
- 5.1.2. Cloud
- 5.2. Market Analysis, Insights and Forecast - by Application
- 5.2.1. Event Management and Scheduling
- 5.2.2. Marketing Management
- 5.2.3. Client Management
- 5.2.4. Other Applications
- 5.3. Market Analysis, Insights and Forecast - by Region
- 5.3.1. North America
- 5.3.2. Europe
- 5.3.3. Asia Pacific
- 5.3.4. Latin America
- 5.3.5. Middle East and Africa
- 5.1. Market Analysis, Insights and Forecast - by Deployment
- 6. North America Sport Management Industry Analysis, Insights and Forecast, 2019-2031
- 6.1. Market Analysis, Insights and Forecast - by Deployment
- 6.1.1. On-Premise
- 6.1.2. Cloud
- 6.2. Market Analysis, Insights and Forecast - by Application
- 6.2.1. Event Management and Scheduling
- 6.2.2. Marketing Management
- 6.2.3. Client Management
- 6.2.4. Other Applications
- 6.1. Market Analysis, Insights and Forecast - by Deployment
- 7. Europe Sport Management Industry Analysis, Insights and Forecast, 2019-2031
- 7.1. Market Analysis, Insights and Forecast - by Deployment
- 7.1.1. On-Premise
- 7.1.2. Cloud
- 7.2. Market Analysis, Insights and Forecast - by Application
- 7.2.1. Event Management and Scheduling
- 7.2.2. Marketing Management
- 7.2.3. Client Management
- 7.2.4. Other Applications
- 7.1. Market Analysis, Insights and Forecast - by Deployment
- 8. Asia Pacific Sport Management Industry Analysis, Insights and Forecast, 2019-2031
- 8.1. Market Analysis, Insights and Forecast - by Deployment
- 8.1.1. On-Premise
- 8.1.2. Cloud
- 8.2. Market Analysis, Insights and Forecast - by Application
- 8.2.1. Event Management and Scheduling
- 8.2.2. Marketing Management
- 8.2.3. Client Management
- 8.2.4. Other Applications
- 8.1. Market Analysis, Insights and Forecast - by Deployment
- 9. Latin America Sport Management Industry Analysis, Insights and Forecast, 2019-2031
- 9.1. Market Analysis, Insights and Forecast - by Deployment
- 9.1.1. On-Premise
- 9.1.2. Cloud
- 9.2. Market Analysis, Insights and Forecast - by Application
- 9.2.1. Event Management and Scheduling
- 9.2.2. Marketing Management
- 9.2.3. Client Management
- 9.2.4. Other Applications
- 9.1. Market Analysis, Insights and Forecast - by Deployment
- 10. Middle East and Africa Sport Management Industry Analysis, Insights and Forecast, 2019-2031
- 10.1. Market Analysis, Insights and Forecast - by Deployment
- 10.1.1. On-Premise
- 10.1.2. Cloud
- 10.2. Market Analysis, Insights and Forecast - by Application
- 10.2.1. Event Management and Scheduling
- 10.2.2. Marketing Management
- 10.2.3. Client Management
- 10.2.4. Other Applications
- 10.1. Market Analysis, Insights and Forecast - by Deployment
- 11. North America Sport Management Industry Analysis, Insights and Forecast, 2019-2031
- 11.1. Market Analysis, Insights and Forecast - By Country/Sub-region
- 11.1.1.
- 12. Europe Sport Management Industry Analysis, Insights and Forecast, 2019-2031
- 12.1. Market Analysis, Insights and Forecast - By Country/Sub-region
- 12.1.1.
- 13. Asia Pacific Sport Management Industry Analysis, Insights and Forecast, 2019-2031
- 13.1. Market Analysis, Insights and Forecast - By Country/Sub-region
- 13.1.1.
- 14. Latin America Sport Management Industry Analysis, Insights and Forecast, 2019-2031
- 14.1. Market Analysis, Insights and Forecast - By Country/Sub-region
- 14.1.1.
- 15. Middle East and Africa Sport Management Industry Analysis, Insights and Forecast, 2019-2031
- 15.1. Market Analysis, Insights and Forecast - By Country/Sub-region
- 15.1.1.
- 16. Competitive Analysis
- 16.1. Global Market Share Analysis 2024
- 16.2. Company Profiles
- 16.2.1 TeamSideline com
- 16.2.1.1. Overview
- 16.2.1.2. Products
- 16.2.1.3. SWOT Analysis
- 16.2.1.4. Recent Developments
- 16.2.1.5. Financials (Based on Availability)
- 16.2.2 Jonas Club Software
- 16.2.2.1. Overview
- 16.2.2.2. Products
- 16.2.2.3. SWOT Analysis
- 16.2.2.4. Recent Developments
- 16.2.2.5. Financials (Based on Availability)
- 16.2.3 SAP SE*List Not Exhaustive
- 16.2.3.1. Overview
- 16.2.3.2. Products
- 16.2.3.3. SWOT Analysis
- 16.2.3.4. Recent Developments
- 16.2.3.5. Financials (Based on Availability)
- 16.2.4 SquadFusion Inc
- 16.2.4.1. Overview
- 16.2.4.2. Products
- 16.2.4.3. SWOT Analysis
- 16.2.4.4. Recent Developments
- 16.2.4.5. Financials (Based on Availability)
- 16.2.5 Sports Engine Inc
- 16.2.5.1. Overview
- 16.2.5.2. Products
- 16.2.5.3. SWOT Analysis
- 16.2.5.4. Recent Developments
- 16.2.5.5. Financials (Based on Availability)
- 16.2.6 Stack Sports
- 16.2.6.1. Overview
- 16.2.6.2. Products
- 16.2.6.3. SWOT Analysis
- 16.2.6.4. Recent Developments
- 16.2.6.5. Financials (Based on Availability)
- 16.2.7 Omnify Inc
- 16.2.7.1. Overview
- 16.2.7.2. Products
- 16.2.7.3. SWOT Analysis
- 16.2.7.4. Recent Developments
- 16.2.7.5. Financials (Based on Availability)
- 16.2.8 Active Network LLC
- 16.2.8.1. Overview
- 16.2.8.2. Products
- 16.2.8.3. SWOT Analysis
- 16.2.8.4. Recent Developments
- 16.2.8.5. Financials (Based on Availability)
- 16.2.9 Jersey Watch
- 16.2.9.1. Overview
- 16.2.9.2. Products
- 16.2.9.3. SWOT Analysis
- 16.2.9.4. Recent Developments
- 16.2.9.5. Financials (Based on Availability)
- 16.2.10 LeagueApps
- 16.2.10.1. Overview
- 16.2.10.2. Products
- 16.2.10.3. SWOT Analysis
- 16.2.10.4. Recent Developments
- 16.2.10.5. Financials (Based on Availability)
- 16.2.11 CourtReserve com
- 16.2.11.1. Overview
- 16.2.11.2. Products
- 16.2.11.3. SWOT Analysis
- 16.2.11.4. Recent Developments
- 16.2.11.5. Financials (Based on Availability)
- 16.2.1 TeamSideline com
List of Figures
- Figure 1: Global Sport Management Industry Revenue Breakdown (Million, %) by Region 2024 & 2032
- Figure 2: North America Sport Management Industry Revenue (Million), by Country 2024 & 2032
- Figure 3: North America Sport Management Industry Revenue Share (%), by Country 2024 & 2032
- Figure 4: Europe Sport Management Industry Revenue (Million), by Country 2024 & 2032
- Figure 5: Europe Sport Management Industry Revenue Share (%), by Country 2024 & 2032
- Figure 6: Asia Pacific Sport Management Industry Revenue (Million), by Country 2024 & 2032
- Figure 7: Asia Pacific Sport Management Industry Revenue Share (%), by Country 2024 & 2032
- Figure 8: Latin America Sport Management Industry Revenue (Million), by Country 2024 & 2032
- Figure 9: Latin America Sport Management Industry Revenue Share (%), by Country 2024 & 2032
- Figure 10: Middle East and Africa Sport Management Industry Revenue (Million), by Country 2024 & 2032
- Figure 11: Middle East and Africa Sport Management Industry Revenue Share (%), by Country 2024 & 2032
- Figure 12: North America Sport Management Industry Revenue (Million), by Deployment 2024 & 2032
- Figure 13: North America Sport Management Industry Revenue Share (%), by Deployment 2024 & 2032
- Figure 14: North America Sport Management Industry Revenue (Million), by Application 2024 & 2032
- Figure 15: North America Sport Management Industry Revenue Share (%), by Application 2024 & 2032
- Figure 16: North America Sport Management Industry Revenue (Million), by Country 2024 & 2032
- Figure 17: North America Sport Management Industry Revenue Share (%), by Country 2024 & 2032
- Figure 18: Europe Sport Management Industry Revenue (Million), by Deployment 2024 & 2032
- Figure 19: Europe Sport Management Industry Revenue Share (%), by Deployment 2024 & 2032
- Figure 20: Europe Sport Management Industry Revenue (Million), by Application 2024 & 2032
- Figure 21: Europe Sport Management Industry Revenue Share (%), by Application 2024 & 2032
- Figure 22: Europe Sport Management Industry Revenue (Million), by Country 2024 & 2032
- Figure 23: Europe Sport Management Industry Revenue Share (%), by Country 2024 & 2032
- Figure 24: Asia Pacific Sport Management Industry Revenue (Million), by Deployment 2024 & 2032
- Figure 25: Asia Pacific Sport Management Industry Revenue Share (%), by Deployment 2024 & 2032
- Figure 26: Asia Pacific Sport Management Industry Revenue (Million), by Application 2024 & 2032
- Figure 27: Asia Pacific Sport Management Industry Revenue Share (%), by Application 2024 & 2032
- Figure 28: Asia Pacific Sport Management Industry Revenue (Million), by Country 2024 & 2032
- Figure 29: Asia Pacific Sport Management Industry Revenue Share (%), by Country 2024 & 2032
- Figure 30: Latin America Sport Management Industry Revenue (Million), by Deployment 2024 & 2032
- Figure 31: Latin America Sport Management Industry Revenue Share (%), by Deployment 2024 & 2032
- Figure 32: Latin America Sport Management Industry Revenue (Million), by Application 2024 & 2032
- Figure 33: Latin America Sport Management Industry Revenue Share (%), by Application 2024 & 2032
- Figure 34: Latin America Sport Management Industry Revenue (Million), by Country 2024 & 2032
- Figure 35: Latin America Sport Management Industry Revenue Share (%), by Country 2024 & 2032
- Figure 36: Middle East and Africa Sport Management Industry Revenue (Million), by Deployment 2024 & 2032
- Figure 37: Middle East and Africa Sport Management Industry Revenue Share (%), by Deployment 2024 & 2032
- Figure 38: Middle East and Africa Sport Management Industry Revenue (Million), by Application 2024 & 2032
- Figure 39: Middle East and Africa Sport Management Industry Revenue Share (%), by Application 2024 & 2032
- Figure 40: Middle East and Africa Sport Management Industry Revenue (Million), by Country 2024 & 2032
- Figure 41: Middle East and Africa Sport Management Industry Revenue Share (%), by Country 2024 & 2032
List of Tables
- Table 1: Global Sport Management Industry Revenue Million Forecast, by Region 2019 & 2032
- Table 2: Global Sport Management Industry Revenue Million Forecast, by Deployment 2019 & 2032
- Table 3: Global Sport Management Industry Revenue Million Forecast, by Application 2019 & 2032
- Table 4: Global Sport Management Industry Revenue Million Forecast, by Region 2019 & 2032
- Table 5: Global Sport Management Industry Revenue Million Forecast, by Country 2019 & 2032
- Table 6: Sport Management Industry Revenue (Million) Forecast, by Application 2019 & 2032
- Table 7: Global Sport Management Industry Revenue Million Forecast, by Country 2019 & 2032
- Table 8: Sport Management Industry Revenue (Million) Forecast, by Application 2019 & 2032
- Table 9: Global Sport Management Industry Revenue Million Forecast, by Country 2019 & 2032
- Table 10: Sport Management Industry Revenue (Million) Forecast, by Application 2019 & 2032
- Table 11: Global Sport Management Industry Revenue Million Forecast, by Country 2019 & 2032
- Table 12: Sport Management Industry Revenue (Million) Forecast, by Application 2019 & 2032
- Table 13: Global Sport Management Industry Revenue Million Forecast, by Country 2019 & 2032
- Table 14: Sport Management Industry Revenue (Million) Forecast, by Application 2019 & 2032
- Table 15: Global Sport Management Industry Revenue Million Forecast, by Deployment 2019 & 2032
- Table 16: Global Sport Management Industry Revenue Million Forecast, by Application 2019 & 2032
- Table 17: Global Sport Management Industry Revenue Million Forecast, by Country 2019 & 2032
- Table 18: Global Sport Management Industry Revenue Million Forecast, by Deployment 2019 & 2032
- Table 19: Global Sport Management Industry Revenue Million Forecast, by Application 2019 & 2032
- Table 20: Global Sport Management Industry Revenue Million Forecast, by Country 2019 & 2032
- Table 21: Global Sport Management Industry Revenue Million Forecast, by Deployment 2019 & 2032
- Table 22: Global Sport Management Industry Revenue Million Forecast, by Application 2019 & 2032
- Table 23: Global Sport Management Industry Revenue Million Forecast, by Country 2019 & 2032
- Table 24: Global Sport Management Industry Revenue Million Forecast, by Deployment 2019 & 2032
- Table 25: Global Sport Management Industry Revenue Million Forecast, by Application 2019 & 2032
- Table 26: Global Sport Management Industry Revenue Million Forecast, by Country 2019 & 2032
- Table 27: Global Sport Management Industry Revenue Million Forecast, by Deployment 2019 & 2032
- Table 28: Global Sport Management Industry Revenue Million Forecast, by Application 2019 & 2032
- Table 29: Global Sport Management Industry Revenue Million Forecast, by Country 2019 & 2032
Frequently Asked Questions
1. What is the projected Compound Annual Growth Rate (CAGR) of the Sport Management Industry?
The projected CAGR is approximately 11.46%.
2. Which companies are prominent players in the Sport Management Industry?
Key companies in the market include TeamSideline com, Jonas Club Software, SAP SE*List Not Exhaustive, SquadFusion Inc, Sports Engine Inc, Stack Sports, Omnify Inc, Active Network LLC, Jersey Watch, LeagueApps, CourtReserve com.
3. What are the main segments of the Sport Management Industry?
The market segments include Deployment, Application.
4. Can you provide details about the market size?
The market size is estimated to be USD 9.15 Million as of 2022.
5. What are some drivers contributing to market growth?
Growing Investment in Sports Industry; Growing Inclination of Sports League Among Women.
6. What are the notable trends driving market growth?
Growing Inclination of Sports League Among Women.
7. Are there any restraints impacting market growth?
Data Security Issue.
8. Can you provide examples of recent developments in the market?
September 2022 - Sport:80 develop a new app solution to support American Kennel Club (AKC) in their online AKC Agility League. Through the app, Agility competitors can create and register their teams, access and download course information to set up local courses at their convenience and upload their scores upon completion.
9. What pricing options are available for accessing the report?
Pricing options include single-user, multi-user, and enterprise licenses priced at USD 4750, USD 5250, and USD 8750 respectively.
10. Is the market size provided in terms of value or volume?
The market size is provided in terms of value, measured in Million.
11. Are there any specific market keywords associated with the report?
Yes, the market keyword associated with the report is "Sport Management Industry," which aids in identifying and referencing the specific market segment covered.
12. How do I determine which pricing option suits my needs best?
The pricing options vary based on user requirements and access needs. Individual users may opt for single-user licenses, while businesses requiring broader access may choose multi-user or enterprise licenses for cost-effective access to the report.
13. Are there any additional resources or data provided in the Sport Management Industry report?
While the report offers comprehensive insights, it's advisable to review the specific contents or supplementary materials provided to ascertain if additional resources or data are available.
14. How can I stay updated on further developments or reports in the Sport Management Industry?
To stay informed about further developments, trends, and reports in the Sport Management Industry, consider subscribing to industry newsletters, following relevant companies and organizations, or regularly checking reputable industry news sources and publications.
Methodology
Step 1 - Identification of Relevant Samples Size from Population Database


Step 2 - Approaches for Defining Global Market Size (Value, Volume* & Price*)

Note*: In applicable scenarios
Step 3 - Data Sources
Primary Research
- Web Analytics
- Survey Reports
- Research Institute
- Latest Research Reports
- Opinion Leaders
Secondary Research
- Annual Reports
- White Paper
- Latest Press Release
- Industry Association
- Paid Database
- Investor Presentations

Step 4 - Data Triangulation
Involves using different sources of information in order to increase the validity of a study
These sources are likely to be stakeholders in a program - participants, other researchers, program staff, other community members, and so on.
Then we put all data in single framework & apply various statistical tools to find out the dynamic on the market.
During the analysis stage, feedback from the stakeholder groups would be compared to determine areas of agreement as well as areas of divergence


