
Key Insights
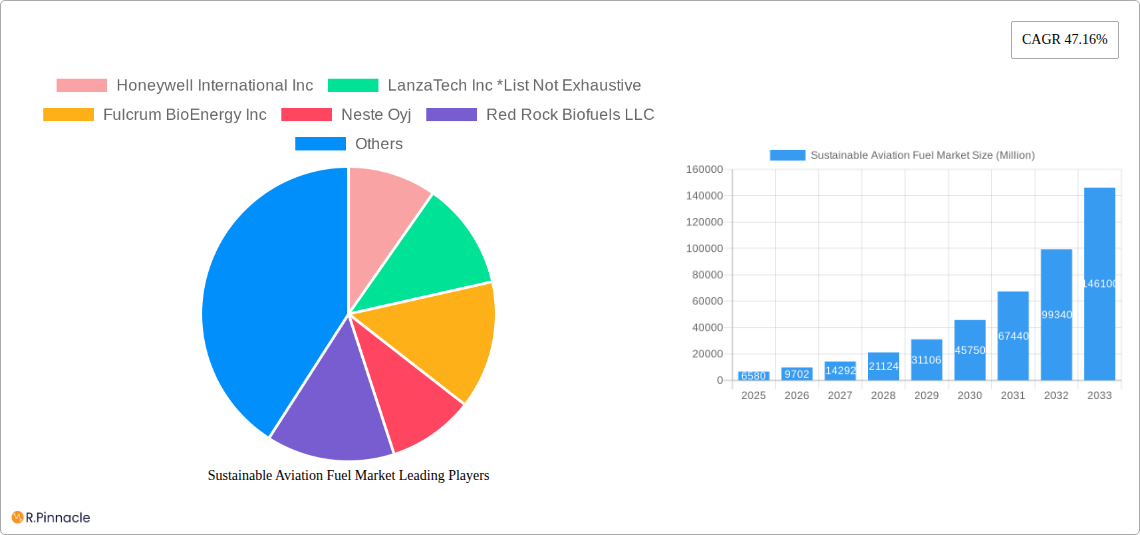
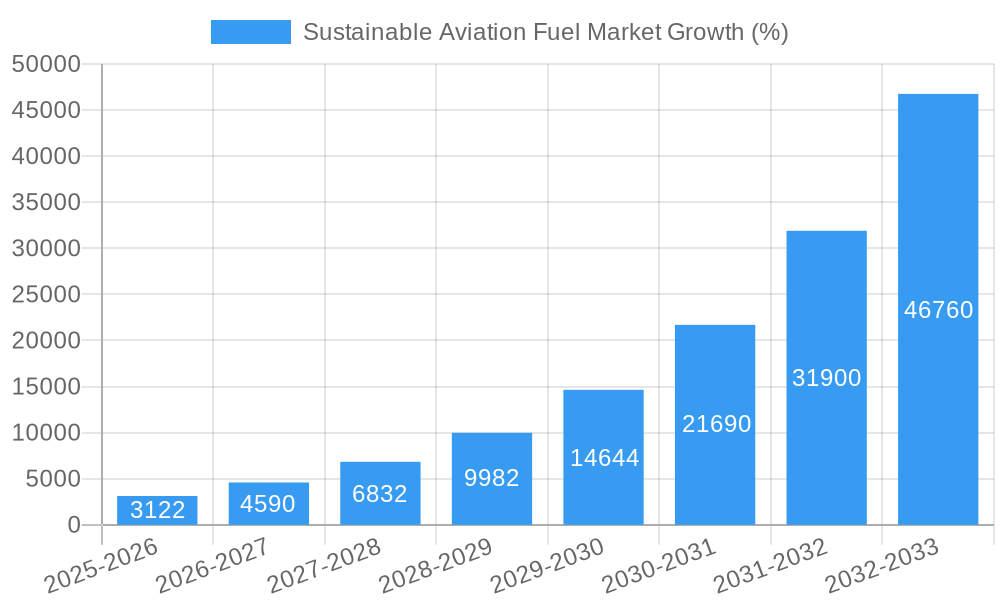
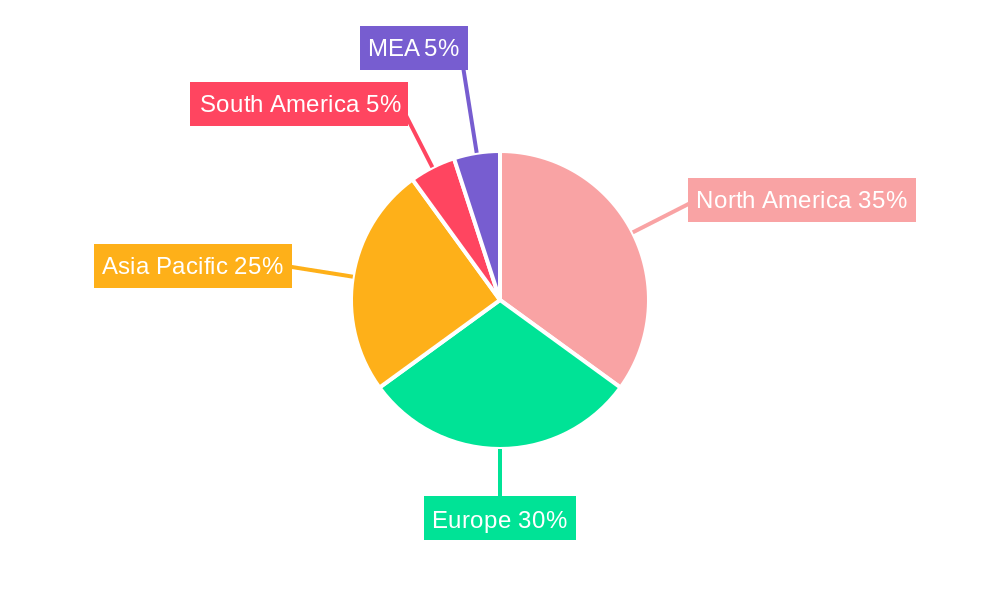
The Sustainable Aviation Fuel (SAF) market is experiencing rapid growth, projected to reach a substantial size driven by increasing environmental concerns and stringent regulations aimed at reducing aviation's carbon footprint. The market's Compound Annual Growth Rate (CAGR) of 47.16% from 2019-2033 indicates significant expansion, with a market value of $6.58 billion in 2025. Key drivers include the rising demand for environmentally friendly alternatives to traditional jet fuel, government incentives and policies promoting SAF adoption, and technological advancements in SAF production, particularly in areas like Fischer-Tropsch (FT) synthesis, Hydroprocessed Esters and Fatty Acids (HEFA), Synthesized Iso-Paraffinic (SIP), and Alcohol-to-Jet (AJT) technologies. The commercial aviation sector currently dominates application, but the defense sector is anticipated to show strong growth in SAF consumption in the coming years. Major players like Honeywell, LanzaTech, Neste, and others are investing heavily in research, development, and production capacity to meet the surging demand. Regional growth is expected to be robust across North America, Europe, and Asia Pacific, driven by varying levels of government support and the presence of established aviation hubs. However, challenges remain, including the relatively higher cost of SAF compared to conventional jet fuel and the need for further technological advancements to enhance production efficiency and reduce costs.
The competitive landscape is dynamic, with established energy companies and specialized biofuel producers vying for market share. Strategic partnerships, mergers, and acquisitions are likely to shape the market's evolution. To address the challenges, ongoing research is focused on improving feedstock availability and developing more efficient and cost-effective production methods, utilizing a broader range of sustainable feedstocks including waste oils, agricultural residues, and even captured carbon dioxide. The long-term outlook for the SAF market is extremely positive, with the potential for substantial growth driven by increasing environmental awareness, tightening regulations, and continuous technological innovation, making it a key component of the global transition to a more sustainable aviation industry.
Sustainable Aviation Fuel Market Report: 2019-2033
This comprehensive report provides an in-depth analysis of the Sustainable Aviation Fuel (SAF) market, offering invaluable insights for industry professionals, investors, and policymakers. Covering the period from 2019 to 2033, with a focus on 2025, this report dissects market dynamics, technological advancements, and competitive landscapes to illuminate the future of sustainable aviation. The report projects a xx Million market value by 2033, showcasing significant growth opportunities.
Sustainable Aviation Fuel Market Structure & Innovation Trends
This section analyzes the market's competitive landscape, encompassing market concentration, innovation drivers, regulatory frameworks, and M&A activities. We examine the market share held by key players like Honeywell International Inc, LanzaTech Inc, Fulcrum BioEnergy Inc, Neste Oyj, Red Rock Biofuels LLC, Swedish Biofuels AB, SG Preston Company, TotalEnergies SE, and Gevo Inc (list not exhaustive), and assess the impact of mergers and acquisitions, with estimated deal values reaching xx Million in recent years. Innovation drivers, such as government incentives and stringent emission regulations, are thoroughly explored. The analysis includes a detailed overview of the regulatory landscape impacting SAF production and adoption, alongside an evaluation of potential substitute fuels and their impact on market dynamics. End-user demographics, including the commercial, defense, and industrial sectors, are considered, and their influence on market growth is carefully assessed.
Sustainable Aviation Fuel Market Dynamics & Trends
This section delves into the key factors shaping the SAF market's trajectory. We analyze market growth drivers, such as the increasing demand for sustainable transportation solutions and rising environmental concerns. Technological disruptions, such as advancements in SAF production technologies (Fischer-Tropsch (FT), Hydroprocessed Esters and Fatty Acids (HEFA), Synthesized Iso-Paraffinic (SIP), and Alcohol-to-Jet (AJT)), are examined, alongside their impact on cost reduction and efficiency improvements. We project a CAGR of xx% for the forecast period (2025-2033), with market penetration expected to reach xx% by 2033. The analysis also considers consumer preferences toward sustainable travel options and the competitive dynamics among SAF producers, including pricing strategies and market positioning.
Dominant Regions & Segments in Sustainable Aviation Fuel Market
This section identifies the leading regions and segments within the SAF market. Analysis considers key geographical areas and their respective market shares, along with a deep dive into the performance of different SAF technologies (FT, HEFA, SIP, AJT) and applications (Commercial, Defense).
Leading Regions: [Insert analysis of dominant regions, e.g., North America, Europe, etc. Include reasons for dominance, such as supportive government policies, robust infrastructure, or high demand.]
Dominant Technology: [Specify dominant technology (e.g., HEFA) with supporting data and reasons for its leadership. ]
Leading Application: [Specify leading application (e.g., Commercial Aviation) with supporting data and reasons for its dominance.]
The analysis assesses the influence of economic policies, infrastructure development, and technological advancements on regional and segmental market leadership.
Sustainable Aviation Fuel Market Product Innovations
Recent years have witnessed significant advancements in SAF production technologies, leading to more efficient and cost-effective processes. New product applications are expanding beyond commercial aviation to encompass defense and industrial sectors. This innovation is driving competitive advantages, with companies focusing on improving fuel properties, reducing production costs, and expanding feedstock options to meet the growing demand for sustainable aviation fuel. The market is witnessing a shift towards more sustainable and efficient production processes, enhancing the competitiveness of SAF compared to traditional jet fuel.
Report Scope & Segmentation Analysis
This report segments the Sustainable Aviation Fuel market based on Technology (Fischer-Tropsch (FT), Hydroprocessed Esters and Fatty Acids (HEFA), Synthesized Iso-Paraffinic (SIP), and Alcohol-to-Jet (AJT)) and Application (Commercial, Defense). Each segment is analyzed individually, providing detailed growth projections, market size estimations for the period 2019-2033, and a competitive landscape analysis, including key players and their market strategies.
Technology Segments: [Paragraph for each technology segment, including market size, growth projections, and key players.]
Application Segments: [Paragraph for each application segment, including market size, growth projections, and key players.]
Key Drivers of Sustainable Aviation Fuel Market Growth
The growth of the SAF market is propelled by several key factors. Stringent environmental regulations aimed at reducing aviation's carbon footprint are driving the adoption of SAF. Technological advancements are improving the efficiency and cost-effectiveness of SAF production, making it a more viable alternative to traditional jet fuel. Growing consumer awareness of environmental issues and a preference for sustainable travel options are further bolstering market growth. Significant investments from both public and private sectors are also facilitating the expansion of SAF production capacity.
Challenges in the Sustainable Aviation Fuel Market Sector
Despite its growth potential, the SAF market faces several challenges. High production costs compared to conventional jet fuel remain a significant barrier to widespread adoption. Supply chain constraints, including the availability of sustainable feedstocks, pose another challenge. Regulatory frameworks, while supportive in some regions, lack consistency globally, hindering broader market expansion. Furthermore, the competition from other low-carbon aviation fuels and technological limitations in certain production processes create challenges to market penetration.
Emerging Opportunities in Sustainable Aviation Fuel Market
The SAF market presents several emerging opportunities. The expansion into new geographic markets with supportive government policies offers significant potential for growth. Technological advancements, such as the development of advanced biofuels and electrofuels, will further enhance the cost-competitiveness and sustainability of SAF. Growing collaborations between airlines, fuel producers, and technology developers are opening up new avenues for market expansion. The increasing demand for sustainable solutions from various sectors beyond aviation also creates opportunities to diversify the use of SAF.
Leading Players in the Sustainable Aviation Fuel Market Market
- Honeywell International Inc [Link to Honeywell's global website]
- LanzaTech Inc [Link to LanzaTech's global website]
- Fulcrum BioEnergy Inc [Link to Fulcrum BioEnergy's website]
- Neste Oyj [Link to Neste's global website]
- Red Rock Biofuels LLC [Link to Red Rock Biofuels' website]
- Swedish Biofuels AB [Link to Swedish Biofuels' website]
- SG Preston Company [Link to SG Preston Company's website, if available]
- TotalEnergies SE [Link to TotalEnergies' global website]
- Gevo Inc [Link to Gevo's global website]
Key Developments in Sustainable Aviation Fuel Market Industry
May 2023: Twelve and Etihad Airways signed a Memorandum of Understanding (MOU) to collaborate on the advancement of E-Jet® fuel, a sustainable aviation fuel made from CO2 and renewable energy, and plans for an international demonstration flight and supply roadmap. This development showcases the growing interest in innovative SAF production methods and collaborative efforts to support the airline industry’s sustainability goals.
February 2022: Engie SA and Infinium Holdings announced a EUR 500 Million project to produce renewable aviation and maritime fuels in northern France. The project's expected commencement in 2026 signifies significant investment in SAF production infrastructure and contributes to the expansion of SAF supply chains in Europe.
February 2022: Boeing announced a supply agreement for two million gallons of blended renewable aviation fuel with EPIC Fuels to power its commercial operations in Washington State and South Carolina by the end of 2022. This signals the increasing adoption of SAF by major airlines and strengthens the demand for commercially viable SAF solutions.
Future Outlook for Sustainable Aviation Fuel Market Market
The future of the SAF market is promising, driven by continued technological advancements, supportive government policies, and increasing consumer demand for sustainable travel options. The market is poised for substantial growth, with a projected xx Million market value by 2033. Strategic partnerships and investments in research and development will be key to accelerating market penetration and ensuring the long-term success of SAF as a critical component of sustainable aviation.
Sustainable Aviation Fuel Market Segmentation
-
1. Technology
- 1.1. Fischer-Tropsch (FT)
- 1.2. Hydroprocessed Esters and Fatty Acids (HEFA)
- 1.3. Synthesi
-
2. Application
- 2.1. Commercial
- 2.2. Defense
Sustainable Aviation Fuel Market Segmentation By Geography
-
1. North America
- 1.1. United States of America
- 1.2. Canada
- 1.3. Rest of the North America
-
2. Asia Pacific
- 2.1. China
- 2.2. India
- 2.3. Japan
- 2.4. Rest of the Asia Pacific
-
3. Europe
- 3.1. United Kingdom
- 3.2. France
- 3.3. Germany
- 3.4. Rest of the Europe
-
4. South America
- 4.1. Brazil
- 4.2. Argentina
- 4.3. Rest of the South America
-
5. Middle East and Africa
- 5.1. United Arab Emirates
- 5.2. Saudi Arabia
- 5.3. Qatar
- 5.4. Rest of the Middle East and Africa
Sustainable Aviation Fuel Market REPORT HIGHLIGHTS
| Aspects | Details |
|---|---|
| Study Period | 2019-2033 |
| Base Year | 2024 |
| Estimated Year | 2025 |
| Forecast Period | 2025-2033 |
| Historical Period | 2019-2024 |
| Growth Rate | CAGR of 47.16% from 2019-2033 |
| Segmentation |
|
Table of Contents
- 1. Introduction
- 1.1. Research Scope
- 1.2. Market Segmentation
- 1.3. Research Methodology
- 1.4. Definitions and Assumptions
- 2. Executive Summary
- 2.1. Introduction
- 3. Market Dynamics
- 3.1. Introduction
- 3.2. Market Drivers
- 3.2.1. 4.; Increased Government Regulations for Greenhouse Gas Emissions 4.; Encouraging Production and Consumption of Renewable Aviation Fuel
- 3.3. Market Restrains
- 3.3.1. 4.; The High Costs of Renewable Aviation Fuel
- 3.4. Market Trends
- 3.4.1. Hydroprocessed Esters and Fatty Acids (HEFA) Technology to Dominate the Market
- 4. Market Factor Analysis
- 4.1. Porters Five Forces
- 4.2. Supply/Value Chain
- 4.3. PESTEL analysis
- 4.4. Market Entropy
- 4.5. Patent/Trademark Analysis
- 5. Global Sustainable Aviation Fuel Market Analysis, Insights and Forecast, 2019-2031
- 5.1. Market Analysis, Insights and Forecast - by Technology
- 5.1.1. Fischer-Tropsch (FT)
- 5.1.2. Hydroprocessed Esters and Fatty Acids (HEFA)
- 5.1.3. Synthesi
- 5.2. Market Analysis, Insights and Forecast - by Application
- 5.2.1. Commercial
- 5.2.2. Defense
- 5.3. Market Analysis, Insights and Forecast - by Region
- 5.3.1. North America
- 5.3.2. Asia Pacific
- 5.3.3. Europe
- 5.3.4. South America
- 5.3.5. Middle East and Africa
- 5.1. Market Analysis, Insights and Forecast - by Technology
- 6. North America Sustainable Aviation Fuel Market Analysis, Insights and Forecast, 2019-2031
- 6.1. Market Analysis, Insights and Forecast - by Technology
- 6.1.1. Fischer-Tropsch (FT)
- 6.1.2. Hydroprocessed Esters and Fatty Acids (HEFA)
- 6.1.3. Synthesi
- 6.2. Market Analysis, Insights and Forecast - by Application
- 6.2.1. Commercial
- 6.2.2. Defense
- 6.1. Market Analysis, Insights and Forecast - by Technology
- 7. Asia Pacific Sustainable Aviation Fuel Market Analysis, Insights and Forecast, 2019-2031
- 7.1. Market Analysis, Insights and Forecast - by Technology
- 7.1.1. Fischer-Tropsch (FT)
- 7.1.2. Hydroprocessed Esters and Fatty Acids (HEFA)
- 7.1.3. Synthesi
- 7.2. Market Analysis, Insights and Forecast - by Application
- 7.2.1. Commercial
- 7.2.2. Defense
- 7.1. Market Analysis, Insights and Forecast - by Technology
- 8. Europe Sustainable Aviation Fuel Market Analysis, Insights and Forecast, 2019-2031
- 8.1. Market Analysis, Insights and Forecast - by Technology
- 8.1.1. Fischer-Tropsch (FT)
- 8.1.2. Hydroprocessed Esters and Fatty Acids (HEFA)
- 8.1.3. Synthesi
- 8.2. Market Analysis, Insights and Forecast - by Application
- 8.2.1. Commercial
- 8.2.2. Defense
- 8.1. Market Analysis, Insights and Forecast - by Technology
- 9. South America Sustainable Aviation Fuel Market Analysis, Insights and Forecast, 2019-2031
- 9.1. Market Analysis, Insights and Forecast - by Technology
- 9.1.1. Fischer-Tropsch (FT)
- 9.1.2. Hydroprocessed Esters and Fatty Acids (HEFA)
- 9.1.3. Synthesi
- 9.2. Market Analysis, Insights and Forecast - by Application
- 9.2.1. Commercial
- 9.2.2. Defense
- 9.1. Market Analysis, Insights and Forecast - by Technology
- 10. Middle East and Africa Sustainable Aviation Fuel Market Analysis, Insights and Forecast, 2019-2031
- 10.1. Market Analysis, Insights and Forecast - by Technology
- 10.1.1. Fischer-Tropsch (FT)
- 10.1.2. Hydroprocessed Esters and Fatty Acids (HEFA)
- 10.1.3. Synthesi
- 10.2. Market Analysis, Insights and Forecast - by Application
- 10.2.1. Commercial
- 10.2.2. Defense
- 10.1. Market Analysis, Insights and Forecast - by Technology
- 11. North America Sustainable Aviation Fuel Market Analysis, Insights and Forecast, 2019-2031
- 11.1. Market Analysis, Insights and Forecast - By Country/Sub-region
- 11.1.1 United States
- 11.1.2 Canada
- 11.1.3 Mexico
- 12. Europe Sustainable Aviation Fuel Market Analysis, Insights and Forecast, 2019-2031
- 12.1. Market Analysis, Insights and Forecast - By Country/Sub-region
- 12.1.1 Germany
- 12.1.2 United Kingdom
- 12.1.3 France
- 12.1.4 Spain
- 12.1.5 Italy
- 12.1.6 Spain
- 12.1.7 Belgium
- 12.1.8 Netherland
- 12.1.9 Nordics
- 12.1.10 Rest of Europe
- 13. Asia Pacific Sustainable Aviation Fuel Market Analysis, Insights and Forecast, 2019-2031
- 13.1. Market Analysis, Insights and Forecast - By Country/Sub-region
- 13.1.1 China
- 13.1.2 Japan
- 13.1.3 India
- 13.1.4 South Korea
- 13.1.5 Southeast Asia
- 13.1.6 Australia
- 13.1.7 Indonesia
- 13.1.8 Phillipes
- 13.1.9 Singapore
- 13.1.10 Thailandc
- 13.1.11 Rest of Asia Pacific
- 14. South America Sustainable Aviation Fuel Market Analysis, Insights and Forecast, 2019-2031
- 14.1. Market Analysis, Insights and Forecast - By Country/Sub-region
- 14.1.1 Brazil
- 14.1.2 Argentina
- 14.1.3 Peru
- 14.1.4 Chile
- 14.1.5 Colombia
- 14.1.6 Ecuador
- 14.1.7 Venezuela
- 14.1.8 Rest of South America
- 15. North America Sustainable Aviation Fuel Market Analysis, Insights and Forecast, 2019-2031
- 15.1. Market Analysis, Insights and Forecast - By Country/Sub-region
- 15.1.1 United States
- 15.1.2 Canada
- 15.1.3 Mexico
- 16. MEA Sustainable Aviation Fuel Market Analysis, Insights and Forecast, 2019-2031
- 16.1. Market Analysis, Insights and Forecast - By Country/Sub-region
- 16.1.1 United Arab Emirates
- 16.1.2 Saudi Arabia
- 16.1.3 South Africa
- 16.1.4 Rest of Middle East and Africa
- 17. Competitive Analysis
- 17.1. Global Market Share Analysis 2024
- 17.2. Company Profiles
- 17.2.1 Honeywell International Inc
- 17.2.1.1. Overview
- 17.2.1.2. Products
- 17.2.1.3. SWOT Analysis
- 17.2.1.4. Recent Developments
- 17.2.1.5. Financials (Based on Availability)
- 17.2.2 LanzaTech Inc *List Not Exhaustive
- 17.2.2.1. Overview
- 17.2.2.2. Products
- 17.2.2.3. SWOT Analysis
- 17.2.2.4. Recent Developments
- 17.2.2.5. Financials (Based on Availability)
- 17.2.3 Fulcrum BioEnergy Inc
- 17.2.3.1. Overview
- 17.2.3.2. Products
- 17.2.3.3. SWOT Analysis
- 17.2.3.4. Recent Developments
- 17.2.3.5. Financials (Based on Availability)
- 17.2.4 Neste Oyj
- 17.2.4.1. Overview
- 17.2.4.2. Products
- 17.2.4.3. SWOT Analysis
- 17.2.4.4. Recent Developments
- 17.2.4.5. Financials (Based on Availability)
- 17.2.5 Red Rock Biofuels LLC
- 17.2.5.1. Overview
- 17.2.5.2. Products
- 17.2.5.3. SWOT Analysis
- 17.2.5.4. Recent Developments
- 17.2.5.5. Financials (Based on Availability)
- 17.2.6 Swedish Biofuels AB
- 17.2.6.1. Overview
- 17.2.6.2. Products
- 17.2.6.3. SWOT Analysis
- 17.2.6.4. Recent Developments
- 17.2.6.5. Financials (Based on Availability)
- 17.2.7 SG Preston Company
- 17.2.7.1. Overview
- 17.2.7.2. Products
- 17.2.7.3. SWOT Analysis
- 17.2.7.4. Recent Developments
- 17.2.7.5. Financials (Based on Availability)
- 17.2.8 TotalEnergies SE
- 17.2.8.1. Overview
- 17.2.8.2. Products
- 17.2.8.3. SWOT Analysis
- 17.2.8.4. Recent Developments
- 17.2.8.5. Financials (Based on Availability)
- 17.2.9 Gevo Inc
- 17.2.9.1. Overview
- 17.2.9.2. Products
- 17.2.9.3. SWOT Analysis
- 17.2.9.4. Recent Developments
- 17.2.9.5. Financials (Based on Availability)
- 17.2.1 Honeywell International Inc
List of Figures
- Figure 1: Global Sustainable Aviation Fuel Market Revenue Breakdown (Million, %) by Region 2024 & 2032
- Figure 2: North America Sustainable Aviation Fuel Market Revenue (Million), by Country 2024 & 2032
- Figure 3: North America Sustainable Aviation Fuel Market Revenue Share (%), by Country 2024 & 2032
- Figure 4: Europe Sustainable Aviation Fuel Market Revenue (Million), by Country 2024 & 2032
- Figure 5: Europe Sustainable Aviation Fuel Market Revenue Share (%), by Country 2024 & 2032
- Figure 6: Asia Pacific Sustainable Aviation Fuel Market Revenue (Million), by Country 2024 & 2032
- Figure 7: Asia Pacific Sustainable Aviation Fuel Market Revenue Share (%), by Country 2024 & 2032
- Figure 8: South America Sustainable Aviation Fuel Market Revenue (Million), by Country 2024 & 2032
- Figure 9: South America Sustainable Aviation Fuel Market Revenue Share (%), by Country 2024 & 2032
- Figure 10: North America Sustainable Aviation Fuel Market Revenue (Million), by Country 2024 & 2032
- Figure 11: North America Sustainable Aviation Fuel Market Revenue Share (%), by Country 2024 & 2032
- Figure 12: MEA Sustainable Aviation Fuel Market Revenue (Million), by Country 2024 & 2032
- Figure 13: MEA Sustainable Aviation Fuel Market Revenue Share (%), by Country 2024 & 2032
- Figure 14: North America Sustainable Aviation Fuel Market Revenue (Million), by Technology 2024 & 2032
- Figure 15: North America Sustainable Aviation Fuel Market Revenue Share (%), by Technology 2024 & 2032
- Figure 16: North America Sustainable Aviation Fuel Market Revenue (Million), by Application 2024 & 2032
- Figure 17: North America Sustainable Aviation Fuel Market Revenue Share (%), by Application 2024 & 2032
- Figure 18: North America Sustainable Aviation Fuel Market Revenue (Million), by Country 2024 & 2032
- Figure 19: North America Sustainable Aviation Fuel Market Revenue Share (%), by Country 2024 & 2032
- Figure 20: Asia Pacific Sustainable Aviation Fuel Market Revenue (Million), by Technology 2024 & 2032
- Figure 21: Asia Pacific Sustainable Aviation Fuel Market Revenue Share (%), by Technology 2024 & 2032
- Figure 22: Asia Pacific Sustainable Aviation Fuel Market Revenue (Million), by Application 2024 & 2032
- Figure 23: Asia Pacific Sustainable Aviation Fuel Market Revenue Share (%), by Application 2024 & 2032
- Figure 24: Asia Pacific Sustainable Aviation Fuel Market Revenue (Million), by Country 2024 & 2032
- Figure 25: Asia Pacific Sustainable Aviation Fuel Market Revenue Share (%), by Country 2024 & 2032
- Figure 26: Europe Sustainable Aviation Fuel Market Revenue (Million), by Technology 2024 & 2032
- Figure 27: Europe Sustainable Aviation Fuel Market Revenue Share (%), by Technology 2024 & 2032
- Figure 28: Europe Sustainable Aviation Fuel Market Revenue (Million), by Application 2024 & 2032
- Figure 29: Europe Sustainable Aviation Fuel Market Revenue Share (%), by Application 2024 & 2032
- Figure 30: Europe Sustainable Aviation Fuel Market Revenue (Million), by Country 2024 & 2032
- Figure 31: Europe Sustainable Aviation Fuel Market Revenue Share (%), by Country 2024 & 2032
- Figure 32: South America Sustainable Aviation Fuel Market Revenue (Million), by Technology 2024 & 2032
- Figure 33: South America Sustainable Aviation Fuel Market Revenue Share (%), by Technology 2024 & 2032
- Figure 34: South America Sustainable Aviation Fuel Market Revenue (Million), by Application 2024 & 2032
- Figure 35: South America Sustainable Aviation Fuel Market Revenue Share (%), by Application 2024 & 2032
- Figure 36: South America Sustainable Aviation Fuel Market Revenue (Million), by Country 2024 & 2032
- Figure 37: South America Sustainable Aviation Fuel Market Revenue Share (%), by Country 2024 & 2032
- Figure 38: Middle East and Africa Sustainable Aviation Fuel Market Revenue (Million), by Technology 2024 & 2032
- Figure 39: Middle East and Africa Sustainable Aviation Fuel Market Revenue Share (%), by Technology 2024 & 2032
- Figure 40: Middle East and Africa Sustainable Aviation Fuel Market Revenue (Million), by Application 2024 & 2032
- Figure 41: Middle East and Africa Sustainable Aviation Fuel Market Revenue Share (%), by Application 2024 & 2032
- Figure 42: Middle East and Africa Sustainable Aviation Fuel Market Revenue (Million), by Country 2024 & 2032
- Figure 43: Middle East and Africa Sustainable Aviation Fuel Market Revenue Share (%), by Country 2024 & 2032
List of Tables
- Table 1: Global Sustainable Aviation Fuel Market Revenue Million Forecast, by Region 2019 & 2032
- Table 2: Global Sustainable Aviation Fuel Market Revenue Million Forecast, by Technology 2019 & 2032
- Table 3: Global Sustainable Aviation Fuel Market Revenue Million Forecast, by Application 2019 & 2032
- Table 4: Global Sustainable Aviation Fuel Market Revenue Million Forecast, by Region 2019 & 2032
- Table 5: Global Sustainable Aviation Fuel Market Revenue Million Forecast, by Country 2019 & 2032
- Table 6: United States Sustainable Aviation Fuel Market Revenue (Million) Forecast, by Application 2019 & 2032
- Table 7: Canada Sustainable Aviation Fuel Market Revenue (Million) Forecast, by Application 2019 & 2032
- Table 8: Mexico Sustainable Aviation Fuel Market Revenue (Million) Forecast, by Application 2019 & 2032
- Table 9: Global Sustainable Aviation Fuel Market Revenue Million Forecast, by Country 2019 & 2032
- Table 10: Germany Sustainable Aviation Fuel Market Revenue (Million) Forecast, by Application 2019 & 2032
- Table 11: United Kingdom Sustainable Aviation Fuel Market Revenue (Million) Forecast, by Application 2019 & 2032
- Table 12: France Sustainable Aviation Fuel Market Revenue (Million) Forecast, by Application 2019 & 2032
- Table 13: Spain Sustainable Aviation Fuel Market Revenue (Million) Forecast, by Application 2019 & 2032
- Table 14: Italy Sustainable Aviation Fuel Market Revenue (Million) Forecast, by Application 2019 & 2032
- Table 15: Spain Sustainable Aviation Fuel Market Revenue (Million) Forecast, by Application 2019 & 2032
- Table 16: Belgium Sustainable Aviation Fuel Market Revenue (Million) Forecast, by Application 2019 & 2032
- Table 17: Netherland Sustainable Aviation Fuel Market Revenue (Million) Forecast, by Application 2019 & 2032
- Table 18: Nordics Sustainable Aviation Fuel Market Revenue (Million) Forecast, by Application 2019 & 2032
- Table 19: Rest of Europe Sustainable Aviation Fuel Market Revenue (Million) Forecast, by Application 2019 & 2032
- Table 20: Global Sustainable Aviation Fuel Market Revenue Million Forecast, by Country 2019 & 2032
- Table 21: China Sustainable Aviation Fuel Market Revenue (Million) Forecast, by Application 2019 & 2032
- Table 22: Japan Sustainable Aviation Fuel Market Revenue (Million) Forecast, by Application 2019 & 2032
- Table 23: India Sustainable Aviation Fuel Market Revenue (Million) Forecast, by Application 2019 & 2032
- Table 24: South Korea Sustainable Aviation Fuel Market Revenue (Million) Forecast, by Application 2019 & 2032
- Table 25: Southeast Asia Sustainable Aviation Fuel Market Revenue (Million) Forecast, by Application 2019 & 2032
- Table 26: Australia Sustainable Aviation Fuel Market Revenue (Million) Forecast, by Application 2019 & 2032
- Table 27: Indonesia Sustainable Aviation Fuel Market Revenue (Million) Forecast, by Application 2019 & 2032
- Table 28: Phillipes Sustainable Aviation Fuel Market Revenue (Million) Forecast, by Application 2019 & 2032
- Table 29: Singapore Sustainable Aviation Fuel Market Revenue (Million) Forecast, by Application 2019 & 2032
- Table 30: Thailandc Sustainable Aviation Fuel Market Revenue (Million) Forecast, by Application 2019 & 2032
- Table 31: Rest of Asia Pacific Sustainable Aviation Fuel Market Revenue (Million) Forecast, by Application 2019 & 2032
- Table 32: Global Sustainable Aviation Fuel Market Revenue Million Forecast, by Country 2019 & 2032
- Table 33: Brazil Sustainable Aviation Fuel Market Revenue (Million) Forecast, by Application 2019 & 2032
- Table 34: Argentina Sustainable Aviation Fuel Market Revenue (Million) Forecast, by Application 2019 & 2032
- Table 35: Peru Sustainable Aviation Fuel Market Revenue (Million) Forecast, by Application 2019 & 2032
- Table 36: Chile Sustainable Aviation Fuel Market Revenue (Million) Forecast, by Application 2019 & 2032
- Table 37: Colombia Sustainable Aviation Fuel Market Revenue (Million) Forecast, by Application 2019 & 2032
- Table 38: Ecuador Sustainable Aviation Fuel Market Revenue (Million) Forecast, by Application 2019 & 2032
- Table 39: Venezuela Sustainable Aviation Fuel Market Revenue (Million) Forecast, by Application 2019 & 2032
- Table 40: Rest of South America Sustainable Aviation Fuel Market Revenue (Million) Forecast, by Application 2019 & 2032
- Table 41: Global Sustainable Aviation Fuel Market Revenue Million Forecast, by Country 2019 & 2032
- Table 42: United States Sustainable Aviation Fuel Market Revenue (Million) Forecast, by Application 2019 & 2032
- Table 43: Canada Sustainable Aviation Fuel Market Revenue (Million) Forecast, by Application 2019 & 2032
- Table 44: Mexico Sustainable Aviation Fuel Market Revenue (Million) Forecast, by Application 2019 & 2032
- Table 45: Global Sustainable Aviation Fuel Market Revenue Million Forecast, by Country 2019 & 2032
- Table 46: United Arab Emirates Sustainable Aviation Fuel Market Revenue (Million) Forecast, by Application 2019 & 2032
- Table 47: Saudi Arabia Sustainable Aviation Fuel Market Revenue (Million) Forecast, by Application 2019 & 2032
- Table 48: South Africa Sustainable Aviation Fuel Market Revenue (Million) Forecast, by Application 2019 & 2032
- Table 49: Rest of Middle East and Africa Sustainable Aviation Fuel Market Revenue (Million) Forecast, by Application 2019 & 2032
- Table 50: Global Sustainable Aviation Fuel Market Revenue Million Forecast, by Technology 2019 & 2032
- Table 51: Global Sustainable Aviation Fuel Market Revenue Million Forecast, by Application 2019 & 2032
- Table 52: Global Sustainable Aviation Fuel Market Revenue Million Forecast, by Country 2019 & 2032
- Table 53: United States of America Sustainable Aviation Fuel Market Revenue (Million) Forecast, by Application 2019 & 2032
- Table 54: Canada Sustainable Aviation Fuel Market Revenue (Million) Forecast, by Application 2019 & 2032
- Table 55: Rest of the North America Sustainable Aviation Fuel Market Revenue (Million) Forecast, by Application 2019 & 2032
- Table 56: Global Sustainable Aviation Fuel Market Revenue Million Forecast, by Technology 2019 & 2032
- Table 57: Global Sustainable Aviation Fuel Market Revenue Million Forecast, by Application 2019 & 2032
- Table 58: Global Sustainable Aviation Fuel Market Revenue Million Forecast, by Country 2019 & 2032
- Table 59: China Sustainable Aviation Fuel Market Revenue (Million) Forecast, by Application 2019 & 2032
- Table 60: India Sustainable Aviation Fuel Market Revenue (Million) Forecast, by Application 2019 & 2032
- Table 61: Japan Sustainable Aviation Fuel Market Revenue (Million) Forecast, by Application 2019 & 2032
- Table 62: Rest of the Asia Pacific Sustainable Aviation Fuel Market Revenue (Million) Forecast, by Application 2019 & 2032
- Table 63: Global Sustainable Aviation Fuel Market Revenue Million Forecast, by Technology 2019 & 2032
- Table 64: Global Sustainable Aviation Fuel Market Revenue Million Forecast, by Application 2019 & 2032
- Table 65: Global Sustainable Aviation Fuel Market Revenue Million Forecast, by Country 2019 & 2032
- Table 66: United Kingdom Sustainable Aviation Fuel Market Revenue (Million) Forecast, by Application 2019 & 2032
- Table 67: France Sustainable Aviation Fuel Market Revenue (Million) Forecast, by Application 2019 & 2032
- Table 68: Germany Sustainable Aviation Fuel Market Revenue (Million) Forecast, by Application 2019 & 2032
- Table 69: Rest of the Europe Sustainable Aviation Fuel Market Revenue (Million) Forecast, by Application 2019 & 2032
- Table 70: Global Sustainable Aviation Fuel Market Revenue Million Forecast, by Technology 2019 & 2032
- Table 71: Global Sustainable Aviation Fuel Market Revenue Million Forecast, by Application 2019 & 2032
- Table 72: Global Sustainable Aviation Fuel Market Revenue Million Forecast, by Country 2019 & 2032
- Table 73: Brazil Sustainable Aviation Fuel Market Revenue (Million) Forecast, by Application 2019 & 2032
- Table 74: Argentina Sustainable Aviation Fuel Market Revenue (Million) Forecast, by Application 2019 & 2032
- Table 75: Rest of the South America Sustainable Aviation Fuel Market Revenue (Million) Forecast, by Application 2019 & 2032
- Table 76: Global Sustainable Aviation Fuel Market Revenue Million Forecast, by Technology 2019 & 2032
- Table 77: Global Sustainable Aviation Fuel Market Revenue Million Forecast, by Application 2019 & 2032
- Table 78: Global Sustainable Aviation Fuel Market Revenue Million Forecast, by Country 2019 & 2032
- Table 79: United Arab Emirates Sustainable Aviation Fuel Market Revenue (Million) Forecast, by Application 2019 & 2032
- Table 80: Saudi Arabia Sustainable Aviation Fuel Market Revenue (Million) Forecast, by Application 2019 & 2032
- Table 81: Qatar Sustainable Aviation Fuel Market Revenue (Million) Forecast, by Application 2019 & 2032
- Table 82: Rest of the Middle East and Africa Sustainable Aviation Fuel Market Revenue (Million) Forecast, by Application 2019 & 2032
Frequently Asked Questions
1. What is the projected Compound Annual Growth Rate (CAGR) of the Sustainable Aviation Fuel Market?
The projected CAGR is approximately 47.16%.
2. Which companies are prominent players in the Sustainable Aviation Fuel Market?
Key companies in the market include Honeywell International Inc, LanzaTech Inc *List Not Exhaustive, Fulcrum BioEnergy Inc, Neste Oyj, Red Rock Biofuels LLC, Swedish Biofuels AB, SG Preston Company, TotalEnergies SE, Gevo Inc.
3. What are the main segments of the Sustainable Aviation Fuel Market?
The market segments include Technology, Application.
4. Can you provide details about the market size?
The market size is estimated to be USD 6.58 Million as of 2022.
5. What are some drivers contributing to market growth?
4.; Increased Government Regulations for Greenhouse Gas Emissions 4.; Encouraging Production and Consumption of Renewable Aviation Fuel.
6. What are the notable trends driving market growth?
Hydroprocessed Esters and Fatty Acids (HEFA) Technology to Dominate the Market.
7. Are there any restraints impacting market growth?
4.; The High Costs of Renewable Aviation Fuel.
8. Can you provide examples of recent developments in the market?
In May 2023, Twelve and Etihad Airways, the national carrier of the United Arab Emirates, signed a Memorandum of Understanding (MOU) to collaborate on the advancement of E-Jet® fuel, Twelve's sustainable aviation fuel (SAF) made from CO2 and renewable energy, as well as plans for an international demonstration flight and a supply roadmap that will support Etihad's sustainability strategy.
9. What pricing options are available for accessing the report?
Pricing options include single-user, multi-user, and enterprise licenses priced at USD 4750, USD 5250, and USD 8750 respectively.
10. Is the market size provided in terms of value or volume?
The market size is provided in terms of value, measured in Million.
11. Are there any specific market keywords associated with the report?
Yes, the market keyword associated with the report is "Sustainable Aviation Fuel Market," which aids in identifying and referencing the specific market segment covered.
12. How do I determine which pricing option suits my needs best?
The pricing options vary based on user requirements and access needs. Individual users may opt for single-user licenses, while businesses requiring broader access may choose multi-user or enterprise licenses for cost-effective access to the report.
13. Are there any additional resources or data provided in the Sustainable Aviation Fuel Market report?
While the report offers comprehensive insights, it's advisable to review the specific contents or supplementary materials provided to ascertain if additional resources or data are available.
14. How can I stay updated on further developments or reports in the Sustainable Aviation Fuel Market?
To stay informed about further developments, trends, and reports in the Sustainable Aviation Fuel Market, consider subscribing to industry newsletters, following relevant companies and organizations, or regularly checking reputable industry news sources and publications.
Methodology
Step 1 - Identification of Relevant Samples Size from Population Database


Step 2 - Approaches for Defining Global Market Size (Value, Volume* & Price*)

Note*: In applicable scenarios
Step 3 - Data Sources
Primary Research
- Web Analytics
- Survey Reports
- Research Institute
- Latest Research Reports
- Opinion Leaders
Secondary Research
- Annual Reports
- White Paper
- Latest Press Release
- Industry Association
- Paid Database
- Investor Presentations

Step 4 - Data Triangulation
Involves using different sources of information in order to increase the validity of a study
These sources are likely to be stakeholders in a program - participants, other researchers, program staff, other community members, and so on.
Then we put all data in single framework & apply various statistical tools to find out the dynamic on the market.
During the analysis stage, feedback from the stakeholder groups would be compared to determine areas of agreement as well as areas of divergence


