

Key Insights
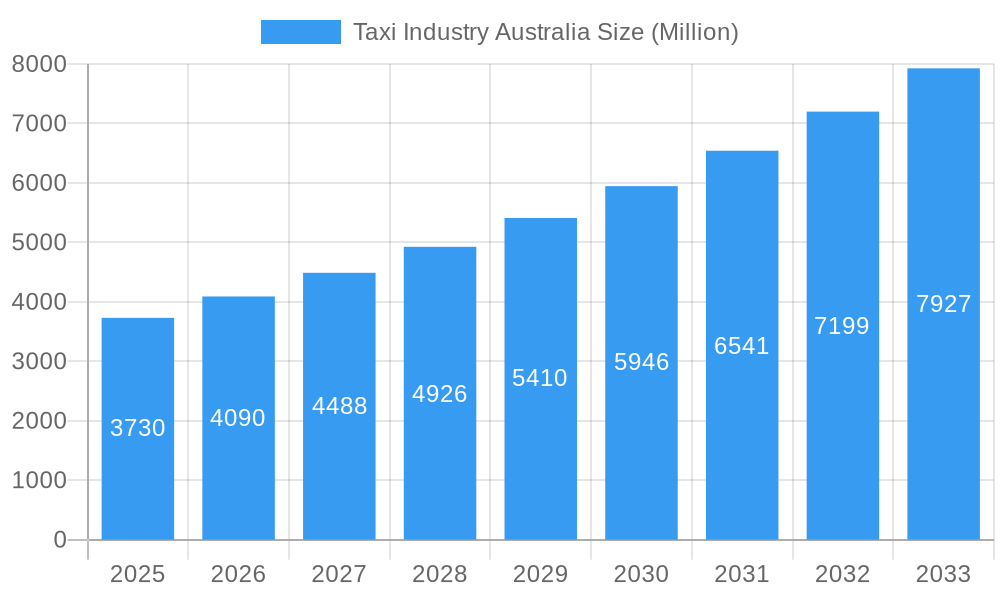
The Australian taxi industry, valued at $3.73 billion in 2025, is experiencing robust growth, projected to expand at a compound annual growth rate (CAGR) of 9.60% from 2025 to 2033. This growth is fueled by several key factors. Increasing urbanization and population density in major cities like Sydney, Melbourne, and Brisbane are driving demand for convenient and reliable transportation options. The rising adoption of ride-hailing apps, offering features like online booking, real-time tracking, and cashless payments, is significantly disrupting the traditional taxi market and contributing to the overall market expansion. Furthermore, the diversification of vehicle types offered, including hatchbacks, sedans, and SUVs/MPVs, caters to a wider range of customer preferences and needs, further boosting market size. However, challenges remain. Stringent regulations governing licensing and operations, coupled with increasing fuel prices and driver shortages, pose potential restraints on the industry's growth trajectory. Competition from emerging players and established ride-hailing giants like Uber and Ola intensifies the pressure on profitability and market share. The market segmentation reveals a dynamic landscape with online booking rapidly gaining traction compared to offline methods. New South Wales (NSW), Victoria, and Queensland represent the largest regional markets, reflecting higher population density and greater adoption of ride-hailing services.
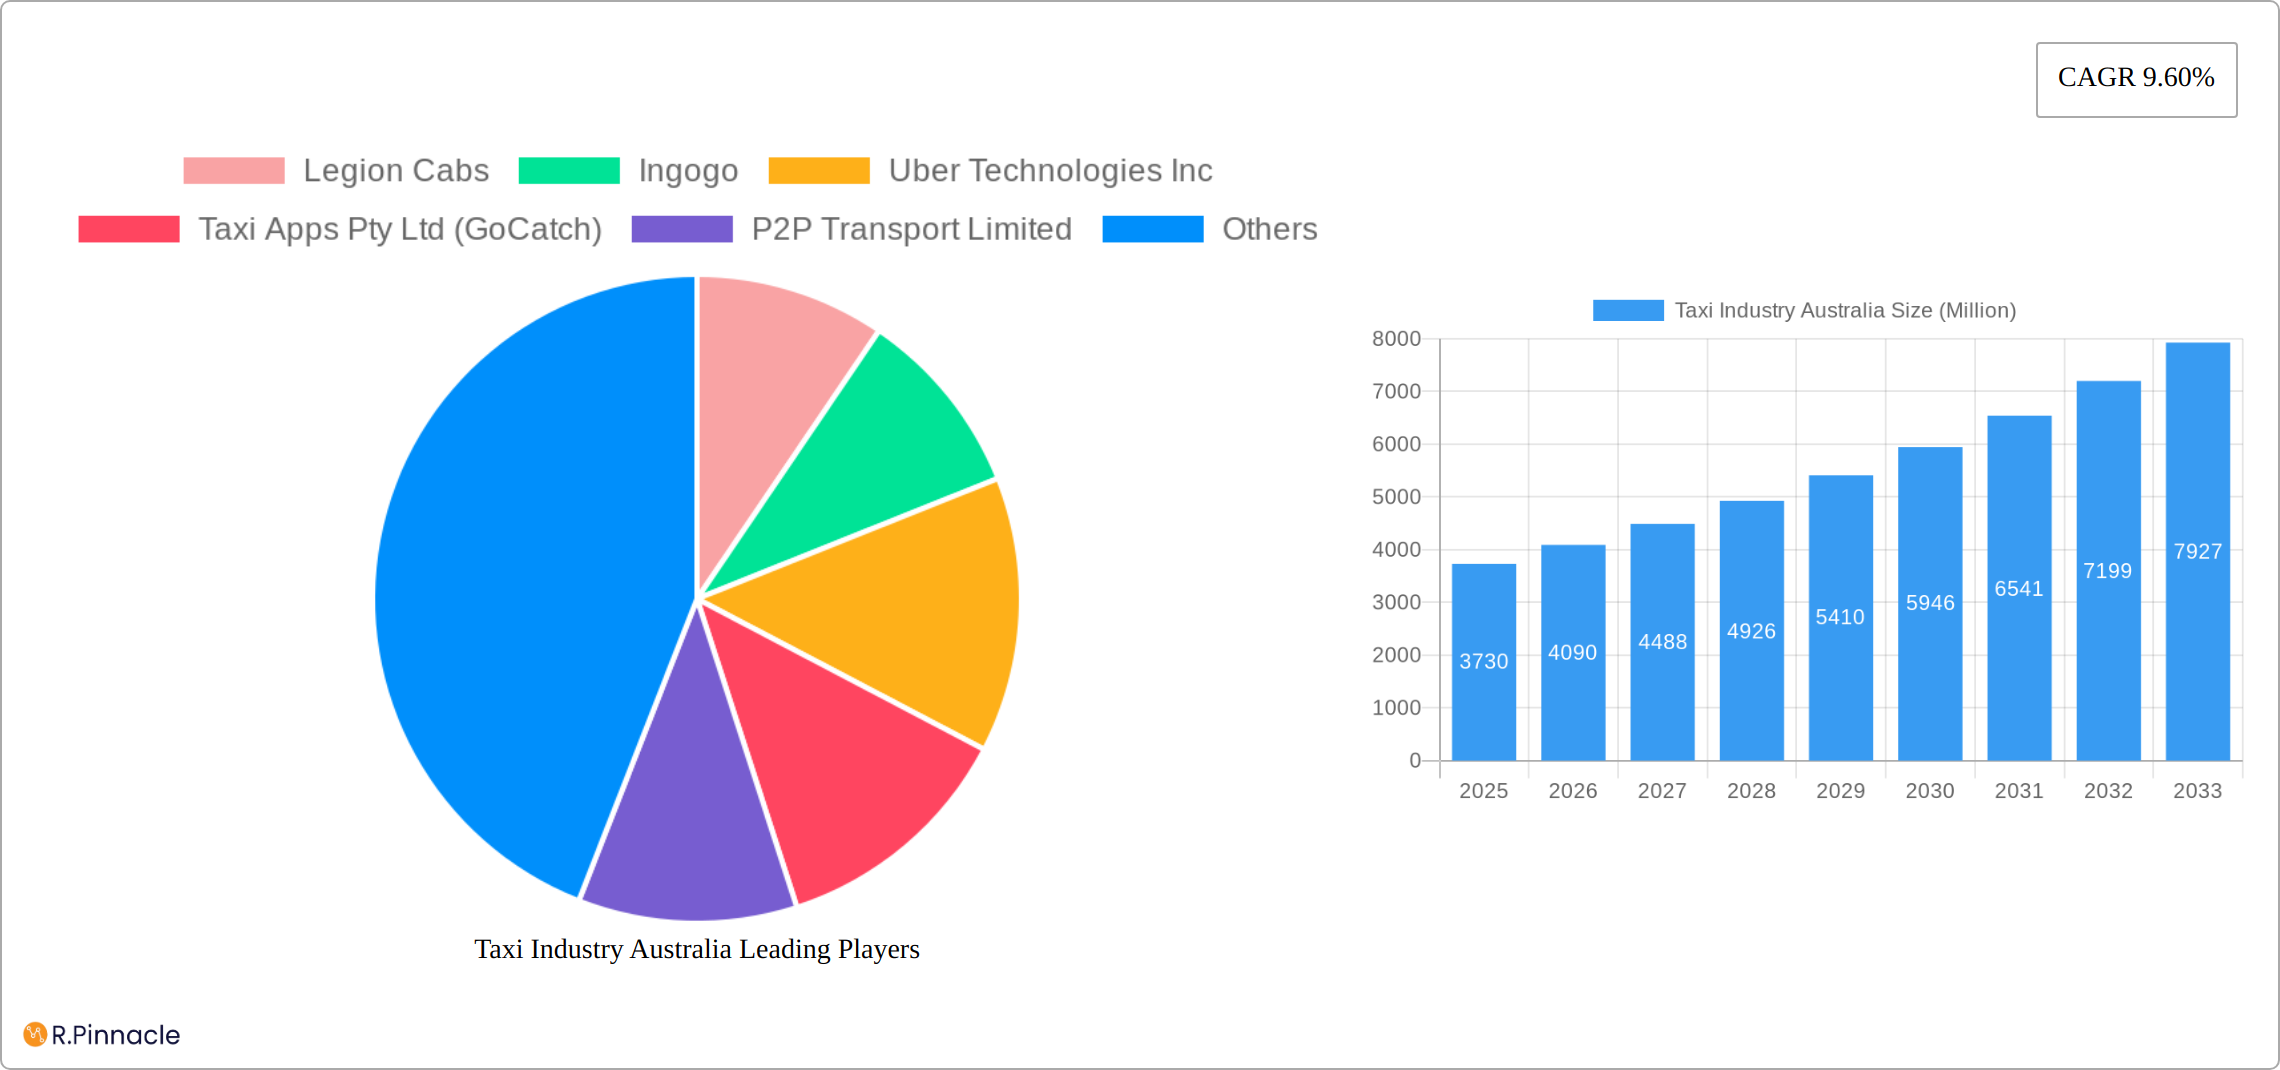
Taxi Industry Australia Market Size (In Billion)
The future of the Australian taxi industry hinges on the ability of players to adapt to the evolving technological landscape and consumer preferences. Companies like Legion Cabs, Ingogo, and GoCatch are actively investing in technological upgrades, improving their apps, and exploring innovative service offerings. Strategic partnerships, mergers, and acquisitions are also expected to shape the industry's competitive dynamics. The industry's success will be defined by its ability to strike a balance between regulatory compliance, technological innovation, and providing a safe, reliable, and cost-effective transportation solution. The ongoing evolution of consumer expectations and the increasing integration of technology will continue to redefine the industry's structure and competitive landscape in the coming years.
Taxi Industry Australia Company Market Share
Taxi Industry Australia Market Report: 2019-2033
This comprehensive report provides an in-depth analysis of the Australian taxi industry, offering invaluable insights for industry professionals, investors, and strategic planners. With a focus on market structure, dynamics, and future trends, this report covers the period from 2019 to 2033, with a base year of 2025 and a forecast period of 2025-2033. The report analyzes key players like Uber Technologies Inc, Taxi Apps Pty Ltd (GoCatch), GM Cabs, and others, examining their market share and contributions to the $XX Million market.
Taxi Industry Australia Market Structure & Innovation Trends
This section provides a comprehensive analysis of the dynamic Australian taxi industry, encompassing its competitive landscape, innovation drivers, regulatory frameworks, and merger and acquisition (M&A) activities. We examine the significant impact of ride-hailing services like Uber and Ola on traditional taxi operators and delve into key market trends shaping the future of the sector.
- Market Concentration and Competitive Dynamics: This in-depth analysis assesses the market share of key players, including Uber Technologies Inc, Taxi Apps Pty Ltd (GoCatch), GM Cabs, and other significant competitors. We provide precise market share estimations for 2025, detailing the dominance of established players and highlighting the emergence of new contenders. For example, we project Uber's market share at approximately XX% in 2025, while GM Cabs holds approximately XX%, with Ingogo, Bolt, and Ola combined holding an estimated XX%. This analysis also considers the evolving competitive strategies employed by these firms and their impact on market dynamics.
- Innovation Drivers and Technological Advancements: We identify key technological advancements and regulatory changes driving innovation within the industry. This includes detailed examination of the integration of new payment technologies (such as the Ingenico and Live Payments partnership), the increasing adoption of electric vehicles in ride-sharing (as exemplified by Uber’s Custom Electric initiative), and the development and implementation of innovative mobile applications improving user experience and operational efficiency.
- Regulatory Landscape and its Influence: A thorough analysis of state-specific regulations across NSW, Victoria, Queensland, and Western Australia is provided. We assess the impact of these regulations on market access, competition, and the overall operational landscape of the taxi industry, exploring areas of both support and restriction for growth and innovation.
- Impact of Substitute Transportation Options: We examine the influence of alternative transportation options—including public transport and private car ownership—on taxi demand. This analysis considers factors such as cost, convenience, and accessibility to provide a holistic view of the competitive environment.
- Understanding End-User Behavior: A detailed segmentation of users based on age, income, location, and usage patterns helps to illuminate consumer preferences and demand drivers. This insight is crucial for understanding market trends and developing effective business strategies.
- M&A Activity and Market Consolidation: We review significant mergers and acquisitions within the industry since 2019, assessing their impact on market consolidation and competitive dynamics. The total estimated M&A deal value from 2019-2024 is quantified at $XX Million, allowing for an evaluation of the financial implications of these transactions and their overall impact on industry structure.
Taxi Industry Australia Market Dynamics & Trends
This section delves into the key dynamics and trends shaping the Australian taxi industry's growth trajectory, covering a period of significant technological disruption and evolving consumer preferences. We project a Compound Annual Growth Rate (CAGR) of XX% for the taxi market from 2025 to 2033. Key factors analyzed include:
- Market Growth Drivers: Exploration of factors driving market expansion, such as increasing urbanization, rising disposable incomes, and the growing preference for convenient transportation options.
- Technological Disruptions: Analysis of the impact of ride-hailing apps, GPS technology, and electric vehicle integration on the industry's structure and operations.
- Consumer Preferences: Examination of shifting consumer needs, including demand for diverse service types (ride-hailing, ridesharing), booking methods (online, offline), and vehicle types (hatchbacks, sedans, SUVs).
- Competitive Dynamics: Assessment of the competitive intensity, strategies employed by key players, and the impact of new entrants. Market penetration of online booking is projected to reach XX% by 2033.
Dominant Regions & Segments in Taxi Industry Australia
This section identifies the leading regions and segments within the Australian taxi industry based on service type, booking method, vehicle type, and geographical location.
- By Service Type: Analysis of market share and growth projections for Ride Hailing and Ridesharing, highlighting the dominance of one segment over the other.
- By Booking Type: Comparison of Online Booking and Offline Booking, examining their respective market shares and growth trajectories.
- By Vehicle Type: Assessment of the demand and market size for Hatchbacks, Sedans, and SUVs/MPVs, identifying the preferred vehicle types among consumers.
- By Region: In-depth analysis of the market size and growth potential in NSW, Victoria, Queensland, Western Australia, and the Rest of Australia. NSW is projected to remain the dominant region, accounting for approximately XX% of the total market in 2033.
- Key Drivers (NSW): Strong economic activity, well-developed infrastructure, high population density.
- Key Drivers (Victoria): Similar economic factors as NSW, coupled with a robust tourism sector.
- Key Drivers (Queensland): Growing tourism industry and population growth.
- Key Drivers (Western Australia): Resource sector-driven economic activity.
Taxi Industry Australia Product Innovations
This section summarizes recent product developments and technological advancements within the Australian taxi industry. The emergence of hybrid taxi services, such as GM Cab's Taxi-Share 2023, demonstrates an attempt to combine the benefits of traditional taxi services with ride-sharing models to cater to diverse customer needs and preferences. Technological integration, such as the adoption of electric vehicles and improved payment solutions, are key factors driving innovation and enhancing the customer experience.
Report Scope & Segmentation Analysis
This report segments the Australian taxi market by service type (Ride Hailing, Ridesharing), booking type (Online, Offline), vehicle type (Hatchbacks, Sedans, SUVs/MPVs), and geographic location (NSW, Victoria, Queensland, Western Australia, Rest of Australia). Each segment's growth projection, market size, and competitive dynamics are analyzed. For example, the Online Booking segment is expected to experience significant growth due to increasing smartphone penetration and the convenience of app-based booking.
Key Drivers of Taxi Industry Australia Growth
The growth of the Australian taxi industry is propelled by several key factors: increasing urbanization leading to higher demand for transportation; rising disposable incomes enabling greater spending on transportation services; technological advancements improving efficiency and customer experience; and supportive government policies promoting transportation infrastructure development.
Challenges in the Taxi Industry Australia Sector
The Australian taxi industry faces challenges such as intense competition from ride-hailing services; stringent regulatory requirements; fluctuating fuel prices affecting operational costs; and the need for continuous technological upgrades to stay competitive. These factors combined can reduce profitability by an estimated XX% for traditional taxi operators by 2033.
Emerging Opportunities in Taxi Industry Australia
Emerging opportunities include the expansion of electric vehicle fleets to reduce environmental impact and operational costs; the development of innovative pricing models and loyalty programs to enhance customer engagement; and the integration of advanced technologies such as AI and machine learning to optimize operations and improve customer service.
Leading Players in the Taxi Industry Australia Market
- Legion Cabs
- Ingogo
- Uber Technologies Inc
- Taxi Apps Pty Ltd (GoCatch)
- P2P Transport Limited
- GM Cabs
- Rydo Taxi
- Bolt Technology OÜ
- A2B Australia Limited
- ANI Technologies Pvt Ltd (Ola)
- (Didi Chuxing) Beijing Xiaoju Technology Co Ltd
Key Developments in Taxi Industry Australia Industry
- October 2022: Ingenico and Live Payments partnered to improve payment solutions for taxis.
- October 2022: Uber added 500 Polestar 2 electric vehicles to its Sydney rideshare fleet, launching its "Custom Electric" service in 2023.
- April 2023: GM Cabs launched Taxi-Share 2023, a hybrid taxi and ride-sharing service.
Future Outlook for Taxi Industry Australia Market
The Australian taxi industry is poised for continued growth, driven by technological innovation, evolving consumer preferences, and government initiatives. The integration of electric vehicles, the development of sophisticated ride-sharing models, and the ongoing optimization of booking and payment systems will shape the future of the industry. The market is expected to reach $XX Million by 2033, representing significant growth potential for businesses that can adapt to the changing landscape.
Taxi Industry Australia Segmentation
-
1. Service Type
- 1.1. Ride Hailing
- 1.2. Ridesharing
-
2. Booking Type
- 2.1. Online Booking
- 2.2. Offline Booking
-
3. Vehicle Type
- 3.1. Hatchbacks
- 3.2. Sedans
- 3.3. SUVs/MPVs
Taxi Industry Australia Segmentation By Geography
-
1. North America
- 1.1. United States
- 1.2. Canada
- 1.3. Mexico
-
2. South America
- 2.1. Brazil
- 2.2. Argentina
- 2.3. Rest of South America
-
3. Europe
- 3.1. United Kingdom
- 3.2. Germany
- 3.3. France
- 3.4. Italy
- 3.5. Spain
- 3.6. Russia
- 3.7. Benelux
- 3.8. Nordics
- 3.9. Rest of Europe
-
4. Middle East & Africa
- 4.1. Turkey
- 4.2. Israel
- 4.3. GCC
- 4.4. North Africa
- 4.5. South Africa
- 4.6. Rest of Middle East & Africa
-
5. Asia Pacific
- 5.1. China
- 5.2. India
- 5.3. Japan
- 5.4. South Korea
- 5.5. ASEAN
- 5.6. Oceania
- 5.7. Rest of Asia Pacific
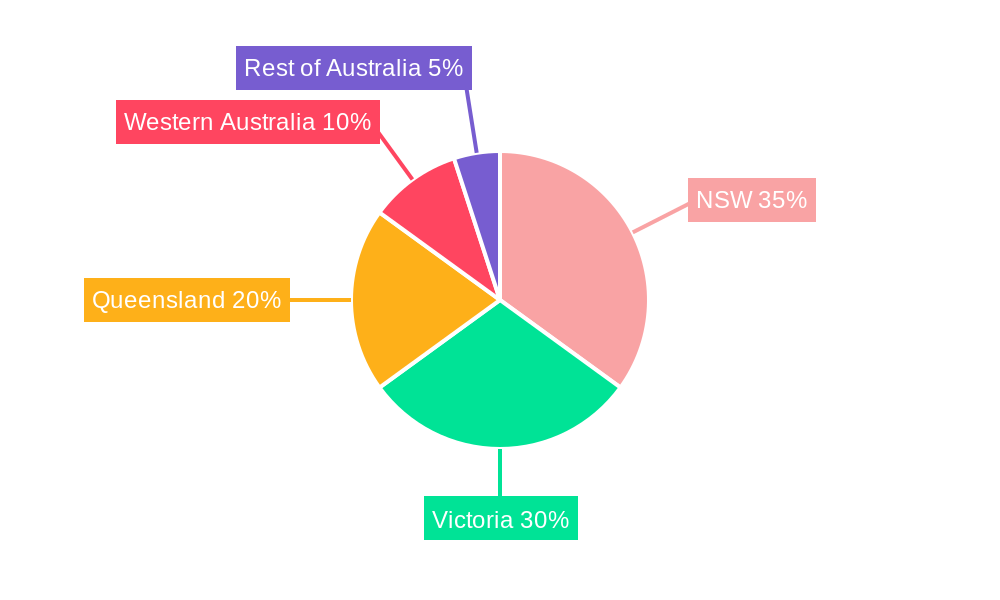
Taxi Industry Australia Regional Market Share
Geographic Coverage of Taxi Industry Australia
Taxi Industry Australia REPORT HIGHLIGHTS
| Aspects | Details |
|---|---|
| Study Period | 2020-2034 |
| Base Year | 2025 |
| Estimated Year | 2026 |
| Forecast Period | 2026-2034 |
| Historical Period | 2020-2025 |
| Growth Rate | CAGR of 9.60% from 2020-2034 |
| Segmentation |
|
Table of Contents
- 1. Introduction
- 1.1. Research Scope
- 1.2. Market Segmentation
- 1.3. Research Methodology
- 1.4. Definitions and Assumptions
- 2. Executive Summary
- 2.1. Introduction
- 3. Market Dynamics
- 3.1. Introduction
- 3.2. Market Drivers
- 3.2.1. Growing Tourism Industry in Australia
- 3.3. Market Restrains
- 3.3.1. Varying Government Regulations on Taxi Services
- 3.4. Market Trends
- 3.4.1. Online Booking Holds the Highest Share
- 4. Market Factor Analysis
- 4.1. Porters Five Forces
- 4.2. Supply/Value Chain
- 4.3. PESTEL analysis
- 4.4. Market Entropy
- 4.5. Patent/Trademark Analysis
- 5. Global Taxi Industry Australia Analysis, Insights and Forecast, 2020-2032
- 5.1. Market Analysis, Insights and Forecast - by Service Type
- 5.1.1. Ride Hailing
- 5.1.2. Ridesharing
- 5.2. Market Analysis, Insights and Forecast - by Booking Type
- 5.2.1. Online Booking
- 5.2.2. Offline Booking
- 5.3. Market Analysis, Insights and Forecast - by Vehicle Type
- 5.3.1. Hatchbacks
- 5.3.2. Sedans
- 5.3.3. SUVs/MPVs
- 5.4. Market Analysis, Insights and Forecast - by Region
- 5.4.1. North America
- 5.4.2. South America
- 5.4.3. Europe
- 5.4.4. Middle East & Africa
- 5.4.5. Asia Pacific
- 5.1. Market Analysis, Insights and Forecast - by Service Type
- 6. North America Taxi Industry Australia Analysis, Insights and Forecast, 2020-2032
- 6.1. Market Analysis, Insights and Forecast - by Service Type
- 6.1.1. Ride Hailing
- 6.1.2. Ridesharing
- 6.2. Market Analysis, Insights and Forecast - by Booking Type
- 6.2.1. Online Booking
- 6.2.2. Offline Booking
- 6.3. Market Analysis, Insights and Forecast - by Vehicle Type
- 6.3.1. Hatchbacks
- 6.3.2. Sedans
- 6.3.3. SUVs/MPVs
- 6.1. Market Analysis, Insights and Forecast - by Service Type
- 7. South America Taxi Industry Australia Analysis, Insights and Forecast, 2020-2032
- 7.1. Market Analysis, Insights and Forecast - by Service Type
- 7.1.1. Ride Hailing
- 7.1.2. Ridesharing
- 7.2. Market Analysis, Insights and Forecast - by Booking Type
- 7.2.1. Online Booking
- 7.2.2. Offline Booking
- 7.3. Market Analysis, Insights and Forecast - by Vehicle Type
- 7.3.1. Hatchbacks
- 7.3.2. Sedans
- 7.3.3. SUVs/MPVs
- 7.1. Market Analysis, Insights and Forecast - by Service Type
- 8. Europe Taxi Industry Australia Analysis, Insights and Forecast, 2020-2032
- 8.1. Market Analysis, Insights and Forecast - by Service Type
- 8.1.1. Ride Hailing
- 8.1.2. Ridesharing
- 8.2. Market Analysis, Insights and Forecast - by Booking Type
- 8.2.1. Online Booking
- 8.2.2. Offline Booking
- 8.3. Market Analysis, Insights and Forecast - by Vehicle Type
- 8.3.1. Hatchbacks
- 8.3.2. Sedans
- 8.3.3. SUVs/MPVs
- 8.1. Market Analysis, Insights and Forecast - by Service Type
- 9. Middle East & Africa Taxi Industry Australia Analysis, Insights and Forecast, 2020-2032
- 9.1. Market Analysis, Insights and Forecast - by Service Type
- 9.1.1. Ride Hailing
- 9.1.2. Ridesharing
- 9.2. Market Analysis, Insights and Forecast - by Booking Type
- 9.2.1. Online Booking
- 9.2.2. Offline Booking
- 9.3. Market Analysis, Insights and Forecast - by Vehicle Type
- 9.3.1. Hatchbacks
- 9.3.2. Sedans
- 9.3.3. SUVs/MPVs
- 9.1. Market Analysis, Insights and Forecast - by Service Type
- 10. Asia Pacific Taxi Industry Australia Analysis, Insights and Forecast, 2020-2032
- 10.1. Market Analysis, Insights and Forecast - by Service Type
- 10.1.1. Ride Hailing
- 10.1.2. Ridesharing
- 10.2. Market Analysis, Insights and Forecast - by Booking Type
- 10.2.1. Online Booking
- 10.2.2. Offline Booking
- 10.3. Market Analysis, Insights and Forecast - by Vehicle Type
- 10.3.1. Hatchbacks
- 10.3.2. Sedans
- 10.3.3. SUVs/MPVs
- 10.1. Market Analysis, Insights and Forecast - by Service Type
- 11. Competitive Analysis
- 11.1. Global Market Share Analysis 2025
- 11.2. Company Profiles
- 11.2.1 Legion Cabs
- 11.2.1.1. Overview
- 11.2.1.2. Products
- 11.2.1.3. SWOT Analysis
- 11.2.1.4. Recent Developments
- 11.2.1.5. Financials (Based on Availability)
- 11.2.2 Ingogo
- 11.2.2.1. Overview
- 11.2.2.2. Products
- 11.2.2.3. SWOT Analysis
- 11.2.2.4. Recent Developments
- 11.2.2.5. Financials (Based on Availability)
- 11.2.3 Uber Technologies Inc
- 11.2.3.1. Overview
- 11.2.3.2. Products
- 11.2.3.3. SWOT Analysis
- 11.2.3.4. Recent Developments
- 11.2.3.5. Financials (Based on Availability)
- 11.2.4 Taxi Apps Pty Ltd (GoCatch)
- 11.2.4.1. Overview
- 11.2.4.2. Products
- 11.2.4.3. SWOT Analysis
- 11.2.4.4. Recent Developments
- 11.2.4.5. Financials (Based on Availability)
- 11.2.5 P2P Transport Limited
- 11.2.5.1. Overview
- 11.2.5.2. Products
- 11.2.5.3. SWOT Analysis
- 11.2.5.4. Recent Developments
- 11.2.5.5. Financials (Based on Availability)
- 11.2.6 GM Cabs
- 11.2.6.1. Overview
- 11.2.6.2. Products
- 11.2.6.3. SWOT Analysis
- 11.2.6.4. Recent Developments
- 11.2.6.5. Financials (Based on Availability)
- 11.2.7 Rydo Taxi
- 11.2.7.1. Overview
- 11.2.7.2. Products
- 11.2.7.3. SWOT Analysis
- 11.2.7.4. Recent Developments
- 11.2.7.5. Financials (Based on Availability)
- 11.2.8 Bolt Technology OÜ
- 11.2.8.1. Overview
- 11.2.8.2. Products
- 11.2.8.3. SWOT Analysis
- 11.2.8.4. Recent Developments
- 11.2.8.5. Financials (Based on Availability)
- 11.2.9 A2B Australia Limited
- 11.2.9.1. Overview
- 11.2.9.2. Products
- 11.2.9.3. SWOT Analysis
- 11.2.9.4. Recent Developments
- 11.2.9.5. Financials (Based on Availability)
- 11.2.10 ANI Technologies Pvt Ltd (Ola)
- 11.2.10.1. Overview
- 11.2.10.2. Products
- 11.2.10.3. SWOT Analysis
- 11.2.10.4. Recent Developments
- 11.2.10.5. Financials (Based on Availability)
- 11.2.11 (Didi Chuxing) Beijing Xiaoju Technology Co Ltd *List Not Exhaustive
- 11.2.11.1. Overview
- 11.2.11.2. Products
- 11.2.11.3. SWOT Analysis
- 11.2.11.4. Recent Developments
- 11.2.11.5. Financials (Based on Availability)
- 11.2.1 Legion Cabs
List of Figures
- Figure 1: Global Taxi Industry Australia Revenue Breakdown (Million, %) by Region 2025 & 2033
- Figure 2: North America Taxi Industry Australia Revenue (Million), by Service Type 2025 & 2033
- Figure 3: North America Taxi Industry Australia Revenue Share (%), by Service Type 2025 & 2033
- Figure 4: North America Taxi Industry Australia Revenue (Million), by Booking Type 2025 & 2033
- Figure 5: North America Taxi Industry Australia Revenue Share (%), by Booking Type 2025 & 2033
- Figure 6: North America Taxi Industry Australia Revenue (Million), by Vehicle Type 2025 & 2033
- Figure 7: North America Taxi Industry Australia Revenue Share (%), by Vehicle Type 2025 & 2033
- Figure 8: North America Taxi Industry Australia Revenue (Million), by Country 2025 & 2033
- Figure 9: North America Taxi Industry Australia Revenue Share (%), by Country 2025 & 2033
- Figure 10: South America Taxi Industry Australia Revenue (Million), by Service Type 2025 & 2033
- Figure 11: South America Taxi Industry Australia Revenue Share (%), by Service Type 2025 & 2033
- Figure 12: South America Taxi Industry Australia Revenue (Million), by Booking Type 2025 & 2033
- Figure 13: South America Taxi Industry Australia Revenue Share (%), by Booking Type 2025 & 2033
- Figure 14: South America Taxi Industry Australia Revenue (Million), by Vehicle Type 2025 & 2033
- Figure 15: South America Taxi Industry Australia Revenue Share (%), by Vehicle Type 2025 & 2033
- Figure 16: South America Taxi Industry Australia Revenue (Million), by Country 2025 & 2033
- Figure 17: South America Taxi Industry Australia Revenue Share (%), by Country 2025 & 2033
- Figure 18: Europe Taxi Industry Australia Revenue (Million), by Service Type 2025 & 2033
- Figure 19: Europe Taxi Industry Australia Revenue Share (%), by Service Type 2025 & 2033
- Figure 20: Europe Taxi Industry Australia Revenue (Million), by Booking Type 2025 & 2033
- Figure 21: Europe Taxi Industry Australia Revenue Share (%), by Booking Type 2025 & 2033
- Figure 22: Europe Taxi Industry Australia Revenue (Million), by Vehicle Type 2025 & 2033
- Figure 23: Europe Taxi Industry Australia Revenue Share (%), by Vehicle Type 2025 & 2033
- Figure 24: Europe Taxi Industry Australia Revenue (Million), by Country 2025 & 2033
- Figure 25: Europe Taxi Industry Australia Revenue Share (%), by Country 2025 & 2033
- Figure 26: Middle East & Africa Taxi Industry Australia Revenue (Million), by Service Type 2025 & 2033
- Figure 27: Middle East & Africa Taxi Industry Australia Revenue Share (%), by Service Type 2025 & 2033
- Figure 28: Middle East & Africa Taxi Industry Australia Revenue (Million), by Booking Type 2025 & 2033
- Figure 29: Middle East & Africa Taxi Industry Australia Revenue Share (%), by Booking Type 2025 & 2033
- Figure 30: Middle East & Africa Taxi Industry Australia Revenue (Million), by Vehicle Type 2025 & 2033
- Figure 31: Middle East & Africa Taxi Industry Australia Revenue Share (%), by Vehicle Type 2025 & 2033
- Figure 32: Middle East & Africa Taxi Industry Australia Revenue (Million), by Country 2025 & 2033
- Figure 33: Middle East & Africa Taxi Industry Australia Revenue Share (%), by Country 2025 & 2033
- Figure 34: Asia Pacific Taxi Industry Australia Revenue (Million), by Service Type 2025 & 2033
- Figure 35: Asia Pacific Taxi Industry Australia Revenue Share (%), by Service Type 2025 & 2033
- Figure 36: Asia Pacific Taxi Industry Australia Revenue (Million), by Booking Type 2025 & 2033
- Figure 37: Asia Pacific Taxi Industry Australia Revenue Share (%), by Booking Type 2025 & 2033
- Figure 38: Asia Pacific Taxi Industry Australia Revenue (Million), by Vehicle Type 2025 & 2033
- Figure 39: Asia Pacific Taxi Industry Australia Revenue Share (%), by Vehicle Type 2025 & 2033
- Figure 40: Asia Pacific Taxi Industry Australia Revenue (Million), by Country 2025 & 2033
- Figure 41: Asia Pacific Taxi Industry Australia Revenue Share (%), by Country 2025 & 2033
List of Tables
- Table 1: Global Taxi Industry Australia Revenue Million Forecast, by Service Type 2020 & 2033
- Table 2: Global Taxi Industry Australia Revenue Million Forecast, by Booking Type 2020 & 2033
- Table 3: Global Taxi Industry Australia Revenue Million Forecast, by Vehicle Type 2020 & 2033
- Table 4: Global Taxi Industry Australia Revenue Million Forecast, by Region 2020 & 2033
- Table 5: Global Taxi Industry Australia Revenue Million Forecast, by Service Type 2020 & 2033
- Table 6: Global Taxi Industry Australia Revenue Million Forecast, by Booking Type 2020 & 2033
- Table 7: Global Taxi Industry Australia Revenue Million Forecast, by Vehicle Type 2020 & 2033
- Table 8: Global Taxi Industry Australia Revenue Million Forecast, by Country 2020 & 2033
- Table 9: United States Taxi Industry Australia Revenue (Million) Forecast, by Application 2020 & 2033
- Table 10: Canada Taxi Industry Australia Revenue (Million) Forecast, by Application 2020 & 2033
- Table 11: Mexico Taxi Industry Australia Revenue (Million) Forecast, by Application 2020 & 2033
- Table 12: Global Taxi Industry Australia Revenue Million Forecast, by Service Type 2020 & 2033
- Table 13: Global Taxi Industry Australia Revenue Million Forecast, by Booking Type 2020 & 2033
- Table 14: Global Taxi Industry Australia Revenue Million Forecast, by Vehicle Type 2020 & 2033
- Table 15: Global Taxi Industry Australia Revenue Million Forecast, by Country 2020 & 2033
- Table 16: Brazil Taxi Industry Australia Revenue (Million) Forecast, by Application 2020 & 2033
- Table 17: Argentina Taxi Industry Australia Revenue (Million) Forecast, by Application 2020 & 2033
- Table 18: Rest of South America Taxi Industry Australia Revenue (Million) Forecast, by Application 2020 & 2033
- Table 19: Global Taxi Industry Australia Revenue Million Forecast, by Service Type 2020 & 2033
- Table 20: Global Taxi Industry Australia Revenue Million Forecast, by Booking Type 2020 & 2033
- Table 21: Global Taxi Industry Australia Revenue Million Forecast, by Vehicle Type 2020 & 2033
- Table 22: Global Taxi Industry Australia Revenue Million Forecast, by Country 2020 & 2033
- Table 23: United Kingdom Taxi Industry Australia Revenue (Million) Forecast, by Application 2020 & 2033
- Table 24: Germany Taxi Industry Australia Revenue (Million) Forecast, by Application 2020 & 2033
- Table 25: France Taxi Industry Australia Revenue (Million) Forecast, by Application 2020 & 2033
- Table 26: Italy Taxi Industry Australia Revenue (Million) Forecast, by Application 2020 & 2033
- Table 27: Spain Taxi Industry Australia Revenue (Million) Forecast, by Application 2020 & 2033
- Table 28: Russia Taxi Industry Australia Revenue (Million) Forecast, by Application 2020 & 2033
- Table 29: Benelux Taxi Industry Australia Revenue (Million) Forecast, by Application 2020 & 2033
- Table 30: Nordics Taxi Industry Australia Revenue (Million) Forecast, by Application 2020 & 2033
- Table 31: Rest of Europe Taxi Industry Australia Revenue (Million) Forecast, by Application 2020 & 2033
- Table 32: Global Taxi Industry Australia Revenue Million Forecast, by Service Type 2020 & 2033
- Table 33: Global Taxi Industry Australia Revenue Million Forecast, by Booking Type 2020 & 2033
- Table 34: Global Taxi Industry Australia Revenue Million Forecast, by Vehicle Type 2020 & 2033
- Table 35: Global Taxi Industry Australia Revenue Million Forecast, by Country 2020 & 2033
- Table 36: Turkey Taxi Industry Australia Revenue (Million) Forecast, by Application 2020 & 2033
- Table 37: Israel Taxi Industry Australia Revenue (Million) Forecast, by Application 2020 & 2033
- Table 38: GCC Taxi Industry Australia Revenue (Million) Forecast, by Application 2020 & 2033
- Table 39: North Africa Taxi Industry Australia Revenue (Million) Forecast, by Application 2020 & 2033
- Table 40: South Africa Taxi Industry Australia Revenue (Million) Forecast, by Application 2020 & 2033
- Table 41: Rest of Middle East & Africa Taxi Industry Australia Revenue (Million) Forecast, by Application 2020 & 2033
- Table 42: Global Taxi Industry Australia Revenue Million Forecast, by Service Type 2020 & 2033
- Table 43: Global Taxi Industry Australia Revenue Million Forecast, by Booking Type 2020 & 2033
- Table 44: Global Taxi Industry Australia Revenue Million Forecast, by Vehicle Type 2020 & 2033
- Table 45: Global Taxi Industry Australia Revenue Million Forecast, by Country 2020 & 2033
- Table 46: China Taxi Industry Australia Revenue (Million) Forecast, by Application 2020 & 2033
- Table 47: India Taxi Industry Australia Revenue (Million) Forecast, by Application 2020 & 2033
- Table 48: Japan Taxi Industry Australia Revenue (Million) Forecast, by Application 2020 & 2033
- Table 49: South Korea Taxi Industry Australia Revenue (Million) Forecast, by Application 2020 & 2033
- Table 50: ASEAN Taxi Industry Australia Revenue (Million) Forecast, by Application 2020 & 2033
- Table 51: Oceania Taxi Industry Australia Revenue (Million) Forecast, by Application 2020 & 2033
- Table 52: Rest of Asia Pacific Taxi Industry Australia Revenue (Million) Forecast, by Application 2020 & 2033
Frequently Asked Questions
1. What is the projected Compound Annual Growth Rate (CAGR) of the Taxi Industry Australia?
The projected CAGR is approximately 9.60%.
2. Which companies are prominent players in the Taxi Industry Australia?
Key companies in the market include Legion Cabs, Ingogo, Uber Technologies Inc, Taxi Apps Pty Ltd (GoCatch), P2P Transport Limited, GM Cabs, Rydo Taxi, Bolt Technology OÜ, A2B Australia Limited, ANI Technologies Pvt Ltd (Ola), (Didi Chuxing) Beijing Xiaoju Technology Co Ltd *List Not Exhaustive.
3. What are the main segments of the Taxi Industry Australia?
The market segments include Service Type, Booking Type, Vehicle Type.
4. Can you provide details about the market size?
The market size is estimated to be USD 3.73 Million as of 2022.
5. What are some drivers contributing to market growth?
Growing Tourism Industry in Australia.
6. What are the notable trends driving market growth?
Online Booking Holds the Highest Share.
7. Are there any restraints impacting market growth?
Varying Government Regulations on Taxi Services.
8. Can you provide examples of recent developments in the market?
October 2022: Ingenico, the most trusted technological partner for payment acceptance, and Live Payments, one of Australia's leading payment service providers, announced their cooperation for long-term strategic partnerships to equip retailers and taxis with seamless and convenient payment and commerce solutions.
9. What pricing options are available for accessing the report?
Pricing options include single-user, multi-user, and enterprise licenses priced at USD 3800, USD 4500, and USD 5800 respectively.
10. Is the market size provided in terms of value or volume?
The market size is provided in terms of value, measured in Million.
11. Are there any specific market keywords associated with the report?
Yes, the market keyword associated with the report is "Taxi Industry Australia," which aids in identifying and referencing the specific market segment covered.
12. How do I determine which pricing option suits my needs best?
The pricing options vary based on user requirements and access needs. Individual users may opt for single-user licenses, while businesses requiring broader access may choose multi-user or enterprise licenses for cost-effective access to the report.
13. Are there any additional resources or data provided in the Taxi Industry Australia report?
While the report offers comprehensive insights, it's advisable to review the specific contents or supplementary materials provided to ascertain if additional resources or data are available.
14. How can I stay updated on further developments or reports in the Taxi Industry Australia?
To stay informed about further developments, trends, and reports in the Taxi Industry Australia, consider subscribing to industry newsletters, following relevant companies and organizations, or regularly checking reputable industry news sources and publications.
Methodology
Step 1 - Identification of Relevant Samples Size from Population Database


Step 2 - Approaches for Defining Global Market Size (Value, Volume* & Price*)

Note*: In applicable scenarios
Step 3 - Data Sources
Primary Research
- Web Analytics
- Survey Reports
- Research Institute
- Latest Research Reports
- Opinion Leaders
Secondary Research
- Annual Reports
- White Paper
- Latest Press Release
- Industry Association
- Paid Database
- Investor Presentations

Step 4 - Data Triangulation
Involves using different sources of information in order to increase the validity of a study
These sources are likely to be stakeholders in a program - participants, other researchers, program staff, other community members, and so on.
Then we put all data in single framework & apply various statistical tools to find out the dynamic on the market.
During the analysis stage, feedback from the stakeholder groups would be compared to determine areas of agreement as well as areas of divergence