
Key Insights
The Telecom Expense Management (TEM) market, valued at $4.33 billion in 2025, is projected to experience robust growth, driven by the increasing complexity of telecom services and the need for cost optimization within enterprises. A Compound Annual Growth Rate (CAGR) of 14.26% from 2025 to 2033 indicates a significant expansion, reaching an estimated market size exceeding $15 billion by 2033. Key drivers include the rising adoption of cloud-based TEM solutions, offering enhanced scalability and accessibility, and the growing demand for improved visibility and control over telecom spending across diverse business units. Furthermore, the burgeoning adoption of 5G technology and the Internet of Things (IoT) are adding complexity to telecom inventories, further fueling the demand for sophisticated TEM solutions. While data security and integration challenges pose some restraints, the overall market trajectory remains positive, particularly within sectors like BFSI (Banking, Financial Services, and Insurance), consumer goods & retail, and manufacturing, which are witnessing substantial growth in telecom usage. The market is segmented by solution (invoice management, sourcing management, etc.), service (hosted and managed), and end-user industry, offering various deployment models catering to diverse organizational needs. The competitive landscape is populated by a mix of established players and emerging companies, constantly innovating to meet the evolving market demands.
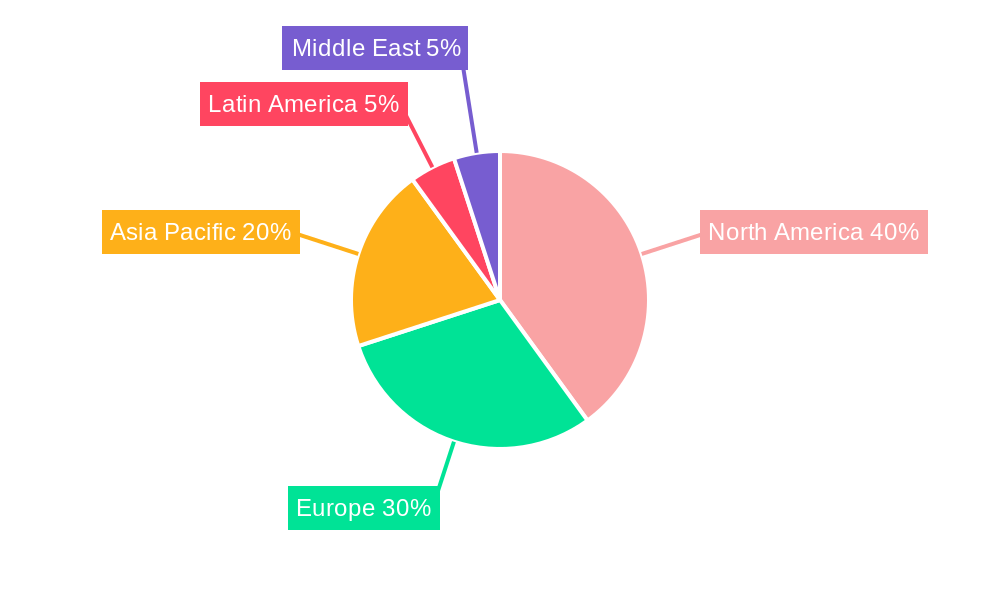
The substantial growth forecast for the TEM market stems from multiple factors beyond the core drivers. The increasing adoption of BYOD (Bring Your Own Device) policies and the proliferation of mobile workforce necessitates stringent cost management and effective inventory tracking, which TEM solutions effectively address. Furthermore, regulatory compliance requirements related to telecom usage and expense reporting are pushing enterprises toward adopting TEM systems, ensuring accuracy and efficiency. The hosted service segment is expected to capture a significant market share due to its flexibility and cost-effectiveness compared to traditional on-premise solutions. Geographically, North America and Europe currently hold substantial market share, however, the Asia-Pacific region is expected to witness rapid growth in the coming years fueled by increased digitalization and a growing number of enterprises. Continuous innovation within the TEM space, including the integration of AI and machine learning for advanced analytics and automation, will further accelerate market expansion and create new opportunities for providers.

Telecom Expense Management (TEM) Industry Report: 2019-2033
This comprehensive report provides a detailed analysis of the Telecom Expense Management (TEM) industry, offering invaluable insights for industry professionals, investors, and strategists. With a study period spanning 2019-2033, a base year of 2025, and a forecast period of 2025-2033, this report unveils the market's current state and future trajectory. The market is projected to reach xx Million by 2033, exhibiting a significant Compound Annual Growth Rate (CAGR).
Telecom Expense Management Industry Market Structure & Innovation Trends
The global Telecom Expense Management (TEM) market is moderately fragmented, with several key players competing for market share. Companies like Auditel Inc, Valicom Corporation, Tangoe Inc, Avotus Corporation, Calero-MDSL, CGI Inc, WidePoint Solutions Corporation, Upland Software Inc (Cimpl), Sakon Inc, and TeleManagement Technologies Inc hold significant positions, although market share data for individual players is not publicly available at this moment and requires additional research. The industry is characterized by ongoing mergers and acquisitions (M&A) activity, reflecting a trend towards consolidation and expansion. For example, the Renodis acquisition of 12 Points Consulting in November 2022 highlights this trend. The value of this deal was not publicly disclosed, but similar deals have ranged from xx Million to xx Million, reflecting a significant investment in this market segment.
Innovation is driven by several factors: the increasing complexity of telecom services, the need for improved cost control, and the adoption of advanced technologies like Artificial Intelligence (AI) and Robotic Process Automation (RPA). Regulatory frameworks vary across regions, impacting market dynamics. Product substitutes are limited, with TEM solutions often being integrated into broader enterprise resource planning (ERP) systems. End-user demographics are diverse, spanning various industries, and the continuous development of cloud based, accessible solutions will play a large role in the coming years.

Telecom Expense Management Industry Market Dynamics & Trends
The TEM market is experiencing robust growth, driven by factors such as the rising adoption of cloud-based solutions, increasing data volumes, and a growing need for efficient expense management in businesses of all sizes. Technological disruptions, including the integration of AI and Machine Learning, are enhancing automation and improving accuracy, accelerating the efficiency of the TEM process. Consumer preferences are shifting towards comprehensive, integrated solutions that provide a holistic view of telecom expenses and assist companies of all sizes in handling the complexities and nuances of telecom expenses. The market penetration of TEM solutions is increasing across various industries, particularly in sectors like BFSI, IT & Telecom, and Healthcare, which rely heavily on advanced telecommunications capabilities. The CAGR for the forecast period (2025-2033) is projected to be xx%, indicating substantial market expansion. Competitive dynamics are marked by ongoing innovation, strategic partnerships, and M&A activities.
Dominant Regions & Segments in Telecom Expense Management Industry
While precise regional market share data is currently unavailable for this report, North America and Europe are expected to be leading regions, driven by high telecom expenditure, robust IT infrastructure, and a higher adoption rate of advanced technologies. Within the market segmentation, analysis will include:
By Solution: Invoice Management, which remains a core segment, and Sourcing Management both maintain large market share. The Business Management and Dispute Management segments are growing rapidly as companies realize the value of streamlined processes and conflict resolution capabilities.
By Service: Hosted services are gaining popularity due to their scalability and cost-effectiveness, while managed services continue to play a significant role, offering specialized expertise.
By End-user Industry: BFSI (Banking, Financial Services, and Insurance), IT & Telecom, and Manufacturing segments are significant consumers of TEM solutions, driven by their complex telecom infrastructures and the need for cost optimization.
Key drivers for dominance in specific regions and segments include favorable economic policies, robust IT infrastructure, supportive regulatory frameworks, and a strong focus on digital transformation.
Telecom Expense Management Industry Product Innovations
Recent product innovations in the TEM industry center on increased automation, integration with other enterprise systems, and the incorporation of advanced analytics. This includes the adoption of RPA (Robotic Process Automation), AI-driven invoice processing, and real-time data visualization for improved decision-making. These innovations aim to improve accuracy, reduce processing times, and provide more granular insights into telecom spending. The market fit for these advanced solutions is strong, particularly among larger enterprises with complex telecom needs. Tangoe's integration of RPA, for example, represents a notable advancement in automating data processing and providing a competitive edge.
Report Scope & Segmentation Analysis
This report provides a comprehensive analysis of the TEM market, segmented by solution (Invoice Management, Sourcing Management, Business Management, Dispute Management, Other Solutions), service (Hosted Service, Managed Service), and end-user industry (BFSI, Consumer Goods & Retail, Manufacturing, IT & Telecom, Healthcare, Other End-user Industries). Each segment’s growth projections, market size estimates, and competitive landscape are analyzed in detail. The market size for each segment is projected to reach several million dollars by 2033, with variations in growth rates across different segments. Competitive dynamics include factors such as pricing strategies, innovation, and market penetration.
Key Drivers of Telecom Expense Management Industry Growth
The TEM industry's growth is fueled by several key drivers: the increasing complexity of telecom services and contracts, the rising need for cost optimization and efficiency, the adoption of cloud-based solutions, the growing demand for data analytics and improved visibility into telecom spending, and the ongoing digital transformation initiatives across various industries. The integration of AI and machine learning technologies further accelerates automation and enhances decision-making.
Challenges in the Telecom Expense Management Industry Sector
The TEM industry faces challenges such as the need for seamless integration with various enterprise systems, the complexity of telecom contracts and billing practices, and the ever-evolving technological landscape. Maintaining data security and privacy is another significant concern. The industry must also overcome hurdles related to vendor lock-in and the potential for high implementation costs for smaller businesses, although many TEM vendors are addressing this through flexible pricing and cloud-based solutions.
Emerging Opportunities in Telecom Expense Management Industry
Emerging opportunities lie in the expansion into new markets, especially in developing economies with rapidly growing telecom sectors, and the increasing demand for specialized solutions for specific industries. The integration of advanced technologies like AI, IoT, and blockchain presents further opportunities for innovation and enhanced efficiency. The adoption of 5G technology and the growth of the Internet of Things (IoT) will also drive demand for more sophisticated TEM solutions.
Leading Players in the Telecom Expense Management Industry Market
- Auditel Inc
- Valicom Corporation
- Tangoe Inc
- Avotus Corporation
- Calero-MDSL
- CGI Inc
- WidePoint Solutions Corporation
- Upland Software Inc (Cimpl)
- Sakon Inc
- TeleManagement Technologies Inc
Key Developments in Telecom Expense Management Industry
- September 2023: Prodapt's partnership with ServiceNow to expand its TMT business demonstrates the increasing importance of digital workflows and enhanced customer experience in the TEM sector.
- November 2022: Renodis' acquisition of 12 Points Consulting highlights the consolidation trend within the TEM industry and signifies a movement towards broader service offerings.
- September 2022: Tangoe's implementation of RPA showcases the adoption of cutting-edge technologies to improve efficiency, reduce errors, and strengthen competitive advantage within the TEM market.
Future Outlook for Telecom Expense Management Industry Market
The future of the TEM industry is bright, driven by continuous technological advancements, the increasing complexity of telecom services, and the growing need for cost optimization across diverse industries. Strategic partnerships, acquisitions, and the development of innovative solutions will further shape the market landscape. The expansion into emerging markets and the adoption of advanced analytics will create significant growth opportunities. The market is poised for sustained growth throughout the forecast period, with opportunities for both established players and new entrants to capitalize on market trends and innovations.
Telecom Expense Management Industry Segmentation
-
1. Solution
- 1.1. Invoice Management
- 1.2. Sourcing Management
- 1.3. Business Management
- 1.4. Dispute Management
- 1.5. Other Solutions
-
2. Service
- 2.1. Hosted Service
- 2.2. Managed Service
-
3. End-user Industry
- 3.1. BFSI
- 3.2. Consumer Goods & Retail
- 3.3. Manufacturing
- 3.4. IT & Telecom
- 3.5. Healthcare
- 3.6. Other End-user Industries
Telecom Expense Management Industry Segmentation By Geography
- 1. North America
- 2. Europe
- 3. Asia Pacific
- 4. Latin America
- 5. Middle East
Telecom Expense Management Industry REPORT HIGHLIGHTS
| Aspects | Details |
|---|---|
| Study Period | 2019-2033 |
| Base Year | 2024 |
| Estimated Year | 2025 |
| Forecast Period | 2025-2033 |
| Historical Period | 2019-2024 |
| Growth Rate | CAGR of 14.26% from 2019-2033 |
| Segmentation |
|
Table of Contents
- 1. Introduction
- 1.1. Research Scope
- 1.2. Market Segmentation
- 1.3. Research Methodology
- 1.4. Definitions and Assumptions
- 2. Executive Summary
- 2.1. Introduction
- 3. Market Dynamics
- 3.1. Introduction
- 3.2. Market Drivers
- 3.2.1. Increasing Adoption of Mobile Phones and Other Portable Devices; Significant Cost Reduction and Expense Visibility
- 3.3. Market Restrains
- 3.3.1. Lack of Interoperability Due to Set Industry Standards
- 3.4. Market Trends
- 3.4.1. BFSI Segment is Expected to Gain Significant Traction
- 4. Market Factor Analysis
- 4.1. Porters Five Forces
- 4.2. Supply/Value Chain
- 4.3. PESTEL analysis
- 4.4. Market Entropy
- 4.5. Patent/Trademark Analysis
- 5. Global Telecom Expense Management Industry Analysis, Insights and Forecast, 2019-2031
- 5.1. Market Analysis, Insights and Forecast - by Solution
- 5.1.1. Invoice Management
- 5.1.2. Sourcing Management
- 5.1.3. Business Management
- 5.1.4. Dispute Management
- 5.1.5. Other Solutions
- 5.2. Market Analysis, Insights and Forecast - by Service
- 5.2.1. Hosted Service
- 5.2.2. Managed Service
- 5.3. Market Analysis, Insights and Forecast - by End-user Industry
- 5.3.1. BFSI
- 5.3.2. Consumer Goods & Retail
- 5.3.3. Manufacturing
- 5.3.4. IT & Telecom
- 5.3.5. Healthcare
- 5.3.6. Other End-user Industries
- 5.4. Market Analysis, Insights and Forecast - by Region
- 5.4.1. North America
- 5.4.2. Europe
- 5.4.3. Asia Pacific
- 5.4.4. Latin America
- 5.4.5. Middle East
- 5.1. Market Analysis, Insights and Forecast - by Solution
- 6. North America Telecom Expense Management Industry Analysis, Insights and Forecast, 2019-2031
- 6.1. Market Analysis, Insights and Forecast - by Solution
- 6.1.1. Invoice Management
- 6.1.2. Sourcing Management
- 6.1.3. Business Management
- 6.1.4. Dispute Management
- 6.1.5. Other Solutions
- 6.2. Market Analysis, Insights and Forecast - by Service
- 6.2.1. Hosted Service
- 6.2.2. Managed Service
- 6.3. Market Analysis, Insights and Forecast - by End-user Industry
- 6.3.1. BFSI
- 6.3.2. Consumer Goods & Retail
- 6.3.3. Manufacturing
- 6.3.4. IT & Telecom
- 6.3.5. Healthcare
- 6.3.6. Other End-user Industries
- 6.1. Market Analysis, Insights and Forecast - by Solution
- 7. Europe Telecom Expense Management Industry Analysis, Insights and Forecast, 2019-2031
- 7.1. Market Analysis, Insights and Forecast - by Solution
- 7.1.1. Invoice Management
- 7.1.2. Sourcing Management
- 7.1.3. Business Management
- 7.1.4. Dispute Management
- 7.1.5. Other Solutions
- 7.2. Market Analysis, Insights and Forecast - by Service
- 7.2.1. Hosted Service
- 7.2.2. Managed Service
- 7.3. Market Analysis, Insights and Forecast - by End-user Industry
- 7.3.1. BFSI
- 7.3.2. Consumer Goods & Retail
- 7.3.3. Manufacturing
- 7.3.4. IT & Telecom
- 7.3.5. Healthcare
- 7.3.6. Other End-user Industries
- 7.1. Market Analysis, Insights and Forecast - by Solution
- 8. Asia Pacific Telecom Expense Management Industry Analysis, Insights and Forecast, 2019-2031
- 8.1. Market Analysis, Insights and Forecast - by Solution
- 8.1.1. Invoice Management
- 8.1.2. Sourcing Management
- 8.1.3. Business Management
- 8.1.4. Dispute Management
- 8.1.5. Other Solutions
- 8.2. Market Analysis, Insights and Forecast - by Service
- 8.2.1. Hosted Service
- 8.2.2. Managed Service
- 8.3. Market Analysis, Insights and Forecast - by End-user Industry
- 8.3.1. BFSI
- 8.3.2. Consumer Goods & Retail
- 8.3.3. Manufacturing
- 8.3.4. IT & Telecom
- 8.3.5. Healthcare
- 8.3.6. Other End-user Industries
- 8.1. Market Analysis, Insights and Forecast - by Solution
- 9. Latin America Telecom Expense Management Industry Analysis, Insights and Forecast, 2019-2031
- 9.1. Market Analysis, Insights and Forecast - by Solution
- 9.1.1. Invoice Management
- 9.1.2. Sourcing Management
- 9.1.3. Business Management
- 9.1.4. Dispute Management
- 9.1.5. Other Solutions
- 9.2. Market Analysis, Insights and Forecast - by Service
- 9.2.1. Hosted Service
- 9.2.2. Managed Service
- 9.3. Market Analysis, Insights and Forecast - by End-user Industry
- 9.3.1. BFSI
- 9.3.2. Consumer Goods & Retail
- 9.3.3. Manufacturing
- 9.3.4. IT & Telecom
- 9.3.5. Healthcare
- 9.3.6. Other End-user Industries
- 9.1. Market Analysis, Insights and Forecast - by Solution
- 10. Middle East Telecom Expense Management Industry Analysis, Insights and Forecast, 2019-2031
- 10.1. Market Analysis, Insights and Forecast - by Solution
- 10.1.1. Invoice Management
- 10.1.2. Sourcing Management
- 10.1.3. Business Management
- 10.1.4. Dispute Management
- 10.1.5. Other Solutions
- 10.2. Market Analysis, Insights and Forecast - by Service
- 10.2.1. Hosted Service
- 10.2.2. Managed Service
- 10.3. Market Analysis, Insights and Forecast - by End-user Industry
- 10.3.1. BFSI
- 10.3.2. Consumer Goods & Retail
- 10.3.3. Manufacturing
- 10.3.4. IT & Telecom
- 10.3.5. Healthcare
- 10.3.6. Other End-user Industries
- 10.1. Market Analysis, Insights and Forecast - by Solution
- 11. North America Telecom Expense Management Industry Analysis, Insights and Forecast, 2019-2031
- 11.1. Market Analysis, Insights and Forecast - By Country/Sub-region
- 11.1.1.
- 12. Europe Telecom Expense Management Industry Analysis, Insights and Forecast, 2019-2031
- 12.1. Market Analysis, Insights and Forecast - By Country/Sub-region
- 12.1.1.
- 13. Asia Pacific Telecom Expense Management Industry Analysis, Insights and Forecast, 2019-2031
- 13.1. Market Analysis, Insights and Forecast - By Country/Sub-region
- 13.1.1.
- 14. Latin America Telecom Expense Management Industry Analysis, Insights and Forecast, 2019-2031
- 14.1. Market Analysis, Insights and Forecast - By Country/Sub-region
- 14.1.1.
- 15. Middle East Telecom Expense Management Industry Analysis, Insights and Forecast, 2019-2031
- 15.1. Market Analysis, Insights and Forecast - By Country/Sub-region
- 15.1.1.
- 16. Competitive Analysis
- 16.1. Global Market Share Analysis 2024
- 16.2. Company Profiles
- 16.2.1 Auditel Inc *List Not Exhaustive
- 16.2.1.1. Overview
- 16.2.1.2. Products
- 16.2.1.3. SWOT Analysis
- 16.2.1.4. Recent Developments
- 16.2.1.5. Financials (Based on Availability)
- 16.2.2 Valicom Corporation
- 16.2.2.1. Overview
- 16.2.2.2. Products
- 16.2.2.3. SWOT Analysis
- 16.2.2.4. Recent Developments
- 16.2.2.5. Financials (Based on Availability)
- 16.2.3 Tangoe Inc
- 16.2.3.1. Overview
- 16.2.3.2. Products
- 16.2.3.3. SWOT Analysis
- 16.2.3.4. Recent Developments
- 16.2.3.5. Financials (Based on Availability)
- 16.2.4 Avotus Corporation
- 16.2.4.1. Overview
- 16.2.4.2. Products
- 16.2.4.3. SWOT Analysis
- 16.2.4.4. Recent Developments
- 16.2.4.5. Financials (Based on Availability)
- 16.2.5 Calero-MDSL
- 16.2.5.1. Overview
- 16.2.5.2. Products
- 16.2.5.3. SWOT Analysis
- 16.2.5.4. Recent Developments
- 16.2.5.5. Financials (Based on Availability)
- 16.2.6 CGI Inc
- 16.2.6.1. Overview
- 16.2.6.2. Products
- 16.2.6.3. SWOT Analysis
- 16.2.6.4. Recent Developments
- 16.2.6.5. Financials (Based on Availability)
- 16.2.7 WidePoint Solutions Corporation
- 16.2.7.1. Overview
- 16.2.7.2. Products
- 16.2.7.3. SWOT Analysis
- 16.2.7.4. Recent Developments
- 16.2.7.5. Financials (Based on Availability)
- 16.2.8 Upland Software Inc (Cimpl)
- 16.2.8.1. Overview
- 16.2.8.2. Products
- 16.2.8.3. SWOT Analysis
- 16.2.8.4. Recent Developments
- 16.2.8.5. Financials (Based on Availability)
- 16.2.9 Sakon Inc
- 16.2.9.1. Overview
- 16.2.9.2. Products
- 16.2.9.3. SWOT Analysis
- 16.2.9.4. Recent Developments
- 16.2.9.5. Financials (Based on Availability)
- 16.2.10 TeleManagement Technologies Inc
- 16.2.10.1. Overview
- 16.2.10.2. Products
- 16.2.10.3. SWOT Analysis
- 16.2.10.4. Recent Developments
- 16.2.10.5. Financials (Based on Availability)
- 16.2.1 Auditel Inc *List Not Exhaustive
List of Figures
- Figure 1: Global Telecom Expense Management Industry Revenue Breakdown (Million, %) by Region 2024 & 2032
- Figure 2: North America Telecom Expense Management Industry Revenue (Million), by Country 2024 & 2032
- Figure 3: North America Telecom Expense Management Industry Revenue Share (%), by Country 2024 & 2032
- Figure 4: Europe Telecom Expense Management Industry Revenue (Million), by Country 2024 & 2032
- Figure 5: Europe Telecom Expense Management Industry Revenue Share (%), by Country 2024 & 2032
- Figure 6: Asia Pacific Telecom Expense Management Industry Revenue (Million), by Country 2024 & 2032
- Figure 7: Asia Pacific Telecom Expense Management Industry Revenue Share (%), by Country 2024 & 2032
- Figure 8: Latin America Telecom Expense Management Industry Revenue (Million), by Country 2024 & 2032
- Figure 9: Latin America Telecom Expense Management Industry Revenue Share (%), by Country 2024 & 2032
- Figure 10: Middle East Telecom Expense Management Industry Revenue (Million), by Country 2024 & 2032
- Figure 11: Middle East Telecom Expense Management Industry Revenue Share (%), by Country 2024 & 2032
- Figure 12: North America Telecom Expense Management Industry Revenue (Million), by Solution 2024 & 2032
- Figure 13: North America Telecom Expense Management Industry Revenue Share (%), by Solution 2024 & 2032
- Figure 14: North America Telecom Expense Management Industry Revenue (Million), by Service 2024 & 2032
- Figure 15: North America Telecom Expense Management Industry Revenue Share (%), by Service 2024 & 2032
- Figure 16: North America Telecom Expense Management Industry Revenue (Million), by End-user Industry 2024 & 2032
- Figure 17: North America Telecom Expense Management Industry Revenue Share (%), by End-user Industry 2024 & 2032
- Figure 18: North America Telecom Expense Management Industry Revenue (Million), by Country 2024 & 2032
- Figure 19: North America Telecom Expense Management Industry Revenue Share (%), by Country 2024 & 2032
- Figure 20: Europe Telecom Expense Management Industry Revenue (Million), by Solution 2024 & 2032
- Figure 21: Europe Telecom Expense Management Industry Revenue Share (%), by Solution 2024 & 2032
- Figure 22: Europe Telecom Expense Management Industry Revenue (Million), by Service 2024 & 2032
- Figure 23: Europe Telecom Expense Management Industry Revenue Share (%), by Service 2024 & 2032
- Figure 24: Europe Telecom Expense Management Industry Revenue (Million), by End-user Industry 2024 & 2032
- Figure 25: Europe Telecom Expense Management Industry Revenue Share (%), by End-user Industry 2024 & 2032
- Figure 26: Europe Telecom Expense Management Industry Revenue (Million), by Country 2024 & 2032
- Figure 27: Europe Telecom Expense Management Industry Revenue Share (%), by Country 2024 & 2032
- Figure 28: Asia Pacific Telecom Expense Management Industry Revenue (Million), by Solution 2024 & 2032
- Figure 29: Asia Pacific Telecom Expense Management Industry Revenue Share (%), by Solution 2024 & 2032
- Figure 30: Asia Pacific Telecom Expense Management Industry Revenue (Million), by Service 2024 & 2032
- Figure 31: Asia Pacific Telecom Expense Management Industry Revenue Share (%), by Service 2024 & 2032
- Figure 32: Asia Pacific Telecom Expense Management Industry Revenue (Million), by End-user Industry 2024 & 2032
- Figure 33: Asia Pacific Telecom Expense Management Industry Revenue Share (%), by End-user Industry 2024 & 2032
- Figure 34: Asia Pacific Telecom Expense Management Industry Revenue (Million), by Country 2024 & 2032
- Figure 35: Asia Pacific Telecom Expense Management Industry Revenue Share (%), by Country 2024 & 2032
- Figure 36: Latin America Telecom Expense Management Industry Revenue (Million), by Solution 2024 & 2032
- Figure 37: Latin America Telecom Expense Management Industry Revenue Share (%), by Solution 2024 & 2032
- Figure 38: Latin America Telecom Expense Management Industry Revenue (Million), by Service 2024 & 2032
- Figure 39: Latin America Telecom Expense Management Industry Revenue Share (%), by Service 2024 & 2032
- Figure 40: Latin America Telecom Expense Management Industry Revenue (Million), by End-user Industry 2024 & 2032
- Figure 41: Latin America Telecom Expense Management Industry Revenue Share (%), by End-user Industry 2024 & 2032
- Figure 42: Latin America Telecom Expense Management Industry Revenue (Million), by Country 2024 & 2032
- Figure 43: Latin America Telecom Expense Management Industry Revenue Share (%), by Country 2024 & 2032
- Figure 44: Middle East Telecom Expense Management Industry Revenue (Million), by Solution 2024 & 2032
- Figure 45: Middle East Telecom Expense Management Industry Revenue Share (%), by Solution 2024 & 2032
- Figure 46: Middle East Telecom Expense Management Industry Revenue (Million), by Service 2024 & 2032
- Figure 47: Middle East Telecom Expense Management Industry Revenue Share (%), by Service 2024 & 2032
- Figure 48: Middle East Telecom Expense Management Industry Revenue (Million), by End-user Industry 2024 & 2032
- Figure 49: Middle East Telecom Expense Management Industry Revenue Share (%), by End-user Industry 2024 & 2032
- Figure 50: Middle East Telecom Expense Management Industry Revenue (Million), by Country 2024 & 2032
- Figure 51: Middle East Telecom Expense Management Industry Revenue Share (%), by Country 2024 & 2032
List of Tables
- Table 1: Global Telecom Expense Management Industry Revenue Million Forecast, by Region 2019 & 2032
- Table 2: Global Telecom Expense Management Industry Revenue Million Forecast, by Solution 2019 & 2032
- Table 3: Global Telecom Expense Management Industry Revenue Million Forecast, by Service 2019 & 2032
- Table 4: Global Telecom Expense Management Industry Revenue Million Forecast, by End-user Industry 2019 & 2032
- Table 5: Global Telecom Expense Management Industry Revenue Million Forecast, by Region 2019 & 2032
- Table 6: Global Telecom Expense Management Industry Revenue Million Forecast, by Country 2019 & 2032
- Table 7: Telecom Expense Management Industry Revenue (Million) Forecast, by Application 2019 & 2032
- Table 8: Global Telecom Expense Management Industry Revenue Million Forecast, by Country 2019 & 2032
- Table 9: Telecom Expense Management Industry Revenue (Million) Forecast, by Application 2019 & 2032
- Table 10: Global Telecom Expense Management Industry Revenue Million Forecast, by Country 2019 & 2032
- Table 11: Telecom Expense Management Industry Revenue (Million) Forecast, by Application 2019 & 2032
- Table 12: Global Telecom Expense Management Industry Revenue Million Forecast, by Country 2019 & 2032
- Table 13: Telecom Expense Management Industry Revenue (Million) Forecast, by Application 2019 & 2032
- Table 14: Global Telecom Expense Management Industry Revenue Million Forecast, by Country 2019 & 2032
- Table 15: Telecom Expense Management Industry Revenue (Million) Forecast, by Application 2019 & 2032
- Table 16: Global Telecom Expense Management Industry Revenue Million Forecast, by Solution 2019 & 2032
- Table 17: Global Telecom Expense Management Industry Revenue Million Forecast, by Service 2019 & 2032
- Table 18: Global Telecom Expense Management Industry Revenue Million Forecast, by End-user Industry 2019 & 2032
- Table 19: Global Telecom Expense Management Industry Revenue Million Forecast, by Country 2019 & 2032
- Table 20: Global Telecom Expense Management Industry Revenue Million Forecast, by Solution 2019 & 2032
- Table 21: Global Telecom Expense Management Industry Revenue Million Forecast, by Service 2019 & 2032
- Table 22: Global Telecom Expense Management Industry Revenue Million Forecast, by End-user Industry 2019 & 2032
- Table 23: Global Telecom Expense Management Industry Revenue Million Forecast, by Country 2019 & 2032
- Table 24: Global Telecom Expense Management Industry Revenue Million Forecast, by Solution 2019 & 2032
- Table 25: Global Telecom Expense Management Industry Revenue Million Forecast, by Service 2019 & 2032
- Table 26: Global Telecom Expense Management Industry Revenue Million Forecast, by End-user Industry 2019 & 2032
- Table 27: Global Telecom Expense Management Industry Revenue Million Forecast, by Country 2019 & 2032
- Table 28: Global Telecom Expense Management Industry Revenue Million Forecast, by Solution 2019 & 2032
- Table 29: Global Telecom Expense Management Industry Revenue Million Forecast, by Service 2019 & 2032
- Table 30: Global Telecom Expense Management Industry Revenue Million Forecast, by End-user Industry 2019 & 2032
- Table 31: Global Telecom Expense Management Industry Revenue Million Forecast, by Country 2019 & 2032
- Table 32: Global Telecom Expense Management Industry Revenue Million Forecast, by Solution 2019 & 2032
- Table 33: Global Telecom Expense Management Industry Revenue Million Forecast, by Service 2019 & 2032
- Table 34: Global Telecom Expense Management Industry Revenue Million Forecast, by End-user Industry 2019 & 2032
- Table 35: Global Telecom Expense Management Industry Revenue Million Forecast, by Country 2019 & 2032
Frequently Asked Questions
1. What is the projected Compound Annual Growth Rate (CAGR) of the Telecom Expense Management Industry?
The projected CAGR is approximately 14.26%.
2. Which companies are prominent players in the Telecom Expense Management Industry?
Key companies in the market include Auditel Inc *List Not Exhaustive, Valicom Corporation, Tangoe Inc, Avotus Corporation, Calero-MDSL, CGI Inc, WidePoint Solutions Corporation, Upland Software Inc (Cimpl), Sakon Inc, TeleManagement Technologies Inc.
3. What are the main segments of the Telecom Expense Management Industry?
The market segments include Solution, Service, End-user Industry.
4. Can you provide details about the market size?
The market size is estimated to be USD 4.33 Million as of 2022.
5. What are some drivers contributing to market growth?
Increasing Adoption of Mobile Phones and Other Portable Devices; Significant Cost Reduction and Expense Visibility.
6. What are the notable trends driving market growth?
BFSI Segment is Expected to Gain Significant Traction.
7. Are there any restraints impacting market growth?
Lack of Interoperability Due to Set Industry Standards.
8. Can you provide examples of recent developments in the market?
September 2023: Prodapt, one of the largest and fastest-growing specialized firms in the Connectedness industry, partnered to enable ServiceNow to expand its telecom, media, and tech (TMT) business to assist Communication Service Providers (CSPs). The expanded scope would drive digital workflows for greater operational agility, enhanced productivity, and intuitive customer experiences.
9. What pricing options are available for accessing the report?
Pricing options include single-user, multi-user, and enterprise licenses priced at USD 4750, USD 5250, and USD 8750 respectively.
10. Is the market size provided in terms of value or volume?
The market size is provided in terms of value, measured in Million.
11. Are there any specific market keywords associated with the report?
Yes, the market keyword associated with the report is "Telecom Expense Management Industry," which aids in identifying and referencing the specific market segment covered.
12. How do I determine which pricing option suits my needs best?
The pricing options vary based on user requirements and access needs. Individual users may opt for single-user licenses, while businesses requiring broader access may choose multi-user or enterprise licenses for cost-effective access to the report.
13. Are there any additional resources or data provided in the Telecom Expense Management Industry report?
While the report offers comprehensive insights, it's advisable to review the specific contents or supplementary materials provided to ascertain if additional resources or data are available.
14. How can I stay updated on further developments or reports in the Telecom Expense Management Industry?
To stay informed about further developments, trends, and reports in the Telecom Expense Management Industry, consider subscribing to industry newsletters, following relevant companies and organizations, or regularly checking reputable industry news sources and publications.
Methodology
Step 1 - Identification of Relevant Samples Size from Population Database


Step 2 - Approaches for Defining Global Market Size (Value, Volume* & Price*)

Note*: In applicable scenarios
Step 3 - Data Sources
Primary Research
- Web Analytics
- Survey Reports
- Research Institute
- Latest Research Reports
- Opinion Leaders
Secondary Research
- Annual Reports
- White Paper
- Latest Press Release
- Industry Association
- Paid Database
- Investor Presentations

Step 4 - Data Triangulation
Involves using different sources of information in order to increase the validity of a study
These sources are likely to be stakeholders in a program - participants, other researchers, program staff, other community members, and so on.
Then we put all data in single framework & apply various statistical tools to find out the dynamic on the market.
During the analysis stage, feedback from the stakeholder groups would be compared to determine areas of agreement as well as areas of divergence


