
Key Insights
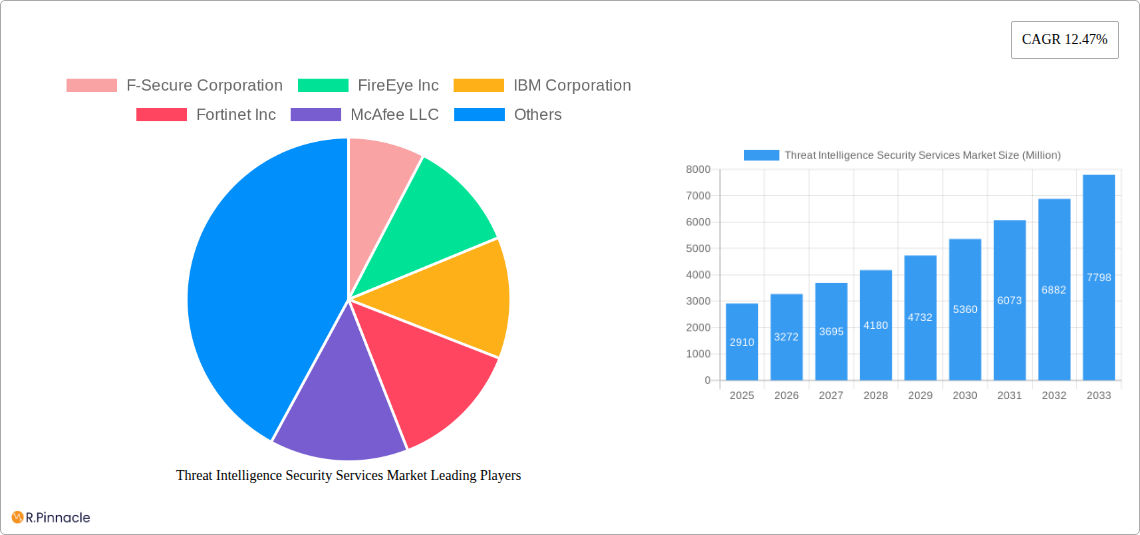
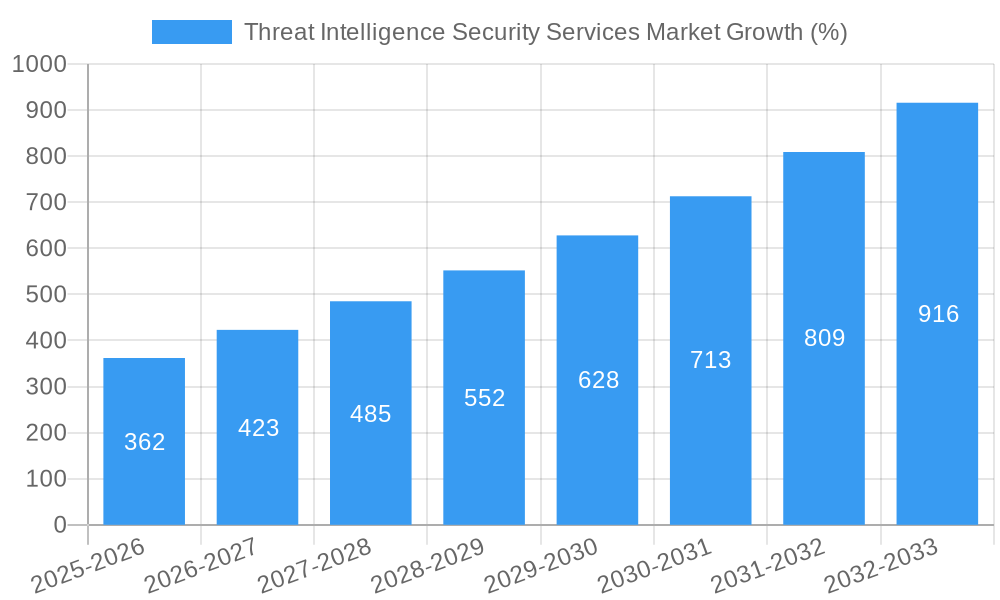
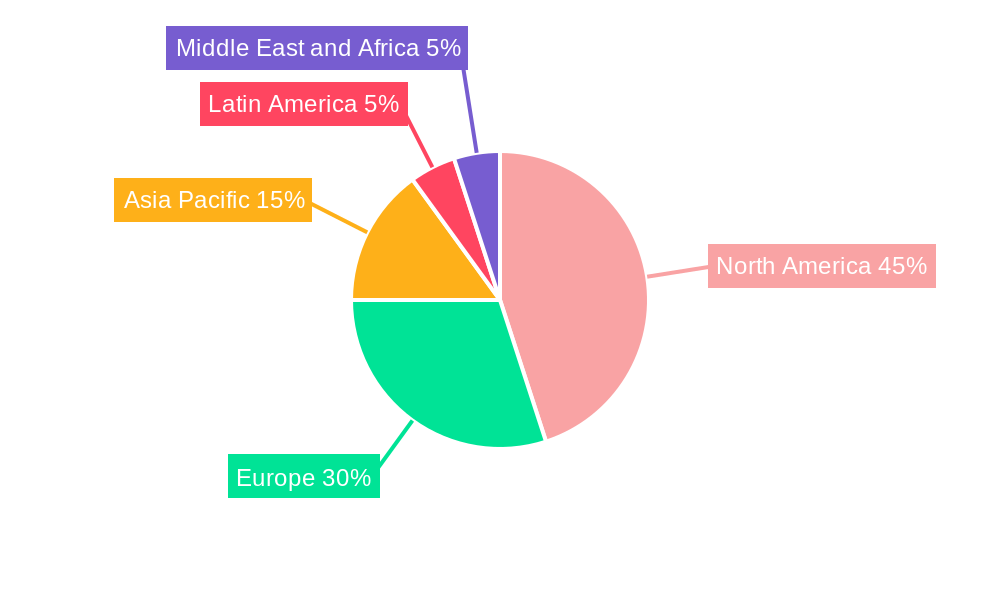
The Threat Intelligence Security Services market is experiencing robust growth, projected to reach \$2.91 billion in 2025 and exhibiting a Compound Annual Growth Rate (CAGR) of 12.47% from 2025 to 2033. This expansion is driven by the increasing sophistication of cyber threats, the rising adoption of cloud computing, and the growing need for proactive security measures across various sectors. The BFSI (Banking, Financial Services, and Insurance), healthcare, and IT industries are leading adopters, due to their high-value data assets and stringent regulatory compliance requirements. The market's segmentation reveals a preference for cloud-based deployments, offering scalability and cost-effectiveness. However, concerns regarding data privacy and security within cloud environments act as a restraint. The market's geographical distribution shows significant presence in North America and Europe, propelled by advanced technological infrastructure and high cybersecurity awareness. However, the Asia-Pacific region is anticipated to witness substantial growth in the coming years, driven by increasing digitalization and government initiatives. Companies like F-Secure, FireEye, IBM, Fortinet, and McAfee are key players, constantly innovating to address the evolving threat landscape. Competition is fierce, leading to continuous product development and strategic partnerships.
The forecast period (2025-2033) suggests continued market expansion, fueled by the increasing adoption of Artificial Intelligence (AI) and Machine Learning (ML) in threat detection and response. The ongoing evolution of cyberattacks necessitates continuous advancements in threat intelligence capabilities, ensuring robust security postures. While the on-premise deployment model retains a segment of the market, cloud-based solutions are progressively gaining dominance due to their agility and cost-efficiency. The expansion into emerging economies will also contribute significantly to overall market growth, driven by improving digital infrastructure and rising cybersecurity awareness. However, the challenges of skills shortages in cybersecurity and the complexity of integrating threat intelligence solutions effectively will need to be addressed for sustained market development.
Threat Intelligence Security Services Market Report: 2019-2033
This comprehensive report provides an in-depth analysis of the Threat Intelligence Security Services market, offering valuable insights for industry professionals, investors, and strategists. Covering the period from 2019 to 2033, with a focus on 2025, this report unravels market dynamics, growth drivers, competitive landscapes, and future outlook. The study encompasses key segments (By Deployment Mode: Cloud, On-premise; By End User: BFSI, Healthcare, IT, Retail, Life Sciences) and leading players including F-Secure Corporation, FireEye Inc, IBM Corporation, Fortinet Inc, McAfee LLC, Check Point Software Technologies Ltd, Farsight Security Inc, Webroot Inc, Juniper Networks Inc, Dell Inc, LogRhythm Inc, Symantec Corporation, LookingGlass Cyber Solutions Inc, and AlienVault Inc. The market is projected to reach xx Million by 2033, exhibiting a CAGR of xx%.
Threat Intelligence Security Services Market Structure & Innovation Trends
The Threat Intelligence Security Services market exhibits a moderately concentrated structure, with a few major players holding significant market share. Market share distribution is dynamic, with ongoing mergers and acquisitions (M&A) influencing the competitive landscape. Innovation is driven primarily by the need for advanced threat detection and response capabilities, fueled by the rising sophistication of cyberattacks and evolving regulatory frameworks like GDPR and CCPA. Product substitutes, such as traditional security solutions, face increasing pressure due to the enhanced threat intelligence provided by dedicated services. The end-user demographic is broad, encompassing various industries, with BFSI and IT sectors demonstrating particularly strong adoption.
- Market Concentration: Top 5 players hold approximately xx% of the market share in 2025.
- M&A Activity: A total of xx M&A deals were recorded between 2019-2024, with an estimated total value of xx Million. Deal sizes varied significantly, reflecting both strategic acquisitions of smaller players and consolidations amongst larger firms.
- Innovation Drivers: Advancements in AI/ML, Big Data analytics, and automation are key drivers of innovation, enabling more proactive and efficient threat detection.
- Regulatory Frameworks: Compliance requirements are driving demand for robust threat intelligence solutions to ensure data protection and minimize regulatory penalties.
Threat Intelligence Security Services Market Dynamics & Trends
The Threat Intelligence Security Services market is experiencing robust growth, driven by factors such as the escalating frequency and severity of cyberattacks, increasing adoption of cloud computing, and the growing need for proactive security measures across various industries. Technological disruptions, such as the rise of AI-powered threat detection and the expansion of IoT devices, are reshaping the market landscape. Consumer preferences are shifting towards integrated and automated solutions that offer comprehensive threat protection and streamlined management. Competitive dynamics are characterized by intense innovation, strategic partnerships, and acquisitions, leading to increased market concentration.
The market is anticipated to register a CAGR of xx% during the forecast period (2025-2033), with market penetration expected to reach xx% by 2033, particularly in the BFSI and IT sectors.
Dominant Regions & Segments in Threat Intelligence Security Services Market
North America currently holds the leading position in the Threat Intelligence Security Services market, driven by factors such as high technological adoption, stringent data security regulations, and a well-established cybersecurity infrastructure. Europe follows closely, with significant growth potential in emerging markets.
- By Deployment Mode: The Cloud segment is the fastest-growing and dominant segment, driven by the increasing adoption of cloud-based services across enterprises.
- By End User: BFSI and IT sectors show the highest adoption and market value due to the sensitivity of their data and infrastructure.
Key Drivers for North America:
- Strong regulatory environment promoting robust cybersecurity measures.
- High technological maturity and early adoption of advanced threat intelligence solutions.
- Large pool of skilled cybersecurity professionals.
Key Drivers for Europe:
- Increasing awareness of cyber threats and growing regulatory pressures (e.g., GDPR).
- Significant investments in cybersecurity infrastructure and technology.
- Expansion of cloud adoption and digital transformation initiatives.
Threat Intelligence Security Services Market Product Innovations
Recent product innovations focus on integrating AI/ML capabilities to enhance threat detection accuracy and automation capabilities to streamline threat response. Solutions are increasingly leveraging Big Data analytics to gain deeper insights into threat actors and attack patterns. Competitive advantages are being established through the development of innovative features such as predictive analytics, automated threat hunting, and seamless integration with existing security infrastructure. These innovations better address the complexities of modern cyber threats and the diverse needs of various end-users.
Report Scope & Segmentation Analysis
This report segments the Threat Intelligence Security Services market by deployment mode (Cloud, On-premise) and end-user (BFSI, Healthcare, IT, Retail, Life Sciences). Each segment is analyzed in terms of its market size, growth rate, and competitive dynamics. Cloud deployment is projected to demonstrate rapid growth, owing to its scalability and cost-effectiveness. The BFSI segment dominates in terms of market value due to its high security requirements and the criticality of financial data. Healthcare and IT sectors also exhibit strong growth potential due to the increasing digitization and interconnectedness of their systems.
Key Drivers of Threat Intelligence Security Services Market Growth
The market's growth is propelled by factors such as the rising number and sophistication of cyberattacks, the expanding adoption of cloud computing and IoT devices, stringent data privacy regulations, and increasing government investments in cybersecurity infrastructure. Furthermore, the growing awareness among organizations about the financial and reputational risks associated with cyber threats fuels demand for robust threat intelligence solutions. Technological advancements in AI, ML, and Big Data analytics enable more effective threat detection and prevention.
Challenges in the Threat Intelligence Security Services Market Sector
Significant challenges include the shortage of skilled cybersecurity professionals, the complexity and cost of implementing threat intelligence solutions, and the evolving nature of cyber threats requiring continuous updates and adaptation. Integration complexities with existing security infrastructure and concerns around data privacy and compliance pose additional hurdles. Competitive pressures among vendors also drive down prices, potentially impacting profitability. These factors could collectively constrain market growth by an estimated xx% by 2033.
Emerging Opportunities in Threat Intelligence Security Services Market
Significant opportunities exist in expanding into emerging markets, particularly in Asia-Pacific and Latin America, with increasing digitalization and growing awareness of cyber threats. The integration of threat intelligence with other security solutions, such as SIEM and SOAR platforms, offers considerable potential. Furthermore, the development of specialized threat intelligence solutions for specific industries, such as healthcare and critical infrastructure, presents substantial opportunities for market expansion.
Leading Players in the Threat Intelligence Security Services Market Market
- F-Secure Corporation
- FireEye Inc
- IBM Corporation
- Fortinet Inc
- McAfee LLC
- Check Point Software Technologies Ltd
- Farsight Security Inc
- Webroot Inc
- Juniper Networks Inc
- Dell Inc
- LogRhythm Inc
- Symantec Corporation
- LookingGlass Cyber Solutions Inc
- AlienVault Inc
Key Developments in Threat Intelligence Security Services Market Industry
- October 2023: Fortinet Inc. announced eight new managed security service providers (MSSPs) – Automation Sensei, CommandLink, Converge ICT Solutions Inc., Evolutio, HCLTech, Proximus, Tigo Business, and TM One – expanding its reach and service offerings, strengthening its position in the market and driving adoption of its Secure SD-WAN solutions.
- June 2023: Check Point Software Technologies Ltd collaborated with TELUS to launch a new Cloud Security Posture Management service, enhancing cloud security capabilities for Canadian organizations and reinforcing the market demand for robust cloud security solutions.
Future Outlook for Threat Intelligence Security Services Market Market
The Threat Intelligence Security Services market is poised for sustained growth, fueled by ongoing digital transformation initiatives, increasing reliance on cloud technologies, and the ever-evolving threat landscape. Opportunities abound in emerging technologies such as AI-driven threat hunting, automation of security operations, and the integration of threat intelligence across various security layers. Strategic partnerships, acquisitions, and the development of innovative solutions will be crucial for maintaining a competitive edge in this dynamic market.
Threat Intelligence Security Services Market Segmentation
-
1. Deployment Mode
- 1.1. Cloud
- 1.2. On-premise
-
2. End User
- 2.1. BFSI
- 2.2. Healthcare
- 2.3. IT
- 2.4. Retail
- 2.5. Life Sciences
Threat Intelligence Security Services Market Segmentation By Geography
-
1. North America
- 1.1. United States
- 1.2. Canada
-
2. Europe
- 2.1. Germany
- 2.2. United Kingdom
- 2.3. France
-
3. Asia
- 3.1. China
- 3.2. Japan
- 3.3. South Korea
- 4. Australia and New Zealand
- 5. Latin America
- 6. Middle East and Africa
Threat Intelligence Security Services Market REPORT HIGHLIGHTS
| Aspects | Details |
|---|---|
| Study Period | 2019-2033 |
| Base Year | 2024 |
| Estimated Year | 2025 |
| Forecast Period | 2025-2033 |
| Historical Period | 2019-2024 |
| Growth Rate | CAGR of 12.47% from 2019-2033 |
| Segmentation |
|
Table of Contents
- 1. Introduction
- 1.1. Research Scope
- 1.2. Market Segmentation
- 1.3. Research Methodology
- 1.4. Definitions and Assumptions
- 2. Executive Summary
- 2.1. Introduction
- 3. Market Dynamics
- 3.1. Introduction
- 3.2. Market Drivers
- 3.2.1. Rapidly Increasing Cyber Security Incidents; Growing M2M/IoT Connections Demands for Strengthened Cyber Security in Enterprises
- 3.3. Market Restrains
- 3.3.1. Lack of Cyber Security Professionals; High Reliance on Traditional Authentication Methods and Low Preparedness
- 3.4. Market Trends
- 3.4.1. Rapidly Increasing Cyber Security Incidents to Drive the Market
- 4. Market Factor Analysis
- 4.1. Porters Five Forces
- 4.2. Supply/Value Chain
- 4.3. PESTEL analysis
- 4.4. Market Entropy
- 4.5. Patent/Trademark Analysis
- 5. Global Threat Intelligence Security Services Market Analysis, Insights and Forecast, 2019-2031
- 5.1. Market Analysis, Insights and Forecast - by Deployment Mode
- 5.1.1. Cloud
- 5.1.2. On-premise
- 5.2. Market Analysis, Insights and Forecast - by End User
- 5.2.1. BFSI
- 5.2.2. Healthcare
- 5.2.3. IT
- 5.2.4. Retail
- 5.2.5. Life Sciences
- 5.3. Market Analysis, Insights and Forecast - by Region
- 5.3.1. North America
- 5.3.2. Europe
- 5.3.3. Asia
- 5.3.4. Australia and New Zealand
- 5.3.5. Latin America
- 5.3.6. Middle East and Africa
- 5.1. Market Analysis, Insights and Forecast - by Deployment Mode
- 6. North America Threat Intelligence Security Services Market Analysis, Insights and Forecast, 2019-2031
- 6.1. Market Analysis, Insights and Forecast - by Deployment Mode
- 6.1.1. Cloud
- 6.1.2. On-premise
- 6.2. Market Analysis, Insights and Forecast - by End User
- 6.2.1. BFSI
- 6.2.2. Healthcare
- 6.2.3. IT
- 6.2.4. Retail
- 6.2.5. Life Sciences
- 6.1. Market Analysis, Insights and Forecast - by Deployment Mode
- 7. Europe Threat Intelligence Security Services Market Analysis, Insights and Forecast, 2019-2031
- 7.1. Market Analysis, Insights and Forecast - by Deployment Mode
- 7.1.1. Cloud
- 7.1.2. On-premise
- 7.2. Market Analysis, Insights and Forecast - by End User
- 7.2.1. BFSI
- 7.2.2. Healthcare
- 7.2.3. IT
- 7.2.4. Retail
- 7.2.5. Life Sciences
- 7.1. Market Analysis, Insights and Forecast - by Deployment Mode
- 8. Asia Threat Intelligence Security Services Market Analysis, Insights and Forecast, 2019-2031
- 8.1. Market Analysis, Insights and Forecast - by Deployment Mode
- 8.1.1. Cloud
- 8.1.2. On-premise
- 8.2. Market Analysis, Insights and Forecast - by End User
- 8.2.1. BFSI
- 8.2.2. Healthcare
- 8.2.3. IT
- 8.2.4. Retail
- 8.2.5. Life Sciences
- 8.1. Market Analysis, Insights and Forecast - by Deployment Mode
- 9. Australia and New Zealand Threat Intelligence Security Services Market Analysis, Insights and Forecast, 2019-2031
- 9.1. Market Analysis, Insights and Forecast - by Deployment Mode
- 9.1.1. Cloud
- 9.1.2. On-premise
- 9.2. Market Analysis, Insights and Forecast - by End User
- 9.2.1. BFSI
- 9.2.2. Healthcare
- 9.2.3. IT
- 9.2.4. Retail
- 9.2.5. Life Sciences
- 9.1. Market Analysis, Insights and Forecast - by Deployment Mode
- 10. Latin America Threat Intelligence Security Services Market Analysis, Insights and Forecast, 2019-2031
- 10.1. Market Analysis, Insights and Forecast - by Deployment Mode
- 10.1.1. Cloud
- 10.1.2. On-premise
- 10.2. Market Analysis, Insights and Forecast - by End User
- 10.2.1. BFSI
- 10.2.2. Healthcare
- 10.2.3. IT
- 10.2.4. Retail
- 10.2.5. Life Sciences
- 10.1. Market Analysis, Insights and Forecast - by Deployment Mode
- 11. Middle East and Africa Threat Intelligence Security Services Market Analysis, Insights and Forecast, 2019-2031
- 11.1. Market Analysis, Insights and Forecast - by Deployment Mode
- 11.1.1. Cloud
- 11.1.2. On-premise
- 11.2. Market Analysis, Insights and Forecast - by End User
- 11.2.1. BFSI
- 11.2.2. Healthcare
- 11.2.3. IT
- 11.2.4. Retail
- 11.2.5. Life Sciences
- 11.1. Market Analysis, Insights and Forecast - by Deployment Mode
- 12. North America Threat Intelligence Security Services Market Analysis, Insights and Forecast, 2019-2031
- 12.1. Market Analysis, Insights and Forecast - By Country/Sub-region
- 12.1.1 United States
- 12.1.2 Canada
- 13. Europe Threat Intelligence Security Services Market Analysis, Insights and Forecast, 2019-2031
- 13.1. Market Analysis, Insights and Forecast - By Country/Sub-region
- 13.1.1 Germany
- 13.1.2 United Kingdom
- 13.1.3 France
- 14. Asia Pacific Threat Intelligence Security Services Market Analysis, Insights and Forecast, 2019-2031
- 14.1. Market Analysis, Insights and Forecast - By Country/Sub-region
- 14.1.1 China
- 14.1.2 Japan
- 14.1.3 South Korea
- 15. Australia and New Zealand Threat Intelligence Security Services Market Analysis, Insights and Forecast, 2019-2031
- 15.1. Market Analysis, Insights and Forecast - By Country/Sub-region
- 15.1.1.
- 16. Latin America Threat Intelligence Security Services Market Analysis, Insights and Forecast, 2019-2031
- 16.1. Market Analysis, Insights and Forecast - By Country/Sub-region
- 16.1.1.
- 17. Middle East and Africa Threat Intelligence Security Services Market Analysis, Insights and Forecast, 2019-2031
- 17.1. Market Analysis, Insights and Forecast - By Country/Sub-region
- 17.1.1.
- 18. Competitive Analysis
- 18.1. Global Market Share Analysis 2024
- 18.2. Company Profiles
- 18.2.1 F-Secure Corporation
- 18.2.1.1. Overview
- 18.2.1.2. Products
- 18.2.1.3. SWOT Analysis
- 18.2.1.4. Recent Developments
- 18.2.1.5. Financials (Based on Availability)
- 18.2.2 FireEye Inc
- 18.2.2.1. Overview
- 18.2.2.2. Products
- 18.2.2.3. SWOT Analysis
- 18.2.2.4. Recent Developments
- 18.2.2.5. Financials (Based on Availability)
- 18.2.3 IBM Corporation
- 18.2.3.1. Overview
- 18.2.3.2. Products
- 18.2.3.3. SWOT Analysis
- 18.2.3.4. Recent Developments
- 18.2.3.5. Financials (Based on Availability)
- 18.2.4 Fortinet Inc
- 18.2.4.1. Overview
- 18.2.4.2. Products
- 18.2.4.3. SWOT Analysis
- 18.2.4.4. Recent Developments
- 18.2.4.5. Financials (Based on Availability)
- 18.2.5 McAfee LLC
- 18.2.5.1. Overview
- 18.2.5.2. Products
- 18.2.5.3. SWOT Analysis
- 18.2.5.4. Recent Developments
- 18.2.5.5. Financials (Based on Availability)
- 18.2.6 Check Point Software Technologies Ltd
- 18.2.6.1. Overview
- 18.2.6.2. Products
- 18.2.6.3. SWOT Analysis
- 18.2.6.4. Recent Developments
- 18.2.6.5. Financials (Based on Availability)
- 18.2.7 Farsight Security Inc
- 18.2.7.1. Overview
- 18.2.7.2. Products
- 18.2.7.3. SWOT Analysis
- 18.2.7.4. Recent Developments
- 18.2.7.5. Financials (Based on Availability)
- 18.2.8 Webroot Inc
- 18.2.8.1. Overview
- 18.2.8.2. Products
- 18.2.8.3. SWOT Analysis
- 18.2.8.4. Recent Developments
- 18.2.8.5. Financials (Based on Availability)
- 18.2.9 Juniper Networks Inc
- 18.2.9.1. Overview
- 18.2.9.2. Products
- 18.2.9.3. SWOT Analysis
- 18.2.9.4. Recent Developments
- 18.2.9.5. Financials (Based on Availability)
- 18.2.10 Dell Inc
- 18.2.10.1. Overview
- 18.2.10.2. Products
- 18.2.10.3. SWOT Analysis
- 18.2.10.4. Recent Developments
- 18.2.10.5. Financials (Based on Availability)
- 18.2.11 LogRhythm Inc
- 18.2.11.1. Overview
- 18.2.11.2. Products
- 18.2.11.3. SWOT Analysis
- 18.2.11.4. Recent Developments
- 18.2.11.5. Financials (Based on Availability)
- 18.2.12 Symantec Corporation
- 18.2.12.1. Overview
- 18.2.12.2. Products
- 18.2.12.3. SWOT Analysis
- 18.2.12.4. Recent Developments
- 18.2.12.5. Financials (Based on Availability)
- 18.2.13 LookingGlass Cyber Solutions Inc
- 18.2.13.1. Overview
- 18.2.13.2. Products
- 18.2.13.3. SWOT Analysis
- 18.2.13.4. Recent Developments
- 18.2.13.5. Financials (Based on Availability)
- 18.2.14 AlienVault Inc
- 18.2.14.1. Overview
- 18.2.14.2. Products
- 18.2.14.3. SWOT Analysis
- 18.2.14.4. Recent Developments
- 18.2.14.5. Financials (Based on Availability)
- 18.2.1 F-Secure Corporation
List of Figures
- Figure 1: Global Threat Intelligence Security Services Market Revenue Breakdown (Million, %) by Region 2024 & 2032
- Figure 2: North America Threat Intelligence Security Services Market Revenue (Million), by Country 2024 & 2032
- Figure 3: North America Threat Intelligence Security Services Market Revenue Share (%), by Country 2024 & 2032
- Figure 4: Europe Threat Intelligence Security Services Market Revenue (Million), by Country 2024 & 2032
- Figure 5: Europe Threat Intelligence Security Services Market Revenue Share (%), by Country 2024 & 2032
- Figure 6: Asia Pacific Threat Intelligence Security Services Market Revenue (Million), by Country 2024 & 2032
- Figure 7: Asia Pacific Threat Intelligence Security Services Market Revenue Share (%), by Country 2024 & 2032
- Figure 8: Australia and New Zealand Threat Intelligence Security Services Market Revenue (Million), by Country 2024 & 2032
- Figure 9: Australia and New Zealand Threat Intelligence Security Services Market Revenue Share (%), by Country 2024 & 2032
- Figure 10: Latin America Threat Intelligence Security Services Market Revenue (Million), by Country 2024 & 2032
- Figure 11: Latin America Threat Intelligence Security Services Market Revenue Share (%), by Country 2024 & 2032
- Figure 12: Middle East and Africa Threat Intelligence Security Services Market Revenue (Million), by Country 2024 & 2032
- Figure 13: Middle East and Africa Threat Intelligence Security Services Market Revenue Share (%), by Country 2024 & 2032
- Figure 14: North America Threat Intelligence Security Services Market Revenue (Million), by Deployment Mode 2024 & 2032
- Figure 15: North America Threat Intelligence Security Services Market Revenue Share (%), by Deployment Mode 2024 & 2032
- Figure 16: North America Threat Intelligence Security Services Market Revenue (Million), by End User 2024 & 2032
- Figure 17: North America Threat Intelligence Security Services Market Revenue Share (%), by End User 2024 & 2032
- Figure 18: North America Threat Intelligence Security Services Market Revenue (Million), by Country 2024 & 2032
- Figure 19: North America Threat Intelligence Security Services Market Revenue Share (%), by Country 2024 & 2032
- Figure 20: Europe Threat Intelligence Security Services Market Revenue (Million), by Deployment Mode 2024 & 2032
- Figure 21: Europe Threat Intelligence Security Services Market Revenue Share (%), by Deployment Mode 2024 & 2032
- Figure 22: Europe Threat Intelligence Security Services Market Revenue (Million), by End User 2024 & 2032
- Figure 23: Europe Threat Intelligence Security Services Market Revenue Share (%), by End User 2024 & 2032
- Figure 24: Europe Threat Intelligence Security Services Market Revenue (Million), by Country 2024 & 2032
- Figure 25: Europe Threat Intelligence Security Services Market Revenue Share (%), by Country 2024 & 2032
- Figure 26: Asia Threat Intelligence Security Services Market Revenue (Million), by Deployment Mode 2024 & 2032
- Figure 27: Asia Threat Intelligence Security Services Market Revenue Share (%), by Deployment Mode 2024 & 2032
- Figure 28: Asia Threat Intelligence Security Services Market Revenue (Million), by End User 2024 & 2032
- Figure 29: Asia Threat Intelligence Security Services Market Revenue Share (%), by End User 2024 & 2032
- Figure 30: Asia Threat Intelligence Security Services Market Revenue (Million), by Country 2024 & 2032
- Figure 31: Asia Threat Intelligence Security Services Market Revenue Share (%), by Country 2024 & 2032
- Figure 32: Australia and New Zealand Threat Intelligence Security Services Market Revenue (Million), by Deployment Mode 2024 & 2032
- Figure 33: Australia and New Zealand Threat Intelligence Security Services Market Revenue Share (%), by Deployment Mode 2024 & 2032
- Figure 34: Australia and New Zealand Threat Intelligence Security Services Market Revenue (Million), by End User 2024 & 2032
- Figure 35: Australia and New Zealand Threat Intelligence Security Services Market Revenue Share (%), by End User 2024 & 2032
- Figure 36: Australia and New Zealand Threat Intelligence Security Services Market Revenue (Million), by Country 2024 & 2032
- Figure 37: Australia and New Zealand Threat Intelligence Security Services Market Revenue Share (%), by Country 2024 & 2032
- Figure 38: Latin America Threat Intelligence Security Services Market Revenue (Million), by Deployment Mode 2024 & 2032
- Figure 39: Latin America Threat Intelligence Security Services Market Revenue Share (%), by Deployment Mode 2024 & 2032
- Figure 40: Latin America Threat Intelligence Security Services Market Revenue (Million), by End User 2024 & 2032
- Figure 41: Latin America Threat Intelligence Security Services Market Revenue Share (%), by End User 2024 & 2032
- Figure 42: Latin America Threat Intelligence Security Services Market Revenue (Million), by Country 2024 & 2032
- Figure 43: Latin America Threat Intelligence Security Services Market Revenue Share (%), by Country 2024 & 2032
- Figure 44: Middle East and Africa Threat Intelligence Security Services Market Revenue (Million), by Deployment Mode 2024 & 2032
- Figure 45: Middle East and Africa Threat Intelligence Security Services Market Revenue Share (%), by Deployment Mode 2024 & 2032
- Figure 46: Middle East and Africa Threat Intelligence Security Services Market Revenue (Million), by End User 2024 & 2032
- Figure 47: Middle East and Africa Threat Intelligence Security Services Market Revenue Share (%), by End User 2024 & 2032
- Figure 48: Middle East and Africa Threat Intelligence Security Services Market Revenue (Million), by Country 2024 & 2032
- Figure 49: Middle East and Africa Threat Intelligence Security Services Market Revenue Share (%), by Country 2024 & 2032
List of Tables
- Table 1: Global Threat Intelligence Security Services Market Revenue Million Forecast, by Region 2019 & 2032
- Table 2: Global Threat Intelligence Security Services Market Revenue Million Forecast, by Deployment Mode 2019 & 2032
- Table 3: Global Threat Intelligence Security Services Market Revenue Million Forecast, by End User 2019 & 2032
- Table 4: Global Threat Intelligence Security Services Market Revenue Million Forecast, by Region 2019 & 2032
- Table 5: Global Threat Intelligence Security Services Market Revenue Million Forecast, by Country 2019 & 2032
- Table 6: United States Threat Intelligence Security Services Market Revenue (Million) Forecast, by Application 2019 & 2032
- Table 7: Canada Threat Intelligence Security Services Market Revenue (Million) Forecast, by Application 2019 & 2032
- Table 8: Global Threat Intelligence Security Services Market Revenue Million Forecast, by Country 2019 & 2032
- Table 9: Germany Threat Intelligence Security Services Market Revenue (Million) Forecast, by Application 2019 & 2032
- Table 10: United Kingdom Threat Intelligence Security Services Market Revenue (Million) Forecast, by Application 2019 & 2032
- Table 11: France Threat Intelligence Security Services Market Revenue (Million) Forecast, by Application 2019 & 2032
- Table 12: Global Threat Intelligence Security Services Market Revenue Million Forecast, by Country 2019 & 2032
- Table 13: China Threat Intelligence Security Services Market Revenue (Million) Forecast, by Application 2019 & 2032
- Table 14: Japan Threat Intelligence Security Services Market Revenue (Million) Forecast, by Application 2019 & 2032
- Table 15: South Korea Threat Intelligence Security Services Market Revenue (Million) Forecast, by Application 2019 & 2032
- Table 16: Global Threat Intelligence Security Services Market Revenue Million Forecast, by Country 2019 & 2032
- Table 17: Threat Intelligence Security Services Market Revenue (Million) Forecast, by Application 2019 & 2032
- Table 18: Global Threat Intelligence Security Services Market Revenue Million Forecast, by Country 2019 & 2032
- Table 19: Threat Intelligence Security Services Market Revenue (Million) Forecast, by Application 2019 & 2032
- Table 20: Global Threat Intelligence Security Services Market Revenue Million Forecast, by Country 2019 & 2032
- Table 21: Threat Intelligence Security Services Market Revenue (Million) Forecast, by Application 2019 & 2032
- Table 22: Global Threat Intelligence Security Services Market Revenue Million Forecast, by Deployment Mode 2019 & 2032
- Table 23: Global Threat Intelligence Security Services Market Revenue Million Forecast, by End User 2019 & 2032
- Table 24: Global Threat Intelligence Security Services Market Revenue Million Forecast, by Country 2019 & 2032
- Table 25: United States Threat Intelligence Security Services Market Revenue (Million) Forecast, by Application 2019 & 2032
- Table 26: Canada Threat Intelligence Security Services Market Revenue (Million) Forecast, by Application 2019 & 2032
- Table 27: Global Threat Intelligence Security Services Market Revenue Million Forecast, by Deployment Mode 2019 & 2032
- Table 28: Global Threat Intelligence Security Services Market Revenue Million Forecast, by End User 2019 & 2032
- Table 29: Global Threat Intelligence Security Services Market Revenue Million Forecast, by Country 2019 & 2032
- Table 30: Germany Threat Intelligence Security Services Market Revenue (Million) Forecast, by Application 2019 & 2032
- Table 31: United Kingdom Threat Intelligence Security Services Market Revenue (Million) Forecast, by Application 2019 & 2032
- Table 32: France Threat Intelligence Security Services Market Revenue (Million) Forecast, by Application 2019 & 2032
- Table 33: Global Threat Intelligence Security Services Market Revenue Million Forecast, by Deployment Mode 2019 & 2032
- Table 34: Global Threat Intelligence Security Services Market Revenue Million Forecast, by End User 2019 & 2032
- Table 35: Global Threat Intelligence Security Services Market Revenue Million Forecast, by Country 2019 & 2032
- Table 36: China Threat Intelligence Security Services Market Revenue (Million) Forecast, by Application 2019 & 2032
- Table 37: Japan Threat Intelligence Security Services Market Revenue (Million) Forecast, by Application 2019 & 2032
- Table 38: South Korea Threat Intelligence Security Services Market Revenue (Million) Forecast, by Application 2019 & 2032
- Table 39: Global Threat Intelligence Security Services Market Revenue Million Forecast, by Deployment Mode 2019 & 2032
- Table 40: Global Threat Intelligence Security Services Market Revenue Million Forecast, by End User 2019 & 2032
- Table 41: Global Threat Intelligence Security Services Market Revenue Million Forecast, by Country 2019 & 2032
- Table 42: Global Threat Intelligence Security Services Market Revenue Million Forecast, by Deployment Mode 2019 & 2032
- Table 43: Global Threat Intelligence Security Services Market Revenue Million Forecast, by End User 2019 & 2032
- Table 44: Global Threat Intelligence Security Services Market Revenue Million Forecast, by Country 2019 & 2032
- Table 45: Global Threat Intelligence Security Services Market Revenue Million Forecast, by Deployment Mode 2019 & 2032
- Table 46: Global Threat Intelligence Security Services Market Revenue Million Forecast, by End User 2019 & 2032
- Table 47: Global Threat Intelligence Security Services Market Revenue Million Forecast, by Country 2019 & 2032
Frequently Asked Questions
1. What is the projected Compound Annual Growth Rate (CAGR) of the Threat Intelligence Security Services Market?
The projected CAGR is approximately 12.47%.
2. Which companies are prominent players in the Threat Intelligence Security Services Market?
Key companies in the market include F-Secure Corporation, FireEye Inc, IBM Corporation, Fortinet Inc, McAfee LLC, Check Point Software Technologies Ltd, Farsight Security Inc, Webroot Inc, Juniper Networks Inc, Dell Inc, LogRhythm Inc, Symantec Corporation, LookingGlass Cyber Solutions Inc, AlienVault Inc.
3. What are the main segments of the Threat Intelligence Security Services Market?
The market segments include Deployment Mode, End User.
4. Can you provide details about the market size?
The market size is estimated to be USD 2.91 Million as of 2022.
5. What are some drivers contributing to market growth?
Rapidly Increasing Cyber Security Incidents; Growing M2M/IoT Connections Demands for Strengthened Cyber Security in Enterprises.
6. What are the notable trends driving market growth?
Rapidly Increasing Cyber Security Incidents to Drive the Market.
7. Are there any restraints impacting market growth?
Lack of Cyber Security Professionals; High Reliance on Traditional Authentication Methods and Low Preparedness.
8. Can you provide examples of recent developments in the market?
October 2023: Fortinet Inc. announced eight new managed security service providers (MSSPs) to deliver new value-added managed services to its customers. Automation Sensei, CommandLink, Converge ICT Solutions Inc., Evolutio, HCLTech, Proximus, Tigo Business, and TM One joined a growing list of global services which provides Fortinet Secure SD-WAN as the foundation for new and differentiated secure networking services. MSSPs continue to adopt Fortinet Secure Networking solutions to drive better business outcomes and manage complex hybrid network environments for their enterprise customers without compromising on security.
9. What pricing options are available for accessing the report?
Pricing options include single-user, multi-user, and enterprise licenses priced at USD 4750, USD 5250, and USD 8750 respectively.
10. Is the market size provided in terms of value or volume?
The market size is provided in terms of value, measured in Million.
11. Are there any specific market keywords associated with the report?
Yes, the market keyword associated with the report is "Threat Intelligence Security Services Market," which aids in identifying and referencing the specific market segment covered.
12. How do I determine which pricing option suits my needs best?
The pricing options vary based on user requirements and access needs. Individual users may opt for single-user licenses, while businesses requiring broader access may choose multi-user or enterprise licenses for cost-effective access to the report.
13. Are there any additional resources or data provided in the Threat Intelligence Security Services Market report?
While the report offers comprehensive insights, it's advisable to review the specific contents or supplementary materials provided to ascertain if additional resources or data are available.
14. How can I stay updated on further developments or reports in the Threat Intelligence Security Services Market?
To stay informed about further developments, trends, and reports in the Threat Intelligence Security Services Market, consider subscribing to industry newsletters, following relevant companies and organizations, or regularly checking reputable industry news sources and publications.
Methodology
Step 1 - Identification of Relevant Samples Size from Population Database


Step 2 - Approaches for Defining Global Market Size (Value, Volume* & Price*)

Note*: In applicable scenarios
Step 3 - Data Sources
Primary Research
- Web Analytics
- Survey Reports
- Research Institute
- Latest Research Reports
- Opinion Leaders
Secondary Research
- Annual Reports
- White Paper
- Latest Press Release
- Industry Association
- Paid Database
- Investor Presentations

Step 4 - Data Triangulation
Involves using different sources of information in order to increase the validity of a study
These sources are likely to be stakeholders in a program - participants, other researchers, program staff, other community members, and so on.
Then we put all data in single framework & apply various statistical tools to find out the dynamic on the market.
During the analysis stage, feedback from the stakeholder groups would be compared to determine areas of agreement as well as areas of divergence


