
Key Insights
The global Tramway market is experiencing robust growth, projected to reach a significant market size by 2033. This expansion is propelled by a confluence of factors, including the escalating demand for sustainable and efficient public transportation solutions in urban environments. Governments worldwide are increasingly investing in modernizing their public transport infrastructure, with tramways emerging as a favored choice due to their lower carbon footprint, reduced noise pollution, and ability to carry substantial passenger volumes compared to other modes. The increasing urbanization and the associated challenges of traffic congestion and air pollution are directly fueling the adoption of tramway systems. Key drivers include government initiatives promoting green transportation, technological advancements in tramway design and energy efficiency, and a growing public preference for eco-friendly commuting options. Furthermore, the development of smart city concepts, which emphasize integrated and sustainable mobility, further bolsters the market's upward trajectory. Emerging economies are also playing a crucial role, with significant infrastructure development plans that often include modern tramway networks to improve urban connectivity and quality of life.
The market is segmented across various applications and types, highlighting the diverse needs and operational environments of tramway systems. Applications such as suburban routes, bustling commercial streets, and scenic tourist spots all present unique requirements that drive innovation in tramway design and functionality. The type segmentation, including Catenary Powered Type, Ground Powered Type, and Energy Storage Type, showcases the technological evolution aimed at improving operational flexibility, reducing visual impact, and enhancing energy efficiency. Ground-powered and energy storage types, for instance, offer solutions for historical city centers or areas where overhead catenary infrastructure is undesirable. While the market presents immense opportunities, restraints such as high initial capital investment for infrastructure development and potential challenges in integrating new tramway lines with existing urban layouts need to be addressed. However, the long-term benefits in terms of environmental sustainability, reduced operational costs, and enhanced urban mobility are expected to outweigh these initial hurdles, ensuring sustained market expansion. Leading companies are actively engaged in research and development to offer advanced, cost-effective, and aesthetically pleasing tramway solutions to meet the evolving demands of global cities.
Tramway Market Insights Report: Navigating Future Mobility
This comprehensive report offers an in-depth analysis of the global tramway market, forecasting significant growth and outlining key trends from 2019 to 2033. With a base year of 2025, the study delves into market structure, dynamics, regional dominance, product innovations, and critical growth drivers. Leveraging high-ranking keywords like "tramway market," "urban transportation," "light rail," and "sustainable mobility," this report is designed for industry professionals seeking actionable intelligence to inform strategic decisions.
Tramway Market Structure & Innovation Trends
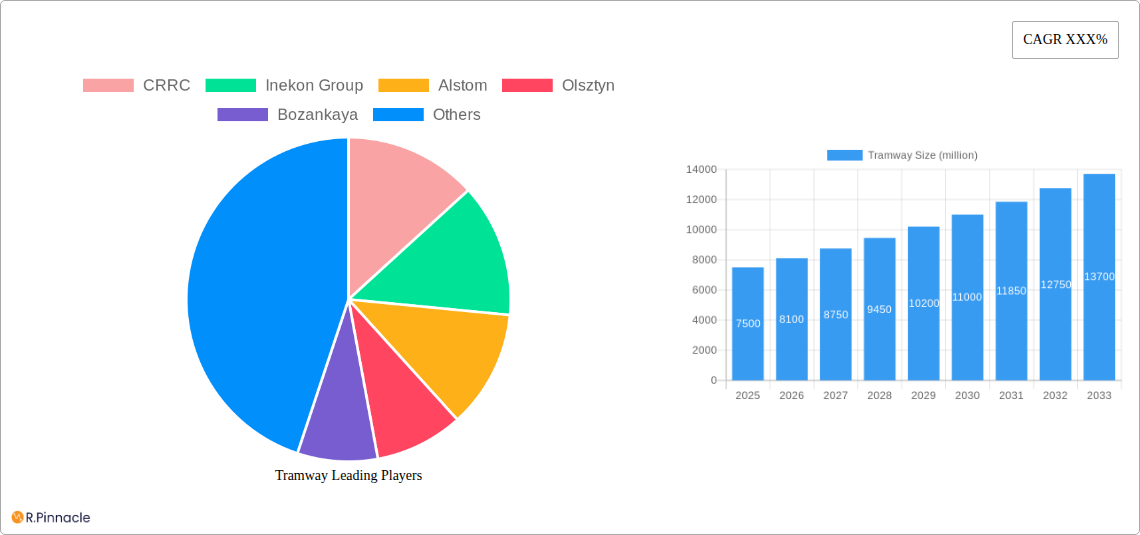
The global tramway market exhibits a dynamic structure, characterized by a mix of established global players and emerging regional manufacturers. Market concentration is moderate, with key companies like CRRC, Alstom, and Stadler Rail Group holding significant market shares in different geographies. Innovation remains a primary driver, with a continuous focus on enhancing energy efficiency, passenger comfort, and operational reliability. Regulatory frameworks play a crucial role, often dictating design standards, safety protocols, and integration with existing urban infrastructure. The development of advanced energy storage solutions and ground-powered technologies is mitigating reliance on traditional catenary systems, expanding application possibilities. Product substitutes, while present in the form of buses and metro systems, are increasingly being challenged by the unique advantages of modern trams in dense urban environments. End-user demographics are shifting towards sustainability-conscious urban populations demanding efficient, eco-friendly public transport. Mergers and acquisition (M&A) activities, with estimated deal values reaching xx million, are a recurring theme, as larger entities seek to consolidate their market position and acquire innovative technologies.
Tramway Market Dynamics & Trends
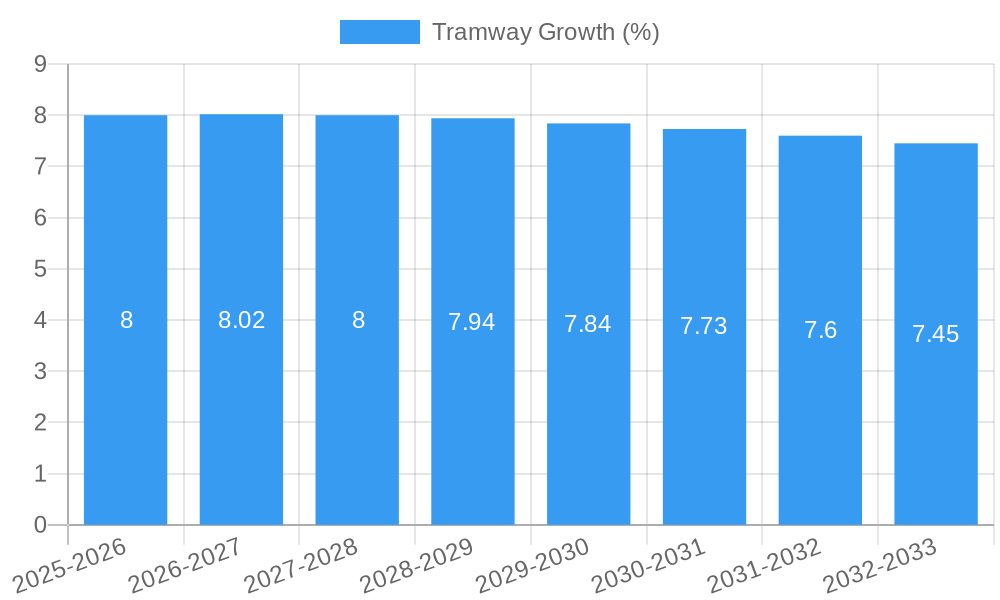
The tramway market is experiencing robust growth, propelled by an increasing global demand for sustainable and efficient urban transportation solutions. The market is projected to grow at a Compound Annual Growth Rate (CAGR) of approximately xx% between 2025 and 2033. This expansion is significantly influenced by urbanization trends, with cities worldwide investing heavily in modernizing and expanding their light rail networks. Technological disruptions are at the forefront of this evolution, including advancements in battery technology for energy storage type trams, autonomous driving capabilities for enhanced operational flexibility, and smart city integration for seamless passenger experience. Consumer preferences are increasingly favoring trams due to their lower environmental impact compared to traditional vehicles, reduced traffic congestion benefits, and the pleasant urban experience they offer. Competitive dynamics are intensifying, with companies constantly innovating to offer cost-effective, energy-efficient, and passenger-centric solutions. Market penetration is steadily increasing in both developed and developing economies, as governments recognize the long-term economic and environmental benefits of investing in tramway infrastructure. The focus is shifting towards integrated public transport systems where trams play a pivotal role in connecting suburban areas with commercial hubs and scenic spots, thereby increasing overall mobility. The development of quieter and more aesthetically pleasing tram designs is also contributing to higher public acceptance and ridership.
Dominant Regions & Segments in Tramway
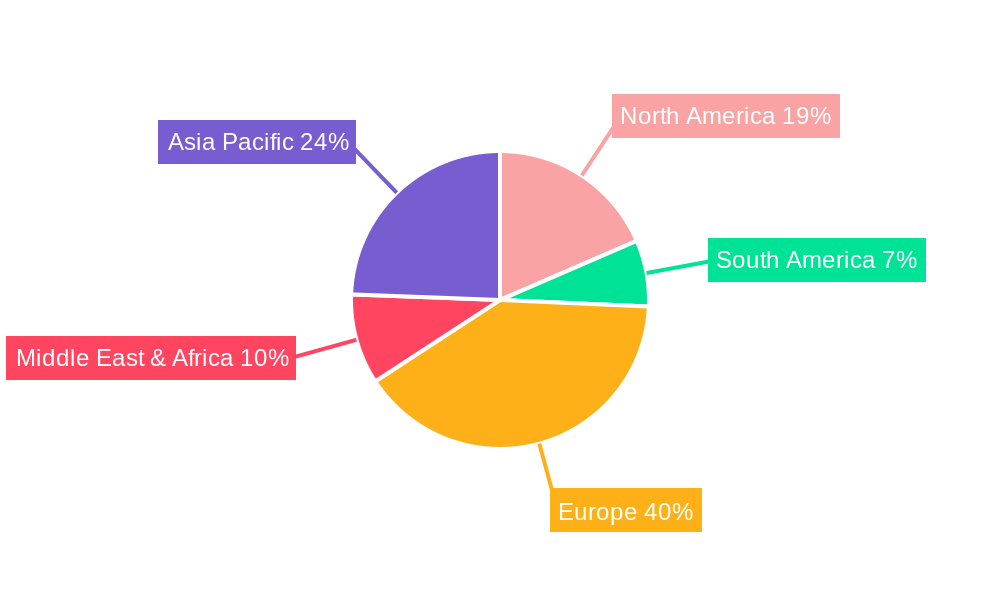
Europe currently stands as the dominant region in the global tramway market, driven by strong governmental support for sustainable urban mobility, substantial investments in infrastructure upgrades, and a long-standing tradition of light rail systems. Countries like Germany, France, and the UK are at the forefront of this dominance, with ongoing projects and fleet modernizations.
- Application: Commercial Street dominance is a key trend. Cities are increasingly deploying trams in commercial districts to alleviate traffic congestion, improve air quality, and enhance the pedestrian experience. This segment benefits from the inherent ability of trams to move large passenger volumes efficiently through bustling urban cores.
- Application: Suburbs are also witnessing significant growth. As urban sprawl continues, trams are becoming an essential mode of connecting suburban communities to central business districts, offering a sustainable alternative to private vehicle dependency.
- Type: Catenary Powered Type remains the most prevalent, supported by established infrastructure and a proven track record. However, there's a notable shift towards other types.
- Type: Ground Powered Type and Type: Energy Storage Type are emerging as critical growth areas. These technologies offer greater aesthetic flexibility by reducing overhead wires, making them ideal for historical districts and scenic spots. The increasing efficiency and capacity of batteries are making these solutions more viable for extensive routes.
Economic policies supporting public transport, such as subsidies and urban planning initiatives, are major drivers. Infrastructure development, including dedicated tram lines and integration with other transport modes, further solidifies the dominance of certain regions and segments. The commitment to decarbonization goals and the desire to create more livable urban environments are also powerful catalysts for tramway adoption across these key areas.
Tramway Product Innovations
Recent tramway product innovations are centered around enhancing energy efficiency, passenger experience, and operational flexibility. Companies are developing lighter, more aerodynamic designs to reduce energy consumption. Advancements in battery technology are leading to the proliferation of energy storage type trams, enabling catenary-free operation in sensitive urban areas and scenic spots. Ground-powered systems are also gaining traction, offering similar benefits. Smart onboard technologies, including real-time passenger information systems and advanced climate control, are becoming standard, improving commuter comfort. These innovations offer significant competitive advantages by addressing growing demands for sustainable, aesthetically pleasing, and integrated urban transit solutions, aligning with the future vision of smart cities.
Report Scope & Segmentation Analysis
This report meticulously segments the global tramway market. The Application segmentation includes Suburbs, Commercial Street, Scenic Spot, and Others, each representing distinct deployment strategies and user demands. The Type segmentation covers Catenary Powered Type, Ground Powered Type, and Energy Storage Type, reflecting the evolving technological landscape. For instance, the Commercial Street application is projected to experience a market size of xx million by 2033, driven by urban congestion solutions. Similarly, Energy Storage Type trams, while currently holding a smaller market share, are anticipated to exhibit a CAGR of xx% due to advancements in battery technology and urban aesthetic considerations. Competitive dynamics vary across these segments, with manufacturers tailoring their offerings to specific deployment requirements and technological preferences.
Key Drivers of Tramway Growth
The tramway sector is experiencing accelerated growth driven by a confluence of potent factors. Urbanization remains a primary catalyst, with cities worldwide grappling with increased population density and the resultant strain on transportation infrastructure. Governments are actively promoting sustainable mobility initiatives, recognizing trams as a key solution for reducing carbon emissions and improving air quality within urban centers. Technological advancements, particularly in energy efficiency, battery technology for energy storage type trams, and signaling systems, are making tramways more cost-effective and adaptable. Economic policies favoring public transport investment, coupled with the long-term cost savings associated with efficient light rail systems, further bolster growth.
Challenges in the Tramway Sector
Despite its promising outlook, the tramway sector faces several challenges. The significant upfront capital investment required for infrastructure development and fleet acquisition remains a major barrier for many municipalities. Navigating complex and often varying regulatory frameworks across different regions can lead to delays and increased project costs. Supply chain disruptions, particularly for specialized components, can impact project timelines and budgets. Furthermore, competition from other urban transport modes, including advanced bus rapid transit (BRT) systems and metro expansion, presents a constant challenge. The integration of new technologies into existing, sometimes aging, infrastructure also poses technical hurdles and necessitates substantial upgrades.
Emerging Opportunities in Tramway
The tramway market is ripe with emerging opportunities, driven by evolving urban landscapes and technological advancements. The growing demand for integrated public transportation systems presents a significant opportunity for tramways to act as crucial connectors within smart city ecosystems. The development and adoption of catenary-free technologies, such as ground-powered and energy storage type trams, are opening up new deployment possibilities in historically sensitive areas and scenic spots where traditional overhead wires are undesirable. Furthermore, the increasing focus on sustainable development and the circular economy is creating demand for eco-friendly manufacturing processes and recyclable materials in tram production. The expansion of tram networks into developing economies, as they prioritize urban development and sustainable mobility solutions, represents a substantial untapped market.
Leading Players in the Tramway Market
- CRRC
- Inekon Group
- Alstom
- Olsztyn
- Bozankaya
- Astra Vagoane Călători
- Stadler Rail Group
- Delachaux Group
- Bombardier
- Trowin Industries
Key Developments in Tramway Industry
- 2023/09: Alstom launched its new generation of Citadis trams in France, focusing on increased energy efficiency and passenger comfort.
- 2023/11: CRRC secured a major order for new trams in Southeast Asia, signaling its expanding global reach.
- 2024/01: Stadler Rail Group announced a significant contract for low-floor trams in a European city, emphasizing modular design.
- 2024/03: The Delachaux Group's subsidiary, Conductix-Wampfler, showcased advancements in ground-level power supply systems for trams.
- 2024/05: Bozankaya unveiled its innovative energy storage type tram, designed for catenary-free operation in urban cores.
Future Outlook for Tramway Market
The future outlook for the tramway market is exceptionally bright, poised for sustained growth driven by the global imperative for sustainable urban mobility. The increasing adoption of energy storage type and ground powered type trams will unlock new deployment avenues and enhance aesthetic integration within cities. Continued technological advancements in automation, connectivity, and passenger experience will further solidify trams as a preferred mode of urban transport. Strategic investments in expanding existing networks and developing new light rail systems in emerging economies present significant growth accelerators. The market is expected to witness substantial expansion, driven by governmental support, urban planning initiatives, and a growing public preference for eco-friendly and efficient transportation solutions, promising a future where trams play an even more central role in global urban landscapes.
Tramway Segmentation
-
1. Application
- 1.1. Suburbs
- 1.2. Commercial Street
- 1.3. Scenic Spot
- 1.4. Others
-
2. Type
- 2.1. Catenary Powered Type
- 2.2. Ground Powered Type
- 2.3. Energy Storage Type
Tramway Segmentation By Geography
-
1. North America
- 1.1. United States
- 1.2. Canada
- 1.3. Mexico
-
2. South America
- 2.1. Brazil
- 2.2. Argentina
- 2.3. Rest of South America
-
3. Europe
- 3.1. United Kingdom
- 3.2. Germany
- 3.3. France
- 3.4. Italy
- 3.5. Spain
- 3.6. Russia
- 3.7. Benelux
- 3.8. Nordics
- 3.9. Rest of Europe
-
4. Middle East & Africa
- 4.1. Turkey
- 4.2. Israel
- 4.3. GCC
- 4.4. North Africa
- 4.5. South Africa
- 4.6. Rest of Middle East & Africa
-
5. Asia Pacific
- 5.1. China
- 5.2. India
- 5.3. Japan
- 5.4. South Korea
- 5.5. ASEAN
- 5.6. Oceania
- 5.7. Rest of Asia Pacific
Tramway REPORT HIGHLIGHTS
| Aspects | Details |
|---|---|
| Study Period | 2019-2033 |
| Base Year | 2024 |
| Estimated Year | 2025 |
| Forecast Period | 2025-2033 |
| Historical Period | 2019-2024 |
| Growth Rate | CAGR of XXX% from 2019-2033 |
| Segmentation |
|
Table of Contents
- 1. Introduction
- 1.1. Research Scope
- 1.2. Market Segmentation
- 1.3. Research Methodology
- 1.4. Definitions and Assumptions
- 2. Executive Summary
- 2.1. Introduction
- 3. Market Dynamics
- 3.1. Introduction
- 3.2. Market Drivers
- 3.3. Market Restrains
- 3.4. Market Trends
- 4. Market Factor Analysis
- 4.1. Porters Five Forces
- 4.2. Supply/Value Chain
- 4.3. PESTEL analysis
- 4.4. Market Entropy
- 4.5. Patent/Trademark Analysis
- 5. Global Tramway Analysis, Insights and Forecast, 2019-2031
- 5.1. Market Analysis, Insights and Forecast - by Application
- 5.1.1. Suburbs
- 5.1.2. Commercial Street
- 5.1.3. Scenic Spot
- 5.1.4. Others
- 5.2. Market Analysis, Insights and Forecast - by Type
- 5.2.1. Catenary Powered Type
- 5.2.2. Ground Powered Type
- 5.2.3. Energy Storage Type
- 5.3. Market Analysis, Insights and Forecast - by Region
- 5.3.1. North America
- 5.3.2. South America
- 5.3.3. Europe
- 5.3.4. Middle East & Africa
- 5.3.5. Asia Pacific
- 5.1. Market Analysis, Insights and Forecast - by Application
- 6. North America Tramway Analysis, Insights and Forecast, 2019-2031
- 6.1. Market Analysis, Insights and Forecast - by Application
- 6.1.1. Suburbs
- 6.1.2. Commercial Street
- 6.1.3. Scenic Spot
- 6.1.4. Others
- 6.2. Market Analysis, Insights and Forecast - by Type
- 6.2.1. Catenary Powered Type
- 6.2.2. Ground Powered Type
- 6.2.3. Energy Storage Type
- 6.1. Market Analysis, Insights and Forecast - by Application
- 7. South America Tramway Analysis, Insights and Forecast, 2019-2031
- 7.1. Market Analysis, Insights and Forecast - by Application
- 7.1.1. Suburbs
- 7.1.2. Commercial Street
- 7.1.3. Scenic Spot
- 7.1.4. Others
- 7.2. Market Analysis, Insights and Forecast - by Type
- 7.2.1. Catenary Powered Type
- 7.2.2. Ground Powered Type
- 7.2.3. Energy Storage Type
- 7.1. Market Analysis, Insights and Forecast - by Application
- 8. Europe Tramway Analysis, Insights and Forecast, 2019-2031
- 8.1. Market Analysis, Insights and Forecast - by Application
- 8.1.1. Suburbs
- 8.1.2. Commercial Street
- 8.1.3. Scenic Spot
- 8.1.4. Others
- 8.2. Market Analysis, Insights and Forecast - by Type
- 8.2.1. Catenary Powered Type
- 8.2.2. Ground Powered Type
- 8.2.3. Energy Storage Type
- 8.1. Market Analysis, Insights and Forecast - by Application
- 9. Middle East & Africa Tramway Analysis, Insights and Forecast, 2019-2031
- 9.1. Market Analysis, Insights and Forecast - by Application
- 9.1.1. Suburbs
- 9.1.2. Commercial Street
- 9.1.3. Scenic Spot
- 9.1.4. Others
- 9.2. Market Analysis, Insights and Forecast - by Type
- 9.2.1. Catenary Powered Type
- 9.2.2. Ground Powered Type
- 9.2.3. Energy Storage Type
- 9.1. Market Analysis, Insights and Forecast - by Application
- 10. Asia Pacific Tramway Analysis, Insights and Forecast, 2019-2031
- 10.1. Market Analysis, Insights and Forecast - by Application
- 10.1.1. Suburbs
- 10.1.2. Commercial Street
- 10.1.3. Scenic Spot
- 10.1.4. Others
- 10.2. Market Analysis, Insights and Forecast - by Type
- 10.2.1. Catenary Powered Type
- 10.2.2. Ground Powered Type
- 10.2.3. Energy Storage Type
- 10.1. Market Analysis, Insights and Forecast - by Application
- 11. Competitive Analysis
- 11.1. Global Market Share Analysis 2024
- 11.2. Company Profiles
- 11.2.1 CRRC
- 11.2.1.1. Overview
- 11.2.1.2. Products
- 11.2.1.3. SWOT Analysis
- 11.2.1.4. Recent Developments
- 11.2.1.5. Financials (Based on Availability)
- 11.2.2 Inekon Group
- 11.2.2.1. Overview
- 11.2.2.2. Products
- 11.2.2.3. SWOT Analysis
- 11.2.2.4. Recent Developments
- 11.2.2.5. Financials (Based on Availability)
- 11.2.3 Alstom
- 11.2.3.1. Overview
- 11.2.3.2. Products
- 11.2.3.3. SWOT Analysis
- 11.2.3.4. Recent Developments
- 11.2.3.5. Financials (Based on Availability)
- 11.2.4 Olsztyn
- 11.2.4.1. Overview
- 11.2.4.2. Products
- 11.2.4.3. SWOT Analysis
- 11.2.4.4. Recent Developments
- 11.2.4.5. Financials (Based on Availability)
- 11.2.5 Bozankaya
- 11.2.5.1. Overview
- 11.2.5.2. Products
- 11.2.5.3. SWOT Analysis
- 11.2.5.4. Recent Developments
- 11.2.5.5. Financials (Based on Availability)
- 11.2.6 Astra Vagoane Călători
- 11.2.6.1. Overview
- 11.2.6.2. Products
- 11.2.6.3. SWOT Analysis
- 11.2.6.4. Recent Developments
- 11.2.6.5. Financials (Based on Availability)
- 11.2.7 Stadler Rail Group
- 11.2.7.1. Overview
- 11.2.7.2. Products
- 11.2.7.3. SWOT Analysis
- 11.2.7.4. Recent Developments
- 11.2.7.5. Financials (Based on Availability)
- 11.2.8 Delachaux Group
- 11.2.8.1. Overview
- 11.2.8.2. Products
- 11.2.8.3. SWOT Analysis
- 11.2.8.4. Recent Developments
- 11.2.8.5. Financials (Based on Availability)
- 11.2.9 Bombardier
- 11.2.9.1. Overview
- 11.2.9.2. Products
- 11.2.9.3. SWOT Analysis
- 11.2.9.4. Recent Developments
- 11.2.9.5. Financials (Based on Availability)
- 11.2.10 Trowin Industries
- 11.2.10.1. Overview
- 11.2.10.2. Products
- 11.2.10.3. SWOT Analysis
- 11.2.10.4. Recent Developments
- 11.2.10.5. Financials (Based on Availability)
- 11.2.1 CRRC
List of Figures
- Figure 1: Global Tramway Revenue Breakdown (million, %) by Region 2024 & 2032
- Figure 2: Global Tramway Volume Breakdown (K, %) by Region 2024 & 2032
- Figure 3: North America Tramway Revenue (million), by Application 2024 & 2032
- Figure 4: North America Tramway Volume (K), by Application 2024 & 2032
- Figure 5: North America Tramway Revenue Share (%), by Application 2024 & 2032
- Figure 6: North America Tramway Volume Share (%), by Application 2024 & 2032
- Figure 7: North America Tramway Revenue (million), by Type 2024 & 2032
- Figure 8: North America Tramway Volume (K), by Type 2024 & 2032
- Figure 9: North America Tramway Revenue Share (%), by Type 2024 & 2032
- Figure 10: North America Tramway Volume Share (%), by Type 2024 & 2032
- Figure 11: North America Tramway Revenue (million), by Country 2024 & 2032
- Figure 12: North America Tramway Volume (K), by Country 2024 & 2032
- Figure 13: North America Tramway Revenue Share (%), by Country 2024 & 2032
- Figure 14: North America Tramway Volume Share (%), by Country 2024 & 2032
- Figure 15: South America Tramway Revenue (million), by Application 2024 & 2032
- Figure 16: South America Tramway Volume (K), by Application 2024 & 2032
- Figure 17: South America Tramway Revenue Share (%), by Application 2024 & 2032
- Figure 18: South America Tramway Volume Share (%), by Application 2024 & 2032
- Figure 19: South America Tramway Revenue (million), by Type 2024 & 2032
- Figure 20: South America Tramway Volume (K), by Type 2024 & 2032
- Figure 21: South America Tramway Revenue Share (%), by Type 2024 & 2032
- Figure 22: South America Tramway Volume Share (%), by Type 2024 & 2032
- Figure 23: South America Tramway Revenue (million), by Country 2024 & 2032
- Figure 24: South America Tramway Volume (K), by Country 2024 & 2032
- Figure 25: South America Tramway Revenue Share (%), by Country 2024 & 2032
- Figure 26: South America Tramway Volume Share (%), by Country 2024 & 2032
- Figure 27: Europe Tramway Revenue (million), by Application 2024 & 2032
- Figure 28: Europe Tramway Volume (K), by Application 2024 & 2032
- Figure 29: Europe Tramway Revenue Share (%), by Application 2024 & 2032
- Figure 30: Europe Tramway Volume Share (%), by Application 2024 & 2032
- Figure 31: Europe Tramway Revenue (million), by Type 2024 & 2032
- Figure 32: Europe Tramway Volume (K), by Type 2024 & 2032
- Figure 33: Europe Tramway Revenue Share (%), by Type 2024 & 2032
- Figure 34: Europe Tramway Volume Share (%), by Type 2024 & 2032
- Figure 35: Europe Tramway Revenue (million), by Country 2024 & 2032
- Figure 36: Europe Tramway Volume (K), by Country 2024 & 2032
- Figure 37: Europe Tramway Revenue Share (%), by Country 2024 & 2032
- Figure 38: Europe Tramway Volume Share (%), by Country 2024 & 2032
- Figure 39: Middle East & Africa Tramway Revenue (million), by Application 2024 & 2032
- Figure 40: Middle East & Africa Tramway Volume (K), by Application 2024 & 2032
- Figure 41: Middle East & Africa Tramway Revenue Share (%), by Application 2024 & 2032
- Figure 42: Middle East & Africa Tramway Volume Share (%), by Application 2024 & 2032
- Figure 43: Middle East & Africa Tramway Revenue (million), by Type 2024 & 2032
- Figure 44: Middle East & Africa Tramway Volume (K), by Type 2024 & 2032
- Figure 45: Middle East & Africa Tramway Revenue Share (%), by Type 2024 & 2032
- Figure 46: Middle East & Africa Tramway Volume Share (%), by Type 2024 & 2032
- Figure 47: Middle East & Africa Tramway Revenue (million), by Country 2024 & 2032
- Figure 48: Middle East & Africa Tramway Volume (K), by Country 2024 & 2032
- Figure 49: Middle East & Africa Tramway Revenue Share (%), by Country 2024 & 2032
- Figure 50: Middle East & Africa Tramway Volume Share (%), by Country 2024 & 2032
- Figure 51: Asia Pacific Tramway Revenue (million), by Application 2024 & 2032
- Figure 52: Asia Pacific Tramway Volume (K), by Application 2024 & 2032
- Figure 53: Asia Pacific Tramway Revenue Share (%), by Application 2024 & 2032
- Figure 54: Asia Pacific Tramway Volume Share (%), by Application 2024 & 2032
- Figure 55: Asia Pacific Tramway Revenue (million), by Type 2024 & 2032
- Figure 56: Asia Pacific Tramway Volume (K), by Type 2024 & 2032
- Figure 57: Asia Pacific Tramway Revenue Share (%), by Type 2024 & 2032
- Figure 58: Asia Pacific Tramway Volume Share (%), by Type 2024 & 2032
- Figure 59: Asia Pacific Tramway Revenue (million), by Country 2024 & 2032
- Figure 60: Asia Pacific Tramway Volume (K), by Country 2024 & 2032
- Figure 61: Asia Pacific Tramway Revenue Share (%), by Country 2024 & 2032
- Figure 62: Asia Pacific Tramway Volume Share (%), by Country 2024 & 2032
List of Tables
- Table 1: Global Tramway Revenue million Forecast, by Region 2019 & 2032
- Table 2: Global Tramway Volume K Forecast, by Region 2019 & 2032
- Table 3: Global Tramway Revenue million Forecast, by Application 2019 & 2032
- Table 4: Global Tramway Volume K Forecast, by Application 2019 & 2032
- Table 5: Global Tramway Revenue million Forecast, by Type 2019 & 2032
- Table 6: Global Tramway Volume K Forecast, by Type 2019 & 2032
- Table 7: Global Tramway Revenue million Forecast, by Region 2019 & 2032
- Table 8: Global Tramway Volume K Forecast, by Region 2019 & 2032
- Table 9: Global Tramway Revenue million Forecast, by Application 2019 & 2032
- Table 10: Global Tramway Volume K Forecast, by Application 2019 & 2032
- Table 11: Global Tramway Revenue million Forecast, by Type 2019 & 2032
- Table 12: Global Tramway Volume K Forecast, by Type 2019 & 2032
- Table 13: Global Tramway Revenue million Forecast, by Country 2019 & 2032
- Table 14: Global Tramway Volume K Forecast, by Country 2019 & 2032
- Table 15: United States Tramway Revenue (million) Forecast, by Application 2019 & 2032
- Table 16: United States Tramway Volume (K) Forecast, by Application 2019 & 2032
- Table 17: Canada Tramway Revenue (million) Forecast, by Application 2019 & 2032
- Table 18: Canada Tramway Volume (K) Forecast, by Application 2019 & 2032
- Table 19: Mexico Tramway Revenue (million) Forecast, by Application 2019 & 2032
- Table 20: Mexico Tramway Volume (K) Forecast, by Application 2019 & 2032
- Table 21: Global Tramway Revenue million Forecast, by Application 2019 & 2032
- Table 22: Global Tramway Volume K Forecast, by Application 2019 & 2032
- Table 23: Global Tramway Revenue million Forecast, by Type 2019 & 2032
- Table 24: Global Tramway Volume K Forecast, by Type 2019 & 2032
- Table 25: Global Tramway Revenue million Forecast, by Country 2019 & 2032
- Table 26: Global Tramway Volume K Forecast, by Country 2019 & 2032
- Table 27: Brazil Tramway Revenue (million) Forecast, by Application 2019 & 2032
- Table 28: Brazil Tramway Volume (K) Forecast, by Application 2019 & 2032
- Table 29: Argentina Tramway Revenue (million) Forecast, by Application 2019 & 2032
- Table 30: Argentina Tramway Volume (K) Forecast, by Application 2019 & 2032
- Table 31: Rest of South America Tramway Revenue (million) Forecast, by Application 2019 & 2032
- Table 32: Rest of South America Tramway Volume (K) Forecast, by Application 2019 & 2032
- Table 33: Global Tramway Revenue million Forecast, by Application 2019 & 2032
- Table 34: Global Tramway Volume K Forecast, by Application 2019 & 2032
- Table 35: Global Tramway Revenue million Forecast, by Type 2019 & 2032
- Table 36: Global Tramway Volume K Forecast, by Type 2019 & 2032
- Table 37: Global Tramway Revenue million Forecast, by Country 2019 & 2032
- Table 38: Global Tramway Volume K Forecast, by Country 2019 & 2032
- Table 39: United Kingdom Tramway Revenue (million) Forecast, by Application 2019 & 2032
- Table 40: United Kingdom Tramway Volume (K) Forecast, by Application 2019 & 2032
- Table 41: Germany Tramway Revenue (million) Forecast, by Application 2019 & 2032
- Table 42: Germany Tramway Volume (K) Forecast, by Application 2019 & 2032
- Table 43: France Tramway Revenue (million) Forecast, by Application 2019 & 2032
- Table 44: France Tramway Volume (K) Forecast, by Application 2019 & 2032
- Table 45: Italy Tramway Revenue (million) Forecast, by Application 2019 & 2032
- Table 46: Italy Tramway Volume (K) Forecast, by Application 2019 & 2032
- Table 47: Spain Tramway Revenue (million) Forecast, by Application 2019 & 2032
- Table 48: Spain Tramway Volume (K) Forecast, by Application 2019 & 2032
- Table 49: Russia Tramway Revenue (million) Forecast, by Application 2019 & 2032
- Table 50: Russia Tramway Volume (K) Forecast, by Application 2019 & 2032
- Table 51: Benelux Tramway Revenue (million) Forecast, by Application 2019 & 2032
- Table 52: Benelux Tramway Volume (K) Forecast, by Application 2019 & 2032
- Table 53: Nordics Tramway Revenue (million) Forecast, by Application 2019 & 2032
- Table 54: Nordics Tramway Volume (K) Forecast, by Application 2019 & 2032
- Table 55: Rest of Europe Tramway Revenue (million) Forecast, by Application 2019 & 2032
- Table 56: Rest of Europe Tramway Volume (K) Forecast, by Application 2019 & 2032
- Table 57: Global Tramway Revenue million Forecast, by Application 2019 & 2032
- Table 58: Global Tramway Volume K Forecast, by Application 2019 & 2032
- Table 59: Global Tramway Revenue million Forecast, by Type 2019 & 2032
- Table 60: Global Tramway Volume K Forecast, by Type 2019 & 2032
- Table 61: Global Tramway Revenue million Forecast, by Country 2019 & 2032
- Table 62: Global Tramway Volume K Forecast, by Country 2019 & 2032
- Table 63: Turkey Tramway Revenue (million) Forecast, by Application 2019 & 2032
- Table 64: Turkey Tramway Volume (K) Forecast, by Application 2019 & 2032
- Table 65: Israel Tramway Revenue (million) Forecast, by Application 2019 & 2032
- Table 66: Israel Tramway Volume (K) Forecast, by Application 2019 & 2032
- Table 67: GCC Tramway Revenue (million) Forecast, by Application 2019 & 2032
- Table 68: GCC Tramway Volume (K) Forecast, by Application 2019 & 2032
- Table 69: North Africa Tramway Revenue (million) Forecast, by Application 2019 & 2032
- Table 70: North Africa Tramway Volume (K) Forecast, by Application 2019 & 2032
- Table 71: South Africa Tramway Revenue (million) Forecast, by Application 2019 & 2032
- Table 72: South Africa Tramway Volume (K) Forecast, by Application 2019 & 2032
- Table 73: Rest of Middle East & Africa Tramway Revenue (million) Forecast, by Application 2019 & 2032
- Table 74: Rest of Middle East & Africa Tramway Volume (K) Forecast, by Application 2019 & 2032
- Table 75: Global Tramway Revenue million Forecast, by Application 2019 & 2032
- Table 76: Global Tramway Volume K Forecast, by Application 2019 & 2032
- Table 77: Global Tramway Revenue million Forecast, by Type 2019 & 2032
- Table 78: Global Tramway Volume K Forecast, by Type 2019 & 2032
- Table 79: Global Tramway Revenue million Forecast, by Country 2019 & 2032
- Table 80: Global Tramway Volume K Forecast, by Country 2019 & 2032
- Table 81: China Tramway Revenue (million) Forecast, by Application 2019 & 2032
- Table 82: China Tramway Volume (K) Forecast, by Application 2019 & 2032
- Table 83: India Tramway Revenue (million) Forecast, by Application 2019 & 2032
- Table 84: India Tramway Volume (K) Forecast, by Application 2019 & 2032
- Table 85: Japan Tramway Revenue (million) Forecast, by Application 2019 & 2032
- Table 86: Japan Tramway Volume (K) Forecast, by Application 2019 & 2032
- Table 87: South Korea Tramway Revenue (million) Forecast, by Application 2019 & 2032
- Table 88: South Korea Tramway Volume (K) Forecast, by Application 2019 & 2032
- Table 89: ASEAN Tramway Revenue (million) Forecast, by Application 2019 & 2032
- Table 90: ASEAN Tramway Volume (K) Forecast, by Application 2019 & 2032
- Table 91: Oceania Tramway Revenue (million) Forecast, by Application 2019 & 2032
- Table 92: Oceania Tramway Volume (K) Forecast, by Application 2019 & 2032
- Table 93: Rest of Asia Pacific Tramway Revenue (million) Forecast, by Application 2019 & 2032
- Table 94: Rest of Asia Pacific Tramway Volume (K) Forecast, by Application 2019 & 2032
Frequently Asked Questions
1. What is the projected Compound Annual Growth Rate (CAGR) of the Tramway?
The projected CAGR is approximately XXX%.
2. Which companies are prominent players in the Tramway?
Key companies in the market include CRRC, Inekon Group, Alstom, Olsztyn, Bozankaya, Astra Vagoane Călători, Stadler Rail Group, Delachaux Group, Bombardier, Trowin Industries.
3. What are the main segments of the Tramway?
The market segments include Application, Type.
4. Can you provide details about the market size?
The market size is estimated to be USD XXX million as of 2022.
5. What are some drivers contributing to market growth?
N/A
6. What are the notable trends driving market growth?
N/A
7. Are there any restraints impacting market growth?
N/A
8. Can you provide examples of recent developments in the market?
N/A
9. What pricing options are available for accessing the report?
Pricing options include single-user, multi-user, and enterprise licenses priced at USD 3950.00, USD 5925.00, and USD 7900.00 respectively.
10. Is the market size provided in terms of value or volume?
The market size is provided in terms of value, measured in million and volume, measured in K.
11. Are there any specific market keywords associated with the report?
Yes, the market keyword associated with the report is "Tramway," which aids in identifying and referencing the specific market segment covered.
12. How do I determine which pricing option suits my needs best?
The pricing options vary based on user requirements and access needs. Individual users may opt for single-user licenses, while businesses requiring broader access may choose multi-user or enterprise licenses for cost-effective access to the report.
13. Are there any additional resources or data provided in the Tramway report?
While the report offers comprehensive insights, it's advisable to review the specific contents or supplementary materials provided to ascertain if additional resources or data are available.
14. How can I stay updated on further developments or reports in the Tramway?
To stay informed about further developments, trends, and reports in the Tramway, consider subscribing to industry newsletters, following relevant companies and organizations, or regularly checking reputable industry news sources and publications.
Methodology
Step 1 - Identification of Relevant Samples Size from Population Database


Step 2 - Approaches for Defining Global Market Size (Value, Volume* & Price*)

Note*: In applicable scenarios
Step 3 - Data Sources
Primary Research
- Web Analytics
- Survey Reports
- Research Institute
- Latest Research Reports
- Opinion Leaders
Secondary Research
- Annual Reports
- White Paper
- Latest Press Release
- Industry Association
- Paid Database
- Investor Presentations

Step 4 - Data Triangulation
Involves using different sources of information in order to increase the validity of a study
These sources are likely to be stakeholders in a program - participants, other researchers, program staff, other community members, and so on.
Then we put all data in single framework & apply various statistical tools to find out the dynamic on the market.
During the analysis stage, feedback from the stakeholder groups would be compared to determine areas of agreement as well as areas of divergence


