
Key Insights
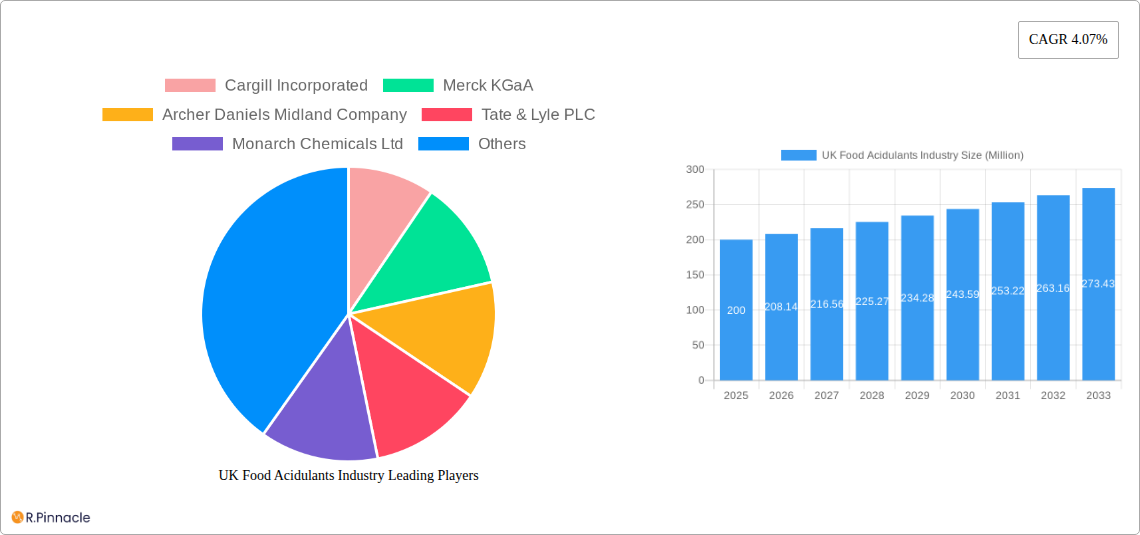
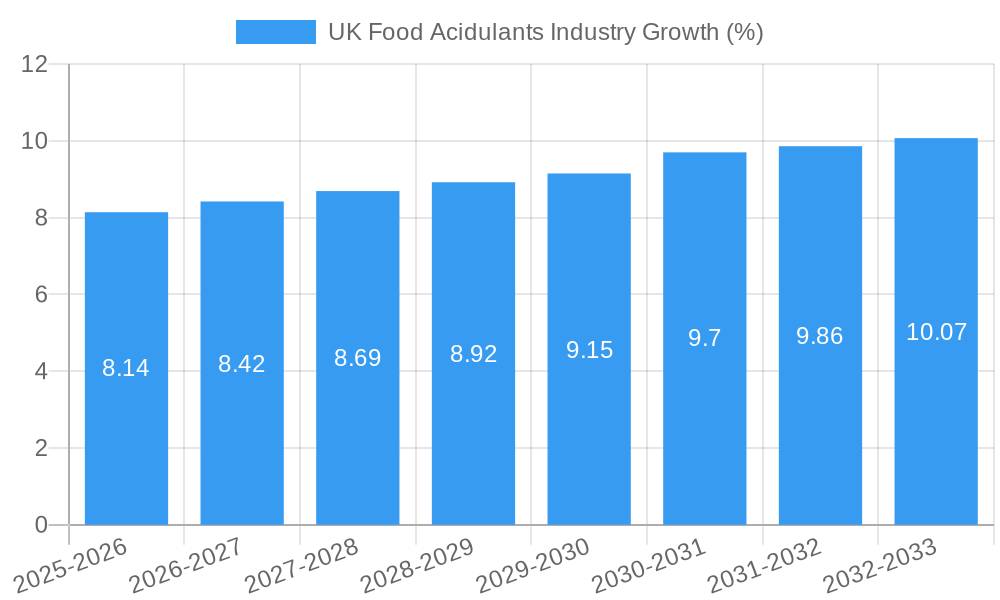
The UK food acidulants market, valued at approximately £200 million in 2025, is projected to experience steady growth, driven by increasing demand for processed foods and beverages. A compound annual growth rate (CAGR) of 4.07% from 2025 to 2033 indicates a market size exceeding £280 million by the end of the forecast period. Key drivers include the rising popularity of convenience foods, the growing demand for healthier food options (with acidulants contributing to preservation and taste), and the increasing sophistication of food processing techniques. The market is segmented by acid type (citric acid, phosphoric acid, lactic acid, and others) and application (beverages, dairy and frozen products, bakery, meat industry, confectionery, and others). Citric acid, owing to its versatility and perceived natural origin, likely holds the largest market share among acid types. The beverages segment is expected to dominate applications due to its extensive use in carbonated drinks and juices. However, increasing consumer awareness of the impact of certain acidulants on health may pose a restraint, potentially driving a shift toward natural alternatives in the long term. Major players like Cargill, Merck KGaA, and ADM are shaping the market through their extensive product portfolios and distribution networks.
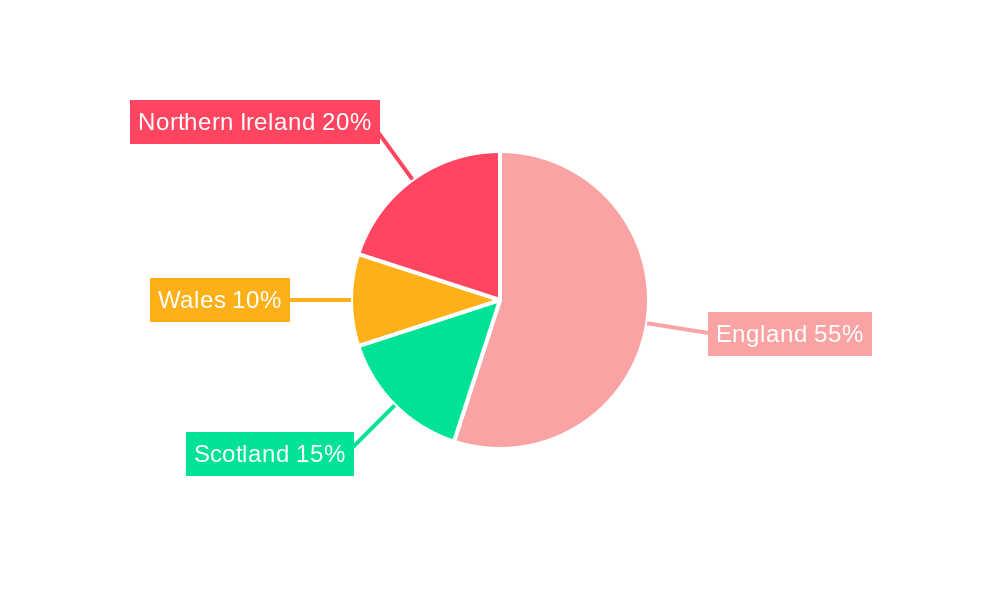
The competitive landscape is characterized by both large multinational corporations and smaller specialty chemical suppliers. The UK's strong food processing industry and relatively high per capita consumption of processed foods contribute to the market's robust growth. Regional variations within the UK (England, Wales, Scotland, and Northern Ireland) are likely to be minimal, with market penetration fairly consistent across these regions. Further growth opportunities lie in expanding the application of food acidulants in functional foods and beverages, and exploring innovative delivery systems to improve efficacy and consumer acceptance. The focus on sustainable sourcing and environmentally friendly production methods will also play an increasingly important role in shaping market dynamics within the coming years.
UK Food Acidulants Industry Report: 2019-2033
This comprehensive report provides a detailed analysis of the UK food acidulants market, offering invaluable insights for industry professionals, investors, and strategic planners. Covering the period from 2019 to 2033, with a base year of 2025, this report forecasts robust growth and identifies key opportunities within this dynamic sector. The report delves into market segmentation, competitive landscape, and emerging trends, providing a 360-degree view of the UK food acidulants market. Download now to gain a competitive edge!
UK Food Acidulants Industry Market Structure & Innovation Trends
This section analyzes the UK food acidulants market structure, highlighting key players, market concentration, and innovation drivers. The study period spans 2019-2033, with 2025 as the base and estimated year. The report examines the impact of regulatory frameworks, the presence of product substitutes, and end-user demographics on market dynamics. Furthermore, it explores mergers and acquisitions (M&A) activities within the sector, providing insights into deal values and their implications for market consolidation.
Market Concentration: The UK food acidulants market exhibits a moderately concentrated structure, with several major players commanding significant market share. Cargill Incorporated, Merck KGaA, Archer Daniels Midland Company, and Tate & Lyle PLC are among the leading companies, collectively holding an estimated xx% market share in 2025.
Innovation Drivers: Key drivers of innovation include consumer demand for clean-label products, the increasing prevalence of health-conscious food and beverage choices, and the growing demand for functional food ingredients. This is pushing companies to develop novel acidulants with enhanced functionality and improved sustainability profiles.
Regulatory Frameworks: Compliance with stringent food safety regulations significantly influences product development and market entry. Understanding the regulatory landscape is crucial for navigating this market effectively.
Product Substitutes: The market faces competition from alternative acidity regulators, necessitating continuous innovation to maintain market share.
End-User Demographics: Shifting consumer preferences towards healthier and more convenient food products have a substantial impact on the demand for specific food acidulants.
M&A Activities: The past five years have witnessed a moderate level of M&A activity, with deal values totaling an estimated £xx million. These activities reflect the strategic efforts of key players to expand their market reach and product portfolios.
UK Food Acidulants Industry Market Dynamics & Trends
This section examines the market's growth trajectory, exploring market growth drivers, technological disruptions, consumer preferences, and competitive dynamics within the UK food acidulants industry from 2019 to 2033. The compound annual growth rate (CAGR) for the forecast period (2025-2033) is projected at xx%, driven by several key factors. Market penetration of different acidulant types across various applications will also be analyzed. The evolving consumer landscape and its implications on product development and market demand are discussed in detail.
Dominant Regions & Segments in UK Food Acidulants Industry
This section identifies the leading regions, countries, and segments within the UK food acidulants market. Analysis considers both type (Citric Acid, Phosphoric Acid, Lactic Acid, Other Types) and application (Beverages, Dairy and Frozen Products, Bakery, Meat Industry, Confectionery, Other Applications). The report highlights key factors driving the dominance of specific segments and regions.
Leading Segment by Type: Citric acid is projected to remain the dominant segment throughout the forecast period, driven by its wide-ranging applications and established market presence.
Leading Segment by Application: The beverage industry is expected to remain the largest application segment, owing to the extensive use of acidulants in carbonated drinks, juices, and other beverages.
Key Drivers:
- Economic Policies: Government initiatives supporting the food and beverage industry positively influence market growth.
- Infrastructure: Efficient supply chains and distribution networks play a crucial role in supporting the market's expansion.
UK Food Acidulants Industry Product Innovations
Recent years have witnessed significant product innovations within the UK food acidulants industry, driven by consumer demand for clean label products and improved functionality. Manufacturers are focusing on developing acidulants with enhanced solubility, stability, and flavor profiles. These innovations are designed to enhance the quality and shelf life of food and beverages. Technological advancements in fermentation and extraction processes are leading to more sustainable and efficient production methods.
Report Scope & Segmentation Analysis
This report provides a comprehensive analysis of the UK food acidulants market, segmented by both type and application.
By Type: Citric Acid, Phosphoric Acid, Lactic Acid, and Other Types. Each segment's growth projection, market size, and competitive dynamics are detailed. Citric acid is expected to witness substantial growth due to its versatility.
By Application: Beverages, Dairy and Frozen Products, Bakery, Meat Industry, Confectionery, and Other Applications. The report analyzes each application's market size, growth potential, and key players. The beverage sector is expected to remain the largest consumer of food acidulants.
Key Drivers of UK Food Acidulants Industry Growth
The UK food acidulants market is experiencing robust growth driven by several key factors. Increasing demand for processed foods and beverages, coupled with the growing health-conscious consumer base pushing for clean label ingredients, significantly fuels market expansion. Moreover, ongoing advancements in food processing technology and the development of innovative acidulants further propel market growth. Favorable regulatory frameworks within the UK also support this expansion.
Challenges in the UK Food Acidulants Industry Sector
The UK food acidulants industry faces challenges, including stringent regulatory requirements impacting product development and market entry, and fluctuations in raw material prices influencing production costs. Supply chain disruptions and intense competition among existing players present further challenges for industry growth.
Emerging Opportunities in UK Food Acidulants Industry
The UK food acidulants industry presents several opportunities. The burgeoning demand for functional foods and beverages creates a promising market segment for acidulants with added health benefits. Moreover, advancements in sustainable production methods and eco-friendly packaging solutions offer opportunities for market expansion and differentiation. The increasing use of acidulants in novel food applications also presents new opportunities.
Leading Players in the UK Food Acidulants Industry Market
- Cargill Incorporated
- Merck KGaA
- Archer Daniels Midland Company
- Tate & Lyle PLC
- Monarch Chemicals Ltd
- Brenntag AG
- H Plus Limited
Key Developments in UK Food Acidulants Industry Industry
- 2022-03: Launch of a new, sustainably sourced citric acid by Cargill Incorporated.
- 2023-09: Merck KGaA announces expansion of its lactic acid production facility in the UK.
- 2024-06: Acquisition of a smaller acidulant producer by Tate & Lyle PLC. (Further details not available - value £xx million)
Future Outlook for UK Food Acidulants Industry Market
The UK food acidulants market is poised for continued growth driven by several factors. The rising demand for processed foods, the increasing focus on clean-label products, and the expansion of the functional food segment all contribute to a positive outlook. The market will witness further innovation in acidulant types and applications, catering to consumer demand for improved product quality and health benefits. The continuous evolution of the UK food and beverage industry presents significant growth opportunities for established and emerging players in this sector.
UK Food Acidulants Industry Segmentation
-
1. Type
- 1.1. Citric Acid
- 1.2. Phosphoric Acid
- 1.3. Lactic Acid
- 1.4. Other Types
-
2. Application
- 2.1. Beverages
- 2.2. Dairy and Frozen Products
- 2.3. Bakery
- 2.4. Meat Industry
- 2.5. Confectionery
- 2.6. Other Applications
UK Food Acidulants Industry Segmentation By Geography
-
1. North America
- 1.1. United States
- 1.2. Canada
- 1.3. Mexico
-
2. South America
- 2.1. Brazil
- 2.2. Argentina
- 2.3. Rest of South America
-
3. Europe
- 3.1. United Kingdom
- 3.2. Germany
- 3.3. France
- 3.4. Italy
- 3.5. Spain
- 3.6. Russia
- 3.7. Benelux
- 3.8. Nordics
- 3.9. Rest of Europe
-
4. Middle East & Africa
- 4.1. Turkey
- 4.2. Israel
- 4.3. GCC
- 4.4. North Africa
- 4.5. South Africa
- 4.6. Rest of Middle East & Africa
-
5. Asia Pacific
- 5.1. China
- 5.2. India
- 5.3. Japan
- 5.4. South Korea
- 5.5. ASEAN
- 5.6. Oceania
- 5.7. Rest of Asia Pacific
UK Food Acidulants Industry REPORT HIGHLIGHTS
| Aspects | Details |
|---|---|
| Study Period | 2019-2033 |
| Base Year | 2024 |
| Estimated Year | 2025 |
| Forecast Period | 2025-2033 |
| Historical Period | 2019-2024 |
| Growth Rate | CAGR of 4.07% from 2019-2033 |
| Segmentation |
|
Table of Contents
- 1. Introduction
- 1.1. Research Scope
- 1.2. Market Segmentation
- 1.3. Research Methodology
- 1.4. Definitions and Assumptions
- 2. Executive Summary
- 2.1. Introduction
- 3. Market Dynamics
- 3.1. Introduction
- 3.2. Market Drivers
- 3.2.1. Rising Application in Dietary Supplements
- 3.3. Market Restrains
- 3.3.1. Increasing prevalence of hydroglycemia
- 3.4. Market Trends
- 3.4.1. Phosphoric Acid Promises Growth in Future
- 4. Market Factor Analysis
- 4.1. Porters Five Forces
- 4.2. Supply/Value Chain
- 4.3. PESTEL analysis
- 4.4. Market Entropy
- 4.5. Patent/Trademark Analysis
- 5. Global UK Food Acidulants Industry Analysis, Insights and Forecast, 2019-2031
- 5.1. Market Analysis, Insights and Forecast - by Type
- 5.1.1. Citric Acid
- 5.1.2. Phosphoric Acid
- 5.1.3. Lactic Acid
- 5.1.4. Other Types
- 5.2. Market Analysis, Insights and Forecast - by Application
- 5.2.1. Beverages
- 5.2.2. Dairy and Frozen Products
- 5.2.3. Bakery
- 5.2.4. Meat Industry
- 5.2.5. Confectionery
- 5.2.6. Other Applications
- 5.3. Market Analysis, Insights and Forecast - by Region
- 5.3.1. North America
- 5.3.2. South America
- 5.3.3. Europe
- 5.3.4. Middle East & Africa
- 5.3.5. Asia Pacific
- 5.1. Market Analysis, Insights and Forecast - by Type
- 6. North America UK Food Acidulants Industry Analysis, Insights and Forecast, 2019-2031
- 6.1. Market Analysis, Insights and Forecast - by Type
- 6.1.1. Citric Acid
- 6.1.2. Phosphoric Acid
- 6.1.3. Lactic Acid
- 6.1.4. Other Types
- 6.2. Market Analysis, Insights and Forecast - by Application
- 6.2.1. Beverages
- 6.2.2. Dairy and Frozen Products
- 6.2.3. Bakery
- 6.2.4. Meat Industry
- 6.2.5. Confectionery
- 6.2.6. Other Applications
- 6.1. Market Analysis, Insights and Forecast - by Type
- 7. South America UK Food Acidulants Industry Analysis, Insights and Forecast, 2019-2031
- 7.1. Market Analysis, Insights and Forecast - by Type
- 7.1.1. Citric Acid
- 7.1.2. Phosphoric Acid
- 7.1.3. Lactic Acid
- 7.1.4. Other Types
- 7.2. Market Analysis, Insights and Forecast - by Application
- 7.2.1. Beverages
- 7.2.2. Dairy and Frozen Products
- 7.2.3. Bakery
- 7.2.4. Meat Industry
- 7.2.5. Confectionery
- 7.2.6. Other Applications
- 7.1. Market Analysis, Insights and Forecast - by Type
- 8. Europe UK Food Acidulants Industry Analysis, Insights and Forecast, 2019-2031
- 8.1. Market Analysis, Insights and Forecast - by Type
- 8.1.1. Citric Acid
- 8.1.2. Phosphoric Acid
- 8.1.3. Lactic Acid
- 8.1.4. Other Types
- 8.2. Market Analysis, Insights and Forecast - by Application
- 8.2.1. Beverages
- 8.2.2. Dairy and Frozen Products
- 8.2.3. Bakery
- 8.2.4. Meat Industry
- 8.2.5. Confectionery
- 8.2.6. Other Applications
- 8.1. Market Analysis, Insights and Forecast - by Type
- 9. Middle East & Africa UK Food Acidulants Industry Analysis, Insights and Forecast, 2019-2031
- 9.1. Market Analysis, Insights and Forecast - by Type
- 9.1.1. Citric Acid
- 9.1.2. Phosphoric Acid
- 9.1.3. Lactic Acid
- 9.1.4. Other Types
- 9.2. Market Analysis, Insights and Forecast - by Application
- 9.2.1. Beverages
- 9.2.2. Dairy and Frozen Products
- 9.2.3. Bakery
- 9.2.4. Meat Industry
- 9.2.5. Confectionery
- 9.2.6. Other Applications
- 9.1. Market Analysis, Insights and Forecast - by Type
- 10. Asia Pacific UK Food Acidulants Industry Analysis, Insights and Forecast, 2019-2031
- 10.1. Market Analysis, Insights and Forecast - by Type
- 10.1.1. Citric Acid
- 10.1.2. Phosphoric Acid
- 10.1.3. Lactic Acid
- 10.1.4. Other Types
- 10.2. Market Analysis, Insights and Forecast - by Application
- 10.2.1. Beverages
- 10.2.2. Dairy and Frozen Products
- 10.2.3. Bakery
- 10.2.4. Meat Industry
- 10.2.5. Confectionery
- 10.2.6. Other Applications
- 10.1. Market Analysis, Insights and Forecast - by Type
- 11. England UK Food Acidulants Industry Analysis, Insights and Forecast, 2019-2031
- 12. Wales UK Food Acidulants Industry Analysis, Insights and Forecast, 2019-2031
- 13. Scotland UK Food Acidulants Industry Analysis, Insights and Forecast, 2019-2031
- 14. Northern UK Food Acidulants Industry Analysis, Insights and Forecast, 2019-2031
- 15. Ireland UK Food Acidulants Industry Analysis, Insights and Forecast, 2019-2031
- 16. Competitive Analysis
- 16.1. Global Market Share Analysis 2024
- 16.2. Company Profiles
- 16.2.1 Cargill Incorporated
- 16.2.1.1. Overview
- 16.2.1.2. Products
- 16.2.1.3. SWOT Analysis
- 16.2.1.4. Recent Developments
- 16.2.1.5. Financials (Based on Availability)
- 16.2.2 Merck KGaA
- 16.2.2.1. Overview
- 16.2.2.2. Products
- 16.2.2.3. SWOT Analysis
- 16.2.2.4. Recent Developments
- 16.2.2.5. Financials (Based on Availability)
- 16.2.3 Archer Daniels Midland Company
- 16.2.3.1. Overview
- 16.2.3.2. Products
- 16.2.3.3. SWOT Analysis
- 16.2.3.4. Recent Developments
- 16.2.3.5. Financials (Based on Availability)
- 16.2.4 Tate & Lyle PLC
- 16.2.4.1. Overview
- 16.2.4.2. Products
- 16.2.4.3. SWOT Analysis
- 16.2.4.4. Recent Developments
- 16.2.4.5. Financials (Based on Availability)
- 16.2.5 Monarch Chemicals Ltd
- 16.2.5.1. Overview
- 16.2.5.2. Products
- 16.2.5.3. SWOT Analysis
- 16.2.5.4. Recent Developments
- 16.2.5.5. Financials (Based on Availability)
- 16.2.6 Brenntag AG
- 16.2.6.1. Overview
- 16.2.6.2. Products
- 16.2.6.3. SWOT Analysis
- 16.2.6.4. Recent Developments
- 16.2.6.5. Financials (Based on Availability)
- 16.2.7 H Plus Limited*List Not Exhaustive
- 16.2.7.1. Overview
- 16.2.7.2. Products
- 16.2.7.3. SWOT Analysis
- 16.2.7.4. Recent Developments
- 16.2.7.5. Financials (Based on Availability)
- 16.2.1 Cargill Incorporated
List of Figures
- Figure 1: Global UK Food Acidulants Industry Revenue Breakdown (Million, %) by Region 2024 & 2032
- Figure 2: Global UK Food Acidulants Industry Volume Breakdown (K Tons, %) by Region 2024 & 2032
- Figure 3: United kingdom Region UK Food Acidulants Industry Revenue (Million), by Country 2024 & 2032
- Figure 4: United kingdom Region UK Food Acidulants Industry Volume (K Tons), by Country 2024 & 2032
- Figure 5: United kingdom Region UK Food Acidulants Industry Revenue Share (%), by Country 2024 & 2032
- Figure 6: United kingdom Region UK Food Acidulants Industry Volume Share (%), by Country 2024 & 2032
- Figure 7: North America UK Food Acidulants Industry Revenue (Million), by Type 2024 & 2032
- Figure 8: North America UK Food Acidulants Industry Volume (K Tons), by Type 2024 & 2032
- Figure 9: North America UK Food Acidulants Industry Revenue Share (%), by Type 2024 & 2032
- Figure 10: North America UK Food Acidulants Industry Volume Share (%), by Type 2024 & 2032
- Figure 11: North America UK Food Acidulants Industry Revenue (Million), by Application 2024 & 2032
- Figure 12: North America UK Food Acidulants Industry Volume (K Tons), by Application 2024 & 2032
- Figure 13: North America UK Food Acidulants Industry Revenue Share (%), by Application 2024 & 2032
- Figure 14: North America UK Food Acidulants Industry Volume Share (%), by Application 2024 & 2032
- Figure 15: North America UK Food Acidulants Industry Revenue (Million), by Country 2024 & 2032
- Figure 16: North America UK Food Acidulants Industry Volume (K Tons), by Country 2024 & 2032
- Figure 17: North America UK Food Acidulants Industry Revenue Share (%), by Country 2024 & 2032
- Figure 18: North America UK Food Acidulants Industry Volume Share (%), by Country 2024 & 2032
- Figure 19: South America UK Food Acidulants Industry Revenue (Million), by Type 2024 & 2032
- Figure 20: South America UK Food Acidulants Industry Volume (K Tons), by Type 2024 & 2032
- Figure 21: South America UK Food Acidulants Industry Revenue Share (%), by Type 2024 & 2032
- Figure 22: South America UK Food Acidulants Industry Volume Share (%), by Type 2024 & 2032
- Figure 23: South America UK Food Acidulants Industry Revenue (Million), by Application 2024 & 2032
- Figure 24: South America UK Food Acidulants Industry Volume (K Tons), by Application 2024 & 2032
- Figure 25: South America UK Food Acidulants Industry Revenue Share (%), by Application 2024 & 2032
- Figure 26: South America UK Food Acidulants Industry Volume Share (%), by Application 2024 & 2032
- Figure 27: South America UK Food Acidulants Industry Revenue (Million), by Country 2024 & 2032
- Figure 28: South America UK Food Acidulants Industry Volume (K Tons), by Country 2024 & 2032
- Figure 29: South America UK Food Acidulants Industry Revenue Share (%), by Country 2024 & 2032
- Figure 30: South America UK Food Acidulants Industry Volume Share (%), by Country 2024 & 2032
- Figure 31: Europe UK Food Acidulants Industry Revenue (Million), by Type 2024 & 2032
- Figure 32: Europe UK Food Acidulants Industry Volume (K Tons), by Type 2024 & 2032
- Figure 33: Europe UK Food Acidulants Industry Revenue Share (%), by Type 2024 & 2032
- Figure 34: Europe UK Food Acidulants Industry Volume Share (%), by Type 2024 & 2032
- Figure 35: Europe UK Food Acidulants Industry Revenue (Million), by Application 2024 & 2032
- Figure 36: Europe UK Food Acidulants Industry Volume (K Tons), by Application 2024 & 2032
- Figure 37: Europe UK Food Acidulants Industry Revenue Share (%), by Application 2024 & 2032
- Figure 38: Europe UK Food Acidulants Industry Volume Share (%), by Application 2024 & 2032
- Figure 39: Europe UK Food Acidulants Industry Revenue (Million), by Country 2024 & 2032
- Figure 40: Europe UK Food Acidulants Industry Volume (K Tons), by Country 2024 & 2032
- Figure 41: Europe UK Food Acidulants Industry Revenue Share (%), by Country 2024 & 2032
- Figure 42: Europe UK Food Acidulants Industry Volume Share (%), by Country 2024 & 2032
- Figure 43: Middle East & Africa UK Food Acidulants Industry Revenue (Million), by Type 2024 & 2032
- Figure 44: Middle East & Africa UK Food Acidulants Industry Volume (K Tons), by Type 2024 & 2032
- Figure 45: Middle East & Africa UK Food Acidulants Industry Revenue Share (%), by Type 2024 & 2032
- Figure 46: Middle East & Africa UK Food Acidulants Industry Volume Share (%), by Type 2024 & 2032
- Figure 47: Middle East & Africa UK Food Acidulants Industry Revenue (Million), by Application 2024 & 2032
- Figure 48: Middle East & Africa UK Food Acidulants Industry Volume (K Tons), by Application 2024 & 2032
- Figure 49: Middle East & Africa UK Food Acidulants Industry Revenue Share (%), by Application 2024 & 2032
- Figure 50: Middle East & Africa UK Food Acidulants Industry Volume Share (%), by Application 2024 & 2032
- Figure 51: Middle East & Africa UK Food Acidulants Industry Revenue (Million), by Country 2024 & 2032
- Figure 52: Middle East & Africa UK Food Acidulants Industry Volume (K Tons), by Country 2024 & 2032
- Figure 53: Middle East & Africa UK Food Acidulants Industry Revenue Share (%), by Country 2024 & 2032
- Figure 54: Middle East & Africa UK Food Acidulants Industry Volume Share (%), by Country 2024 & 2032
- Figure 55: Asia Pacific UK Food Acidulants Industry Revenue (Million), by Type 2024 & 2032
- Figure 56: Asia Pacific UK Food Acidulants Industry Volume (K Tons), by Type 2024 & 2032
- Figure 57: Asia Pacific UK Food Acidulants Industry Revenue Share (%), by Type 2024 & 2032
- Figure 58: Asia Pacific UK Food Acidulants Industry Volume Share (%), by Type 2024 & 2032
- Figure 59: Asia Pacific UK Food Acidulants Industry Revenue (Million), by Application 2024 & 2032
- Figure 60: Asia Pacific UK Food Acidulants Industry Volume (K Tons), by Application 2024 & 2032
- Figure 61: Asia Pacific UK Food Acidulants Industry Revenue Share (%), by Application 2024 & 2032
- Figure 62: Asia Pacific UK Food Acidulants Industry Volume Share (%), by Application 2024 & 2032
- Figure 63: Asia Pacific UK Food Acidulants Industry Revenue (Million), by Country 2024 & 2032
- Figure 64: Asia Pacific UK Food Acidulants Industry Volume (K Tons), by Country 2024 & 2032
- Figure 65: Asia Pacific UK Food Acidulants Industry Revenue Share (%), by Country 2024 & 2032
- Figure 66: Asia Pacific UK Food Acidulants Industry Volume Share (%), by Country 2024 & 2032
List of Tables
- Table 1: Global UK Food Acidulants Industry Revenue Million Forecast, by Region 2019 & 2032
- Table 2: Global UK Food Acidulants Industry Volume K Tons Forecast, by Region 2019 & 2032
- Table 3: Global UK Food Acidulants Industry Revenue Million Forecast, by Type 2019 & 2032
- Table 4: Global UK Food Acidulants Industry Volume K Tons Forecast, by Type 2019 & 2032
- Table 5: Global UK Food Acidulants Industry Revenue Million Forecast, by Application 2019 & 2032
- Table 6: Global UK Food Acidulants Industry Volume K Tons Forecast, by Application 2019 & 2032
- Table 7: Global UK Food Acidulants Industry Revenue Million Forecast, by Region 2019 & 2032
- Table 8: Global UK Food Acidulants Industry Volume K Tons Forecast, by Region 2019 & 2032
- Table 9: Global UK Food Acidulants Industry Revenue Million Forecast, by Country 2019 & 2032
- Table 10: Global UK Food Acidulants Industry Volume K Tons Forecast, by Country 2019 & 2032
- Table 11: England UK Food Acidulants Industry Revenue (Million) Forecast, by Application 2019 & 2032
- Table 12: England UK Food Acidulants Industry Volume (K Tons) Forecast, by Application 2019 & 2032
- Table 13: Wales UK Food Acidulants Industry Revenue (Million) Forecast, by Application 2019 & 2032
- Table 14: Wales UK Food Acidulants Industry Volume (K Tons) Forecast, by Application 2019 & 2032
- Table 15: Scotland UK Food Acidulants Industry Revenue (Million) Forecast, by Application 2019 & 2032
- Table 16: Scotland UK Food Acidulants Industry Volume (K Tons) Forecast, by Application 2019 & 2032
- Table 17: Northern UK Food Acidulants Industry Revenue (Million) Forecast, by Application 2019 & 2032
- Table 18: Northern UK Food Acidulants Industry Volume (K Tons) Forecast, by Application 2019 & 2032
- Table 19: Ireland UK Food Acidulants Industry Revenue (Million) Forecast, by Application 2019 & 2032
- Table 20: Ireland UK Food Acidulants Industry Volume (K Tons) Forecast, by Application 2019 & 2032
- Table 21: Global UK Food Acidulants Industry Revenue Million Forecast, by Type 2019 & 2032
- Table 22: Global UK Food Acidulants Industry Volume K Tons Forecast, by Type 2019 & 2032
- Table 23: Global UK Food Acidulants Industry Revenue Million Forecast, by Application 2019 & 2032
- Table 24: Global UK Food Acidulants Industry Volume K Tons Forecast, by Application 2019 & 2032
- Table 25: Global UK Food Acidulants Industry Revenue Million Forecast, by Country 2019 & 2032
- Table 26: Global UK Food Acidulants Industry Volume K Tons Forecast, by Country 2019 & 2032
- Table 27: United States UK Food Acidulants Industry Revenue (Million) Forecast, by Application 2019 & 2032
- Table 28: United States UK Food Acidulants Industry Volume (K Tons) Forecast, by Application 2019 & 2032
- Table 29: Canada UK Food Acidulants Industry Revenue (Million) Forecast, by Application 2019 & 2032
- Table 30: Canada UK Food Acidulants Industry Volume (K Tons) Forecast, by Application 2019 & 2032
- Table 31: Mexico UK Food Acidulants Industry Revenue (Million) Forecast, by Application 2019 & 2032
- Table 32: Mexico UK Food Acidulants Industry Volume (K Tons) Forecast, by Application 2019 & 2032
- Table 33: Global UK Food Acidulants Industry Revenue Million Forecast, by Type 2019 & 2032
- Table 34: Global UK Food Acidulants Industry Volume K Tons Forecast, by Type 2019 & 2032
- Table 35: Global UK Food Acidulants Industry Revenue Million Forecast, by Application 2019 & 2032
- Table 36: Global UK Food Acidulants Industry Volume K Tons Forecast, by Application 2019 & 2032
- Table 37: Global UK Food Acidulants Industry Revenue Million Forecast, by Country 2019 & 2032
- Table 38: Global UK Food Acidulants Industry Volume K Tons Forecast, by Country 2019 & 2032
- Table 39: Brazil UK Food Acidulants Industry Revenue (Million) Forecast, by Application 2019 & 2032
- Table 40: Brazil UK Food Acidulants Industry Volume (K Tons) Forecast, by Application 2019 & 2032
- Table 41: Argentina UK Food Acidulants Industry Revenue (Million) Forecast, by Application 2019 & 2032
- Table 42: Argentina UK Food Acidulants Industry Volume (K Tons) Forecast, by Application 2019 & 2032
- Table 43: Rest of South America UK Food Acidulants Industry Revenue (Million) Forecast, by Application 2019 & 2032
- Table 44: Rest of South America UK Food Acidulants Industry Volume (K Tons) Forecast, by Application 2019 & 2032
- Table 45: Global UK Food Acidulants Industry Revenue Million Forecast, by Type 2019 & 2032
- Table 46: Global UK Food Acidulants Industry Volume K Tons Forecast, by Type 2019 & 2032
- Table 47: Global UK Food Acidulants Industry Revenue Million Forecast, by Application 2019 & 2032
- Table 48: Global UK Food Acidulants Industry Volume K Tons Forecast, by Application 2019 & 2032
- Table 49: Global UK Food Acidulants Industry Revenue Million Forecast, by Country 2019 & 2032
- Table 50: Global UK Food Acidulants Industry Volume K Tons Forecast, by Country 2019 & 2032
- Table 51: United Kingdom UK Food Acidulants Industry Revenue (Million) Forecast, by Application 2019 & 2032
- Table 52: United Kingdom UK Food Acidulants Industry Volume (K Tons) Forecast, by Application 2019 & 2032
- Table 53: Germany UK Food Acidulants Industry Revenue (Million) Forecast, by Application 2019 & 2032
- Table 54: Germany UK Food Acidulants Industry Volume (K Tons) Forecast, by Application 2019 & 2032
- Table 55: France UK Food Acidulants Industry Revenue (Million) Forecast, by Application 2019 & 2032
- Table 56: France UK Food Acidulants Industry Volume (K Tons) Forecast, by Application 2019 & 2032
- Table 57: Italy UK Food Acidulants Industry Revenue (Million) Forecast, by Application 2019 & 2032
- Table 58: Italy UK Food Acidulants Industry Volume (K Tons) Forecast, by Application 2019 & 2032
- Table 59: Spain UK Food Acidulants Industry Revenue (Million) Forecast, by Application 2019 & 2032
- Table 60: Spain UK Food Acidulants Industry Volume (K Tons) Forecast, by Application 2019 & 2032
- Table 61: Russia UK Food Acidulants Industry Revenue (Million) Forecast, by Application 2019 & 2032
- Table 62: Russia UK Food Acidulants Industry Volume (K Tons) Forecast, by Application 2019 & 2032
- Table 63: Benelux UK Food Acidulants Industry Revenue (Million) Forecast, by Application 2019 & 2032
- Table 64: Benelux UK Food Acidulants Industry Volume (K Tons) Forecast, by Application 2019 & 2032
- Table 65: Nordics UK Food Acidulants Industry Revenue (Million) Forecast, by Application 2019 & 2032
- Table 66: Nordics UK Food Acidulants Industry Volume (K Tons) Forecast, by Application 2019 & 2032
- Table 67: Rest of Europe UK Food Acidulants Industry Revenue (Million) Forecast, by Application 2019 & 2032
- Table 68: Rest of Europe UK Food Acidulants Industry Volume (K Tons) Forecast, by Application 2019 & 2032
- Table 69: Global UK Food Acidulants Industry Revenue Million Forecast, by Type 2019 & 2032
- Table 70: Global UK Food Acidulants Industry Volume K Tons Forecast, by Type 2019 & 2032
- Table 71: Global UK Food Acidulants Industry Revenue Million Forecast, by Application 2019 & 2032
- Table 72: Global UK Food Acidulants Industry Volume K Tons Forecast, by Application 2019 & 2032
- Table 73: Global UK Food Acidulants Industry Revenue Million Forecast, by Country 2019 & 2032
- Table 74: Global UK Food Acidulants Industry Volume K Tons Forecast, by Country 2019 & 2032
- Table 75: Turkey UK Food Acidulants Industry Revenue (Million) Forecast, by Application 2019 & 2032
- Table 76: Turkey UK Food Acidulants Industry Volume (K Tons) Forecast, by Application 2019 & 2032
- Table 77: Israel UK Food Acidulants Industry Revenue (Million) Forecast, by Application 2019 & 2032
- Table 78: Israel UK Food Acidulants Industry Volume (K Tons) Forecast, by Application 2019 & 2032
- Table 79: GCC UK Food Acidulants Industry Revenue (Million) Forecast, by Application 2019 & 2032
- Table 80: GCC UK Food Acidulants Industry Volume (K Tons) Forecast, by Application 2019 & 2032
- Table 81: North Africa UK Food Acidulants Industry Revenue (Million) Forecast, by Application 2019 & 2032
- Table 82: North Africa UK Food Acidulants Industry Volume (K Tons) Forecast, by Application 2019 & 2032
- Table 83: South Africa UK Food Acidulants Industry Revenue (Million) Forecast, by Application 2019 & 2032
- Table 84: South Africa UK Food Acidulants Industry Volume (K Tons) Forecast, by Application 2019 & 2032
- Table 85: Rest of Middle East & Africa UK Food Acidulants Industry Revenue (Million) Forecast, by Application 2019 & 2032
- Table 86: Rest of Middle East & Africa UK Food Acidulants Industry Volume (K Tons) Forecast, by Application 2019 & 2032
- Table 87: Global UK Food Acidulants Industry Revenue Million Forecast, by Type 2019 & 2032
- Table 88: Global UK Food Acidulants Industry Volume K Tons Forecast, by Type 2019 & 2032
- Table 89: Global UK Food Acidulants Industry Revenue Million Forecast, by Application 2019 & 2032
- Table 90: Global UK Food Acidulants Industry Volume K Tons Forecast, by Application 2019 & 2032
- Table 91: Global UK Food Acidulants Industry Revenue Million Forecast, by Country 2019 & 2032
- Table 92: Global UK Food Acidulants Industry Volume K Tons Forecast, by Country 2019 & 2032
- Table 93: China UK Food Acidulants Industry Revenue (Million) Forecast, by Application 2019 & 2032
- Table 94: China UK Food Acidulants Industry Volume (K Tons) Forecast, by Application 2019 & 2032
- Table 95: India UK Food Acidulants Industry Revenue (Million) Forecast, by Application 2019 & 2032
- Table 96: India UK Food Acidulants Industry Volume (K Tons) Forecast, by Application 2019 & 2032
- Table 97: Japan UK Food Acidulants Industry Revenue (Million) Forecast, by Application 2019 & 2032
- Table 98: Japan UK Food Acidulants Industry Volume (K Tons) Forecast, by Application 2019 & 2032
- Table 99: South Korea UK Food Acidulants Industry Revenue (Million) Forecast, by Application 2019 & 2032
- Table 100: South Korea UK Food Acidulants Industry Volume (K Tons) Forecast, by Application 2019 & 2032
- Table 101: ASEAN UK Food Acidulants Industry Revenue (Million) Forecast, by Application 2019 & 2032
- Table 102: ASEAN UK Food Acidulants Industry Volume (K Tons) Forecast, by Application 2019 & 2032
- Table 103: Oceania UK Food Acidulants Industry Revenue (Million) Forecast, by Application 2019 & 2032
- Table 104: Oceania UK Food Acidulants Industry Volume (K Tons) Forecast, by Application 2019 & 2032
- Table 105: Rest of Asia Pacific UK Food Acidulants Industry Revenue (Million) Forecast, by Application 2019 & 2032
- Table 106: Rest of Asia Pacific UK Food Acidulants Industry Volume (K Tons) Forecast, by Application 2019 & 2032
Frequently Asked Questions
1. What is the projected Compound Annual Growth Rate (CAGR) of the UK Food Acidulants Industry?
The projected CAGR is approximately 4.07%.
2. Which companies are prominent players in the UK Food Acidulants Industry?
Key companies in the market include Cargill Incorporated, Merck KGaA, Archer Daniels Midland Company, Tate & Lyle PLC, Monarch Chemicals Ltd, Brenntag AG, H Plus Limited*List Not Exhaustive.
3. What are the main segments of the UK Food Acidulants Industry?
The market segments include Type, Application.
4. Can you provide details about the market size?
The market size is estimated to be USD XX Million as of 2022.
5. What are some drivers contributing to market growth?
Rising Application in Dietary Supplements.
6. What are the notable trends driving market growth?
Phosphoric Acid Promises Growth in Future.
7. Are there any restraints impacting market growth?
Increasing prevalence of hydroglycemia.
8. Can you provide examples of recent developments in the market?
N/A
9. What pricing options are available for accessing the report?
Pricing options include single-user, multi-user, and enterprise licenses priced at USD 3800, USD 4500, and USD 5800 respectively.
10. Is the market size provided in terms of value or volume?
The market size is provided in terms of value, measured in Million and volume, measured in K Tons.
11. Are there any specific market keywords associated with the report?
Yes, the market keyword associated with the report is "UK Food Acidulants Industry," which aids in identifying and referencing the specific market segment covered.
12. How do I determine which pricing option suits my needs best?
The pricing options vary based on user requirements and access needs. Individual users may opt for single-user licenses, while businesses requiring broader access may choose multi-user or enterprise licenses for cost-effective access to the report.
13. Are there any additional resources or data provided in the UK Food Acidulants Industry report?
While the report offers comprehensive insights, it's advisable to review the specific contents or supplementary materials provided to ascertain if additional resources or data are available.
14. How can I stay updated on further developments or reports in the UK Food Acidulants Industry?
To stay informed about further developments, trends, and reports in the UK Food Acidulants Industry, consider subscribing to industry newsletters, following relevant companies and organizations, or regularly checking reputable industry news sources and publications.
Methodology
Step 1 - Identification of Relevant Samples Size from Population Database


Step 2 - Approaches for Defining Global Market Size (Value, Volume* & Price*)

Note*: In applicable scenarios
Step 3 - Data Sources
Primary Research
- Web Analytics
- Survey Reports
- Research Institute
- Latest Research Reports
- Opinion Leaders
Secondary Research
- Annual Reports
- White Paper
- Latest Press Release
- Industry Association
- Paid Database
- Investor Presentations

Step 4 - Data Triangulation
Involves using different sources of information in order to increase the validity of a study
These sources are likely to be stakeholders in a program - participants, other researchers, program staff, other community members, and so on.
Then we put all data in single framework & apply various statistical tools to find out the dynamic on the market.
During the analysis stage, feedback from the stakeholder groups would be compared to determine areas of agreement as well as areas of divergence


