
Key Insights
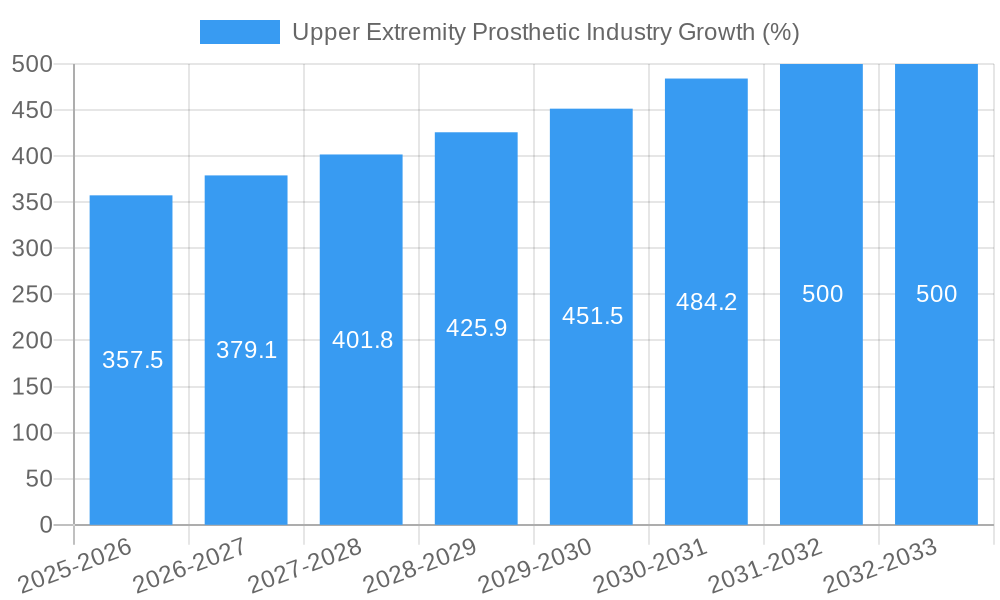
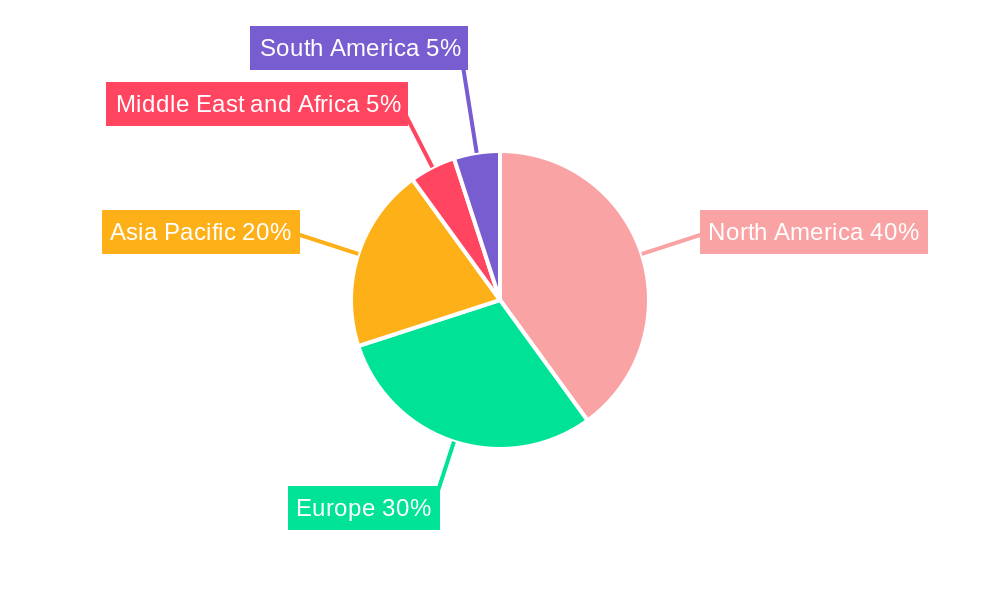
The global upper extremity prosthetic market is experiencing robust growth, driven by factors such as an increasing geriatric population, rising prevalence of limb deficiency due to accidents and congenital disorders, and advancements in prosthetic technology. The market's Compound Annual Growth Rate (CAGR) of 5.50% from 2019 to 2024 indicates a consistent upward trajectory. This growth is further fueled by technological innovations like the development of more sophisticated myoelectric prosthetics offering improved functionality and comfort compared to traditional body-powered devices. The market is segmented by device type (body-powered, passive, hybrid, myoelectric), component (elbow, wrist, arm, shoulder, other), and end-user (hospitals, prosthetic clinics, others). Myoelectric prosthetics are projected to capture a significant market share due to their advanced features and superior user experience, while the prosthetic arm segment holds substantial value due to its complexity and demand. North America and Europe currently dominate the market owing to established healthcare infrastructure and high disposable incomes, however, the Asia-Pacific region is anticipated to witness significant growth in the coming years, propelled by rising awareness, improved healthcare access, and a growing middle class.
The market's restraints include the high cost of advanced prosthetics, limiting accessibility for many patients, particularly in developing economies. However, increasing insurance coverage and government initiatives aimed at improving healthcare access are gradually mitigating this constraint. Furthermore, the ongoing research and development efforts focused on enhancing prosthetic design, functionality, and aesthetics are continuously expanding the market's potential. Key players in the market, including Ossur, Ottobock, and others, are strategically investing in research, mergers and acquisitions, and expanding their product portfolios to maintain their competitive edge. Future market growth is projected to be driven by the introduction of advanced materials, improved control systems, and personalized prosthetic solutions tailored to individual needs and preferences. The market is expected to see increased adoption of advanced manufacturing techniques and the integration of artificial intelligence for enhanced prosthetic functionality and intuitive control.
Upper Extremity Prosthetic Industry: Market Analysis & Forecast Report (2019-2033)
This comprehensive report provides a detailed analysis of the Upper Extremity Prosthetic industry, offering invaluable insights for industry professionals, investors, and researchers. With a focus on market dynamics, technological advancements, and competitive landscapes, this report covers the period from 2019 to 2033, with a base year of 2025 and a forecast period of 2025-2033. The global market size is projected to reach xx Million by 2033, exhibiting significant growth.
Upper Extremity Prosthetic Industry Market Structure & Innovation Trends
The Upper Extremity Prosthetic industry is moderately consolidated, with key players holding significant market share. While precise market share figures for each company require further detailed analysis, companies like Ottobock SE & Co KgaA, Ossur, and Steeper Inc. are estimated to collectively hold a substantial portion of the global market. Innovation is driven by advancements in materials science, robotics, and AI, leading to more sophisticated and user-friendly prosthetic devices. Regulatory frameworks, varying by region, influence product approvals and market access. The industry witnesses ongoing mergers and acquisitions (M&A) activity, with deal values averaging xx Million per transaction in recent years. Substitute products, such as functional bracing, pose some competitive pressure, while demographics, particularly the aging population, present a key growth driver.
- Market Concentration: Moderately consolidated, with major players holding significant share.
- Innovation Drivers: Advancements in materials, robotics, AI, and miniaturization.
- Regulatory Frameworks: Varying regional regulations impact product approvals and market access.
- M&A Activity: Frequent activity, with average deal values around xx Million.
- End-User Demographics: Aging population and increasing incidence of limb loss drive growth.
Upper Extremity Prosthetic Industry Market Dynamics & Trends
The Upper Extremity Prosthetic market exhibits robust growth, driven by several factors. Technological advancements, such as the development of myoelectric and body-powered prosthetics with improved functionality and intuitive controls, significantly contribute to market expansion. The increasing prevalence of limb loss due to accidents, diseases, and aging populations fuels market demand. Consumer preferences shift towards lightweight, aesthetically pleasing, and more functional devices. Competitive dynamics are marked by innovation, product differentiation, and strategic partnerships. The Compound Annual Growth Rate (CAGR) is projected to be xx% during the forecast period, with market penetration increasing significantly in developing economies.
Dominant Regions & Segments in Upper Extremity Prosthetic Industry
North America currently dominates the Upper Extremity Prosthetic market, owing to high healthcare expenditure, advanced medical infrastructure, and a substantial patient pool. Within device types, Myoelectric prosthetics are the fastest-growing segment, driven by technological advancements and rising consumer demand. Hospitals and prosthetic clinics are the key end-users.
- Key Drivers of North American Dominance:
- High healthcare expenditure
- Advanced medical infrastructure
- Large patient pool with high disposable income.
- Fastest-Growing Segment (Device Type): Myoelectric prosthetics.
- Key End-Users: Hospitals and specialized prosthetic clinics.
- Fastest-Growing Region (Geography): Asia-Pacific, driven by rising healthcare spending and increasing awareness.
Upper Extremity Prosthetic Industry Product Innovations
Recent innovations include advanced myoelectric control systems offering more intuitive and precise control, improved materials for enhanced durability and comfort, and the integration of sensors and smart technologies for personalized functionality. These advancements address unmet clinical needs and improve patient outcomes, thereby driving market growth and product differentiation. The focus is on creating devices that are more natural-looking, comfortable, and easily adaptable to individual needs.
Report Scope & Segmentation Analysis
This report segments the Upper Extremity Prosthetic market by device type (Body Powered, Passive, Hybrid, Myoelectric), component (Prosthetic Elbow, Prosthetic Wrist, Prosthetic Arm, Prosthetic Shoulder, Other Components), and end-user (Hospitals, Prosthetic Clinics, Other End Users). Each segment is analyzed in detail, projecting market size and growth based on various factors, including technological advancements, regulatory changes, and market competition. The report provides a thorough understanding of the competitive landscape within each segment, helping stakeholders make informed decisions.
Key Drivers of Upper Extremity Prosthetic Industry Growth
Technological advancements leading to improved functionality and aesthetics, increasing prevalence of limb loss due to accidents, diabetes, and vascular disease, rising healthcare expenditure, and favorable regulatory policies supporting prosthetic adoption are major growth drivers. The growing geriatric population also plays a significant role, leading to increased demand for upper extremity prosthetics.
Challenges in the Upper Extremity Prosthetic Industry Sector
High costs of advanced prosthetic devices, stringent regulatory requirements for approval and reimbursement, complex manufacturing processes, and the need for skilled professionals for fitting and maintenance pose challenges to the industry. Supply chain disruptions can also impact the availability and cost of components, creating temporary shortages. The high cost of advanced prosthetics limits access for many patients.
Emerging Opportunities in Upper Extremity Prosthetic Industry
The integration of advanced sensors, AI, and machine learning presents significant opportunities for developing more personalized and functional prosthetics. Expansion into emerging markets with growing healthcare infrastructure and unmet clinical needs offer substantial potential. Development of innovative financing and payment models to improve access to advanced prosthetics could also unlock significant growth opportunities.
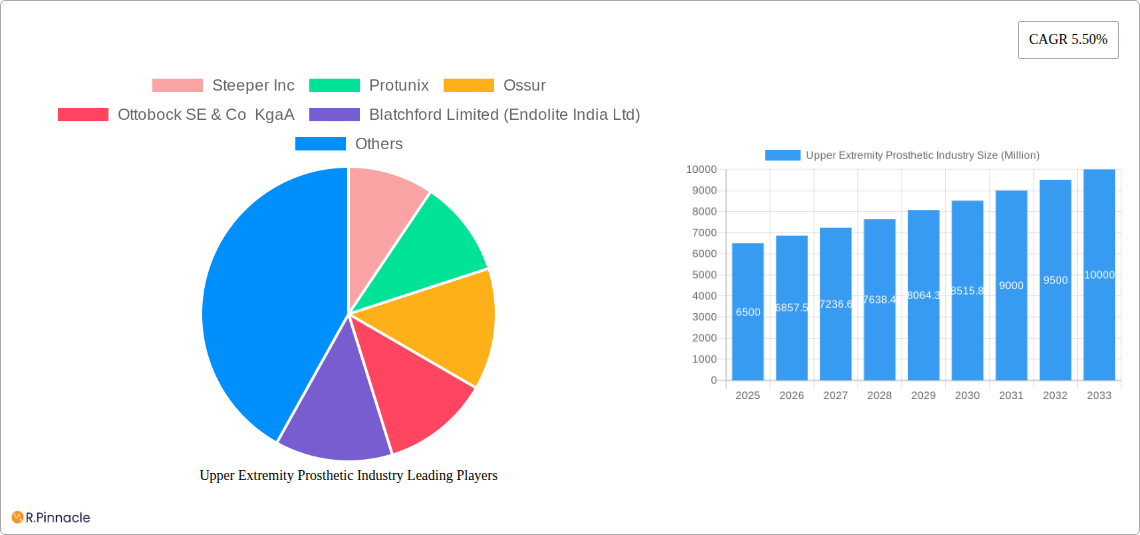
Leading Players in the Upper Extremity Prosthetic Industry Market
- Steeper Inc
- Protunix
- Ossur
- Ottobock SE & Co KgaA
- Blatchford Limited (Endolite India Ltd)
- WillowWood Global LLC
- Fillauer LLC
- Open Bionics Ltd
- Ortho Europe
- COAPT LLC
Key Developments in Upper Extremity Prosthetic Industry Industry
- July 2021: Stryker launched the Tornier shoulder arthroplasty portfolio, including the Perform Humeral Stem, enhancing surgical options.
- July 2021: Össur launched the Rebound Post-Op Elbow Brace, improving patient recovery and clinician experience.
Future Outlook for Upper Extremity Prosthetic Industry Market
The Upper Extremity Prosthetic market is poised for continued growth, driven by technological innovations, increasing prevalence of limb loss, and rising healthcare spending globally. Strategic partnerships, product diversification, and expansion into emerging markets will be crucial for sustained success in this dynamic industry. The focus on improving affordability and accessibility will significantly shape the future trajectory of the market.
Upper Extremity Prosthetic Industry Segmentation
-
1. Device Type
- 1.1. Body Powered
- 1.2. Passive
- 1.3. Hybrid
- 1.4. Myoelectric
-
2. Component
- 2.1. Prosthetic Elbow
- 2.2. Prosthetic Wrist
- 2.3. Prosthetic Arm
- 2.4. Prosthetic Shoulder
- 2.5. Other Components
-
3. End User
- 3.1. Hospitals
- 3.2. Prosthetic Clinics
- 3.3. Other End Users
Upper Extremity Prosthetic Industry Segmentation By Geography
-
1. North America
- 1.1. United States
- 1.2. Canada
- 1.3. Mexico
-
2. Europe
- 2.1. Germany
- 2.2. United Kingdom
- 2.3. France
- 2.4. Italy
- 2.5. Spain
- 2.6. Rest of Europe
-
3. Asia Pacific
- 3.1. China
- 3.2. Japan
- 3.3. India
- 3.4. Australia
- 3.5. South Korea
- 3.6. Rest of Asia Pacific
-
4. Middle East and Africa
- 4.1. GCC
- 4.2. South Africa
- 4.3. Rest of Middle East and Africa
-
5. South America
- 5.1. Brazil
- 5.2. Argentina
- 5.3. Rest of South America
Upper Extremity Prosthetic Industry REPORT HIGHLIGHTS
| Aspects | Details |
|---|---|
| Study Period | 2019-2033 |
| Base Year | 2024 |
| Estimated Year | 2025 |
| Forecast Period | 2025-2033 |
| Historical Period | 2019-2024 |
| Growth Rate | CAGR of 5.50% from 2019-2033 |
| Segmentation |
|
Table of Contents
- 1. Introduction
- 1.1. Research Scope
- 1.2. Market Segmentation
- 1.3. Research Methodology
- 1.4. Definitions and Assumptions
- 2. Executive Summary
- 2.1. Introduction
- 3. Market Dynamics
- 3.1. Introduction
- 3.2. Market Drivers
- 3.2.1. Increasing Number of Serious Injuries and Rise in Number of Amputations; Technological Advancements
- 3.3. Market Restrains
- 3.3.1. High Prices of Prosthetics; Lack of Awareness in Developing Regions
- 3.4. Market Trends
- 3.4.1. Myoelectric Expected to Hold Significant Share in the Upper Limb Prosthetics Market
- 4. Market Factor Analysis
- 4.1. Porters Five Forces
- 4.2. Supply/Value Chain
- 4.3. PESTEL analysis
- 4.4. Market Entropy
- 4.5. Patent/Trademark Analysis
- 5. Global Upper Extremity Prosthetic Industry Analysis, Insights and Forecast, 2019-2031
- 5.1. Market Analysis, Insights and Forecast - by Device Type
- 5.1.1. Body Powered
- 5.1.2. Passive
- 5.1.3. Hybrid
- 5.1.4. Myoelectric
- 5.2. Market Analysis, Insights and Forecast - by Component
- 5.2.1. Prosthetic Elbow
- 5.2.2. Prosthetic Wrist
- 5.2.3. Prosthetic Arm
- 5.2.4. Prosthetic Shoulder
- 5.2.5. Other Components
- 5.3. Market Analysis, Insights and Forecast - by End User
- 5.3.1. Hospitals
- 5.3.2. Prosthetic Clinics
- 5.3.3. Other End Users
- 5.4. Market Analysis, Insights and Forecast - by Region
- 5.4.1. North America
- 5.4.2. Europe
- 5.4.3. Asia Pacific
- 5.4.4. Middle East and Africa
- 5.4.5. South America
- 5.1. Market Analysis, Insights and Forecast - by Device Type
- 6. North America Upper Extremity Prosthetic Industry Analysis, Insights and Forecast, 2019-2031
- 6.1. Market Analysis, Insights and Forecast - by Device Type
- 6.1.1. Body Powered
- 6.1.2. Passive
- 6.1.3. Hybrid
- 6.1.4. Myoelectric
- 6.2. Market Analysis, Insights and Forecast - by Component
- 6.2.1. Prosthetic Elbow
- 6.2.2. Prosthetic Wrist
- 6.2.3. Prosthetic Arm
- 6.2.4. Prosthetic Shoulder
- 6.2.5. Other Components
- 6.3. Market Analysis, Insights and Forecast - by End User
- 6.3.1. Hospitals
- 6.3.2. Prosthetic Clinics
- 6.3.3. Other End Users
- 6.1. Market Analysis, Insights and Forecast - by Device Type
- 7. Europe Upper Extremity Prosthetic Industry Analysis, Insights and Forecast, 2019-2031
- 7.1. Market Analysis, Insights and Forecast - by Device Type
- 7.1.1. Body Powered
- 7.1.2. Passive
- 7.1.3. Hybrid
- 7.1.4. Myoelectric
- 7.2. Market Analysis, Insights and Forecast - by Component
- 7.2.1. Prosthetic Elbow
- 7.2.2. Prosthetic Wrist
- 7.2.3. Prosthetic Arm
- 7.2.4. Prosthetic Shoulder
- 7.2.5. Other Components
- 7.3. Market Analysis, Insights and Forecast - by End User
- 7.3.1. Hospitals
- 7.3.2. Prosthetic Clinics
- 7.3.3. Other End Users
- 7.1. Market Analysis, Insights and Forecast - by Device Type
- 8. Asia Pacific Upper Extremity Prosthetic Industry Analysis, Insights and Forecast, 2019-2031
- 8.1. Market Analysis, Insights and Forecast - by Device Type
- 8.1.1. Body Powered
- 8.1.2. Passive
- 8.1.3. Hybrid
- 8.1.4. Myoelectric
- 8.2. Market Analysis, Insights and Forecast - by Component
- 8.2.1. Prosthetic Elbow
- 8.2.2. Prosthetic Wrist
- 8.2.3. Prosthetic Arm
- 8.2.4. Prosthetic Shoulder
- 8.2.5. Other Components
- 8.3. Market Analysis, Insights and Forecast - by End User
- 8.3.1. Hospitals
- 8.3.2. Prosthetic Clinics
- 8.3.3. Other End Users
- 8.1. Market Analysis, Insights and Forecast - by Device Type
- 9. Middle East and Africa Upper Extremity Prosthetic Industry Analysis, Insights and Forecast, 2019-2031
- 9.1. Market Analysis, Insights and Forecast - by Device Type
- 9.1.1. Body Powered
- 9.1.2. Passive
- 9.1.3. Hybrid
- 9.1.4. Myoelectric
- 9.2. Market Analysis, Insights and Forecast - by Component
- 9.2.1. Prosthetic Elbow
- 9.2.2. Prosthetic Wrist
- 9.2.3. Prosthetic Arm
- 9.2.4. Prosthetic Shoulder
- 9.2.5. Other Components
- 9.3. Market Analysis, Insights and Forecast - by End User
- 9.3.1. Hospitals
- 9.3.2. Prosthetic Clinics
- 9.3.3. Other End Users
- 9.1. Market Analysis, Insights and Forecast - by Device Type
- 10. South America Upper Extremity Prosthetic Industry Analysis, Insights and Forecast, 2019-2031
- 10.1. Market Analysis, Insights and Forecast - by Device Type
- 10.1.1. Body Powered
- 10.1.2. Passive
- 10.1.3. Hybrid
- 10.1.4. Myoelectric
- 10.2. Market Analysis, Insights and Forecast - by Component
- 10.2.1. Prosthetic Elbow
- 10.2.2. Prosthetic Wrist
- 10.2.3. Prosthetic Arm
- 10.2.4. Prosthetic Shoulder
- 10.2.5. Other Components
- 10.3. Market Analysis, Insights and Forecast - by End User
- 10.3.1. Hospitals
- 10.3.2. Prosthetic Clinics
- 10.3.3. Other End Users
- 10.1. Market Analysis, Insights and Forecast - by Device Type
- 11. North America Upper Extremity Prosthetic Industry Analysis, Insights and Forecast, 2019-2031
- 11.1. Market Analysis, Insights and Forecast - By Country/Sub-region
- 11.1.1 United States
- 11.1.2 Canada
- 11.1.3 Mexico
- 12. Europe Upper Extremity Prosthetic Industry Analysis, Insights and Forecast, 2019-2031
- 12.1. Market Analysis, Insights and Forecast - By Country/Sub-region
- 12.1.1 Germany
- 12.1.2 United Kingdom
- 12.1.3 France
- 12.1.4 Italy
- 12.1.5 Spain
- 12.1.6 Rest of Europe
- 13. Asia Pacific Upper Extremity Prosthetic Industry Analysis, Insights and Forecast, 2019-2031
- 13.1. Market Analysis, Insights and Forecast - By Country/Sub-region
- 13.1.1 China
- 13.1.2 Japan
- 13.1.3 India
- 13.1.4 Australia
- 13.1.5 South Korea
- 13.1.6 Rest of Asia Pacific
- 14. Middle East and Africa Upper Extremity Prosthetic Industry Analysis, Insights and Forecast, 2019-2031
- 14.1. Market Analysis, Insights and Forecast - By Country/Sub-region
- 14.1.1 GCC
- 14.1.2 South Africa
- 14.1.3 Rest of Middle East and Africa
- 15. South America Upper Extremity Prosthetic Industry Analysis, Insights and Forecast, 2019-2031
- 15.1. Market Analysis, Insights and Forecast - By Country/Sub-region
- 15.1.1 Brazil
- 15.1.2 Argentina
- 15.1.3 Rest of South America
- 16. Competitive Analysis
- 16.1. Global Market Share Analysis 2024
- 16.2. Company Profiles
- 16.2.1 Steeper Inc
- 16.2.1.1. Overview
- 16.2.1.2. Products
- 16.2.1.3. SWOT Analysis
- 16.2.1.4. Recent Developments
- 16.2.1.5. Financials (Based on Availability)
- 16.2.2 Protunix
- 16.2.2.1. Overview
- 16.2.2.2. Products
- 16.2.2.3. SWOT Analysis
- 16.2.2.4. Recent Developments
- 16.2.2.5. Financials (Based on Availability)
- 16.2.3 Ossur
- 16.2.3.1. Overview
- 16.2.3.2. Products
- 16.2.3.3. SWOT Analysis
- 16.2.3.4. Recent Developments
- 16.2.3.5. Financials (Based on Availability)
- 16.2.4 Ottobock SE & Co KgaA
- 16.2.4.1. Overview
- 16.2.4.2. Products
- 16.2.4.3. SWOT Analysis
- 16.2.4.4. Recent Developments
- 16.2.4.5. Financials (Based on Availability)
- 16.2.5 Blatchford Limited (Endolite India Ltd)
- 16.2.5.1. Overview
- 16.2.5.2. Products
- 16.2.5.3. SWOT Analysis
- 16.2.5.4. Recent Developments
- 16.2.5.5. Financials (Based on Availability)
- 16.2.6 WillowWood Global LLC
- 16.2.6.1. Overview
- 16.2.6.2. Products
- 16.2.6.3. SWOT Analysis
- 16.2.6.4. Recent Developments
- 16.2.6.5. Financials (Based on Availability)
- 16.2.7 Fillauer LLC
- 16.2.7.1. Overview
- 16.2.7.2. Products
- 16.2.7.3. SWOT Analysis
- 16.2.7.4. Recent Developments
- 16.2.7.5. Financials (Based on Availability)
- 16.2.8 Open Bionics Ltd*List Not Exhaustive
- 16.2.8.1. Overview
- 16.2.8.2. Products
- 16.2.8.3. SWOT Analysis
- 16.2.8.4. Recent Developments
- 16.2.8.5. Financials (Based on Availability)
- 16.2.9 Ortho Europe
- 16.2.9.1. Overview
- 16.2.9.2. Products
- 16.2.9.3. SWOT Analysis
- 16.2.9.4. Recent Developments
- 16.2.9.5. Financials (Based on Availability)
- 16.2.10 COAPT LLC
- 16.2.10.1. Overview
- 16.2.10.2. Products
- 16.2.10.3. SWOT Analysis
- 16.2.10.4. Recent Developments
- 16.2.10.5. Financials (Based on Availability)
- 16.2.1 Steeper Inc
List of Figures
- Figure 1: Global Upper Extremity Prosthetic Industry Revenue Breakdown (Million, %) by Region 2024 & 2032
- Figure 2: North America Upper Extremity Prosthetic Industry Revenue (Million), by Country 2024 & 2032
- Figure 3: North America Upper Extremity Prosthetic Industry Revenue Share (%), by Country 2024 & 2032
- Figure 4: Europe Upper Extremity Prosthetic Industry Revenue (Million), by Country 2024 & 2032
- Figure 5: Europe Upper Extremity Prosthetic Industry Revenue Share (%), by Country 2024 & 2032
- Figure 6: Asia Pacific Upper Extremity Prosthetic Industry Revenue (Million), by Country 2024 & 2032
- Figure 7: Asia Pacific Upper Extremity Prosthetic Industry Revenue Share (%), by Country 2024 & 2032
- Figure 8: Middle East and Africa Upper Extremity Prosthetic Industry Revenue (Million), by Country 2024 & 2032
- Figure 9: Middle East and Africa Upper Extremity Prosthetic Industry Revenue Share (%), by Country 2024 & 2032
- Figure 10: South America Upper Extremity Prosthetic Industry Revenue (Million), by Country 2024 & 2032
- Figure 11: South America Upper Extremity Prosthetic Industry Revenue Share (%), by Country 2024 & 2032
- Figure 12: North America Upper Extremity Prosthetic Industry Revenue (Million), by Device Type 2024 & 2032
- Figure 13: North America Upper Extremity Prosthetic Industry Revenue Share (%), by Device Type 2024 & 2032
- Figure 14: North America Upper Extremity Prosthetic Industry Revenue (Million), by Component 2024 & 2032
- Figure 15: North America Upper Extremity Prosthetic Industry Revenue Share (%), by Component 2024 & 2032
- Figure 16: North America Upper Extremity Prosthetic Industry Revenue (Million), by End User 2024 & 2032
- Figure 17: North America Upper Extremity Prosthetic Industry Revenue Share (%), by End User 2024 & 2032
- Figure 18: North America Upper Extremity Prosthetic Industry Revenue (Million), by Country 2024 & 2032
- Figure 19: North America Upper Extremity Prosthetic Industry Revenue Share (%), by Country 2024 & 2032
- Figure 20: Europe Upper Extremity Prosthetic Industry Revenue (Million), by Device Type 2024 & 2032
- Figure 21: Europe Upper Extremity Prosthetic Industry Revenue Share (%), by Device Type 2024 & 2032
- Figure 22: Europe Upper Extremity Prosthetic Industry Revenue (Million), by Component 2024 & 2032
- Figure 23: Europe Upper Extremity Prosthetic Industry Revenue Share (%), by Component 2024 & 2032
- Figure 24: Europe Upper Extremity Prosthetic Industry Revenue (Million), by End User 2024 & 2032
- Figure 25: Europe Upper Extremity Prosthetic Industry Revenue Share (%), by End User 2024 & 2032
- Figure 26: Europe Upper Extremity Prosthetic Industry Revenue (Million), by Country 2024 & 2032
- Figure 27: Europe Upper Extremity Prosthetic Industry Revenue Share (%), by Country 2024 & 2032
- Figure 28: Asia Pacific Upper Extremity Prosthetic Industry Revenue (Million), by Device Type 2024 & 2032
- Figure 29: Asia Pacific Upper Extremity Prosthetic Industry Revenue Share (%), by Device Type 2024 & 2032
- Figure 30: Asia Pacific Upper Extremity Prosthetic Industry Revenue (Million), by Component 2024 & 2032
- Figure 31: Asia Pacific Upper Extremity Prosthetic Industry Revenue Share (%), by Component 2024 & 2032
- Figure 32: Asia Pacific Upper Extremity Prosthetic Industry Revenue (Million), by End User 2024 & 2032
- Figure 33: Asia Pacific Upper Extremity Prosthetic Industry Revenue Share (%), by End User 2024 & 2032
- Figure 34: Asia Pacific Upper Extremity Prosthetic Industry Revenue (Million), by Country 2024 & 2032
- Figure 35: Asia Pacific Upper Extremity Prosthetic Industry Revenue Share (%), by Country 2024 & 2032
- Figure 36: Middle East and Africa Upper Extremity Prosthetic Industry Revenue (Million), by Device Type 2024 & 2032
- Figure 37: Middle East and Africa Upper Extremity Prosthetic Industry Revenue Share (%), by Device Type 2024 & 2032
- Figure 38: Middle East and Africa Upper Extremity Prosthetic Industry Revenue (Million), by Component 2024 & 2032
- Figure 39: Middle East and Africa Upper Extremity Prosthetic Industry Revenue Share (%), by Component 2024 & 2032
- Figure 40: Middle East and Africa Upper Extremity Prosthetic Industry Revenue (Million), by End User 2024 & 2032
- Figure 41: Middle East and Africa Upper Extremity Prosthetic Industry Revenue Share (%), by End User 2024 & 2032
- Figure 42: Middle East and Africa Upper Extremity Prosthetic Industry Revenue (Million), by Country 2024 & 2032
- Figure 43: Middle East and Africa Upper Extremity Prosthetic Industry Revenue Share (%), by Country 2024 & 2032
- Figure 44: South America Upper Extremity Prosthetic Industry Revenue (Million), by Device Type 2024 & 2032
- Figure 45: South America Upper Extremity Prosthetic Industry Revenue Share (%), by Device Type 2024 & 2032
- Figure 46: South America Upper Extremity Prosthetic Industry Revenue (Million), by Component 2024 & 2032
- Figure 47: South America Upper Extremity Prosthetic Industry Revenue Share (%), by Component 2024 & 2032
- Figure 48: South America Upper Extremity Prosthetic Industry Revenue (Million), by End User 2024 & 2032
- Figure 49: South America Upper Extremity Prosthetic Industry Revenue Share (%), by End User 2024 & 2032
- Figure 50: South America Upper Extremity Prosthetic Industry Revenue (Million), by Country 2024 & 2032
- Figure 51: South America Upper Extremity Prosthetic Industry Revenue Share (%), by Country 2024 & 2032
List of Tables
- Table 1: Global Upper Extremity Prosthetic Industry Revenue Million Forecast, by Region 2019 & 2032
- Table 2: Global Upper Extremity Prosthetic Industry Revenue Million Forecast, by Device Type 2019 & 2032
- Table 3: Global Upper Extremity Prosthetic Industry Revenue Million Forecast, by Component 2019 & 2032
- Table 4: Global Upper Extremity Prosthetic Industry Revenue Million Forecast, by End User 2019 & 2032
- Table 5: Global Upper Extremity Prosthetic Industry Revenue Million Forecast, by Region 2019 & 2032
- Table 6: Global Upper Extremity Prosthetic Industry Revenue Million Forecast, by Country 2019 & 2032
- Table 7: United States Upper Extremity Prosthetic Industry Revenue (Million) Forecast, by Application 2019 & 2032
- Table 8: Canada Upper Extremity Prosthetic Industry Revenue (Million) Forecast, by Application 2019 & 2032
- Table 9: Mexico Upper Extremity Prosthetic Industry Revenue (Million) Forecast, by Application 2019 & 2032
- Table 10: Global Upper Extremity Prosthetic Industry Revenue Million Forecast, by Country 2019 & 2032
- Table 11: Germany Upper Extremity Prosthetic Industry Revenue (Million) Forecast, by Application 2019 & 2032
- Table 12: United Kingdom Upper Extremity Prosthetic Industry Revenue (Million) Forecast, by Application 2019 & 2032
- Table 13: France Upper Extremity Prosthetic Industry Revenue (Million) Forecast, by Application 2019 & 2032
- Table 14: Italy Upper Extremity Prosthetic Industry Revenue (Million) Forecast, by Application 2019 & 2032
- Table 15: Spain Upper Extremity Prosthetic Industry Revenue (Million) Forecast, by Application 2019 & 2032
- Table 16: Rest of Europe Upper Extremity Prosthetic Industry Revenue (Million) Forecast, by Application 2019 & 2032
- Table 17: Global Upper Extremity Prosthetic Industry Revenue Million Forecast, by Country 2019 & 2032
- Table 18: China Upper Extremity Prosthetic Industry Revenue (Million) Forecast, by Application 2019 & 2032
- Table 19: Japan Upper Extremity Prosthetic Industry Revenue (Million) Forecast, by Application 2019 & 2032
- Table 20: India Upper Extremity Prosthetic Industry Revenue (Million) Forecast, by Application 2019 & 2032
- Table 21: Australia Upper Extremity Prosthetic Industry Revenue (Million) Forecast, by Application 2019 & 2032
- Table 22: South Korea Upper Extremity Prosthetic Industry Revenue (Million) Forecast, by Application 2019 & 2032
- Table 23: Rest of Asia Pacific Upper Extremity Prosthetic Industry Revenue (Million) Forecast, by Application 2019 & 2032
- Table 24: Global Upper Extremity Prosthetic Industry Revenue Million Forecast, by Country 2019 & 2032
- Table 25: GCC Upper Extremity Prosthetic Industry Revenue (Million) Forecast, by Application 2019 & 2032
- Table 26: South Africa Upper Extremity Prosthetic Industry Revenue (Million) Forecast, by Application 2019 & 2032
- Table 27: Rest of Middle East and Africa Upper Extremity Prosthetic Industry Revenue (Million) Forecast, by Application 2019 & 2032
- Table 28: Global Upper Extremity Prosthetic Industry Revenue Million Forecast, by Country 2019 & 2032
- Table 29: Brazil Upper Extremity Prosthetic Industry Revenue (Million) Forecast, by Application 2019 & 2032
- Table 30: Argentina Upper Extremity Prosthetic Industry Revenue (Million) Forecast, by Application 2019 & 2032
- Table 31: Rest of South America Upper Extremity Prosthetic Industry Revenue (Million) Forecast, by Application 2019 & 2032
- Table 32: Global Upper Extremity Prosthetic Industry Revenue Million Forecast, by Device Type 2019 & 2032
- Table 33: Global Upper Extremity Prosthetic Industry Revenue Million Forecast, by Component 2019 & 2032
- Table 34: Global Upper Extremity Prosthetic Industry Revenue Million Forecast, by End User 2019 & 2032
- Table 35: Global Upper Extremity Prosthetic Industry Revenue Million Forecast, by Country 2019 & 2032
- Table 36: United States Upper Extremity Prosthetic Industry Revenue (Million) Forecast, by Application 2019 & 2032
- Table 37: Canada Upper Extremity Prosthetic Industry Revenue (Million) Forecast, by Application 2019 & 2032
- Table 38: Mexico Upper Extremity Prosthetic Industry Revenue (Million) Forecast, by Application 2019 & 2032
- Table 39: Global Upper Extremity Prosthetic Industry Revenue Million Forecast, by Device Type 2019 & 2032
- Table 40: Global Upper Extremity Prosthetic Industry Revenue Million Forecast, by Component 2019 & 2032
- Table 41: Global Upper Extremity Prosthetic Industry Revenue Million Forecast, by End User 2019 & 2032
- Table 42: Global Upper Extremity Prosthetic Industry Revenue Million Forecast, by Country 2019 & 2032
- Table 43: Germany Upper Extremity Prosthetic Industry Revenue (Million) Forecast, by Application 2019 & 2032
- Table 44: United Kingdom Upper Extremity Prosthetic Industry Revenue (Million) Forecast, by Application 2019 & 2032
- Table 45: France Upper Extremity Prosthetic Industry Revenue (Million) Forecast, by Application 2019 & 2032
- Table 46: Italy Upper Extremity Prosthetic Industry Revenue (Million) Forecast, by Application 2019 & 2032
- Table 47: Spain Upper Extremity Prosthetic Industry Revenue (Million) Forecast, by Application 2019 & 2032
- Table 48: Rest of Europe Upper Extremity Prosthetic Industry Revenue (Million) Forecast, by Application 2019 & 2032
- Table 49: Global Upper Extremity Prosthetic Industry Revenue Million Forecast, by Device Type 2019 & 2032
- Table 50: Global Upper Extremity Prosthetic Industry Revenue Million Forecast, by Component 2019 & 2032
- Table 51: Global Upper Extremity Prosthetic Industry Revenue Million Forecast, by End User 2019 & 2032
- Table 52: Global Upper Extremity Prosthetic Industry Revenue Million Forecast, by Country 2019 & 2032
- Table 53: China Upper Extremity Prosthetic Industry Revenue (Million) Forecast, by Application 2019 & 2032
- Table 54: Japan Upper Extremity Prosthetic Industry Revenue (Million) Forecast, by Application 2019 & 2032
- Table 55: India Upper Extremity Prosthetic Industry Revenue (Million) Forecast, by Application 2019 & 2032
- Table 56: Australia Upper Extremity Prosthetic Industry Revenue (Million) Forecast, by Application 2019 & 2032
- Table 57: South Korea Upper Extremity Prosthetic Industry Revenue (Million) Forecast, by Application 2019 & 2032
- Table 58: Rest of Asia Pacific Upper Extremity Prosthetic Industry Revenue (Million) Forecast, by Application 2019 & 2032
- Table 59: Global Upper Extremity Prosthetic Industry Revenue Million Forecast, by Device Type 2019 & 2032
- Table 60: Global Upper Extremity Prosthetic Industry Revenue Million Forecast, by Component 2019 & 2032
- Table 61: Global Upper Extremity Prosthetic Industry Revenue Million Forecast, by End User 2019 & 2032
- Table 62: Global Upper Extremity Prosthetic Industry Revenue Million Forecast, by Country 2019 & 2032
- Table 63: GCC Upper Extremity Prosthetic Industry Revenue (Million) Forecast, by Application 2019 & 2032
- Table 64: South Africa Upper Extremity Prosthetic Industry Revenue (Million) Forecast, by Application 2019 & 2032
- Table 65: Rest of Middle East and Africa Upper Extremity Prosthetic Industry Revenue (Million) Forecast, by Application 2019 & 2032
- Table 66: Global Upper Extremity Prosthetic Industry Revenue Million Forecast, by Device Type 2019 & 2032
- Table 67: Global Upper Extremity Prosthetic Industry Revenue Million Forecast, by Component 2019 & 2032
- Table 68: Global Upper Extremity Prosthetic Industry Revenue Million Forecast, by End User 2019 & 2032
- Table 69: Global Upper Extremity Prosthetic Industry Revenue Million Forecast, by Country 2019 & 2032
- Table 70: Brazil Upper Extremity Prosthetic Industry Revenue (Million) Forecast, by Application 2019 & 2032
- Table 71: Argentina Upper Extremity Prosthetic Industry Revenue (Million) Forecast, by Application 2019 & 2032
- Table 72: Rest of South America Upper Extremity Prosthetic Industry Revenue (Million) Forecast, by Application 2019 & 2032
Frequently Asked Questions
1. What is the projected Compound Annual Growth Rate (CAGR) of the Upper Extremity Prosthetic Industry?
The projected CAGR is approximately 5.50%.
2. Which companies are prominent players in the Upper Extremity Prosthetic Industry?
Key companies in the market include Steeper Inc, Protunix, Ossur, Ottobock SE & Co KgaA, Blatchford Limited (Endolite India Ltd), WillowWood Global LLC, Fillauer LLC, Open Bionics Ltd*List Not Exhaustive, Ortho Europe, COAPT LLC.
3. What are the main segments of the Upper Extremity Prosthetic Industry?
The market segments include Device Type, Component, End User.
4. Can you provide details about the market size?
The market size is estimated to be USD XX Million as of 2022.
5. What are some drivers contributing to market growth?
Increasing Number of Serious Injuries and Rise in Number of Amputations; Technological Advancements.
6. What are the notable trends driving market growth?
Myoelectric Expected to Hold Significant Share in the Upper Limb Prosthetics Market.
7. Are there any restraints impacting market growth?
High Prices of Prosthetics; Lack of Awareness in Developing Regions.
8. Can you provide examples of recent developments in the market?
In July 2021, stryker launched the Tornier shoulder arthroplasty portfolio and launched its Tornier product, the Perform Humeral Stem, which is designed with four collar diameters and is available in multiple lengths to optimize humeral fit and give surgeons the power to perform and the options to choose.
9. What pricing options are available for accessing the report?
Pricing options include single-user, multi-user, and enterprise licenses priced at USD 4750, USD 5250, and USD 8750 respectively.
10. Is the market size provided in terms of value or volume?
The market size is provided in terms of value, measured in Million.
11. Are there any specific market keywords associated with the report?
Yes, the market keyword associated with the report is "Upper Extremity Prosthetic Industry," which aids in identifying and referencing the specific market segment covered.
12. How do I determine which pricing option suits my needs best?
The pricing options vary based on user requirements and access needs. Individual users may opt for single-user licenses, while businesses requiring broader access may choose multi-user or enterprise licenses for cost-effective access to the report.
13. Are there any additional resources or data provided in the Upper Extremity Prosthetic Industry report?
While the report offers comprehensive insights, it's advisable to review the specific contents or supplementary materials provided to ascertain if additional resources or data are available.
14. How can I stay updated on further developments or reports in the Upper Extremity Prosthetic Industry?
To stay informed about further developments, trends, and reports in the Upper Extremity Prosthetic Industry, consider subscribing to industry newsletters, following relevant companies and organizations, or regularly checking reputable industry news sources and publications.
Methodology
Step 1 - Identification of Relevant Samples Size from Population Database


Step 2 - Approaches for Defining Global Market Size (Value, Volume* & Price*)

Note*: In applicable scenarios
Step 3 - Data Sources
Primary Research
- Web Analytics
- Survey Reports
- Research Institute
- Latest Research Reports
- Opinion Leaders
Secondary Research
- Annual Reports
- White Paper
- Latest Press Release
- Industry Association
- Paid Database
- Investor Presentations

Step 4 - Data Triangulation
Involves using different sources of information in order to increase the validity of a study
These sources are likely to be stakeholders in a program - participants, other researchers, program staff, other community members, and so on.
Then we put all data in single framework & apply various statistical tools to find out the dynamic on the market.
During the analysis stage, feedback from the stakeholder groups would be compared to determine areas of agreement as well as areas of divergence


