
Key Insights
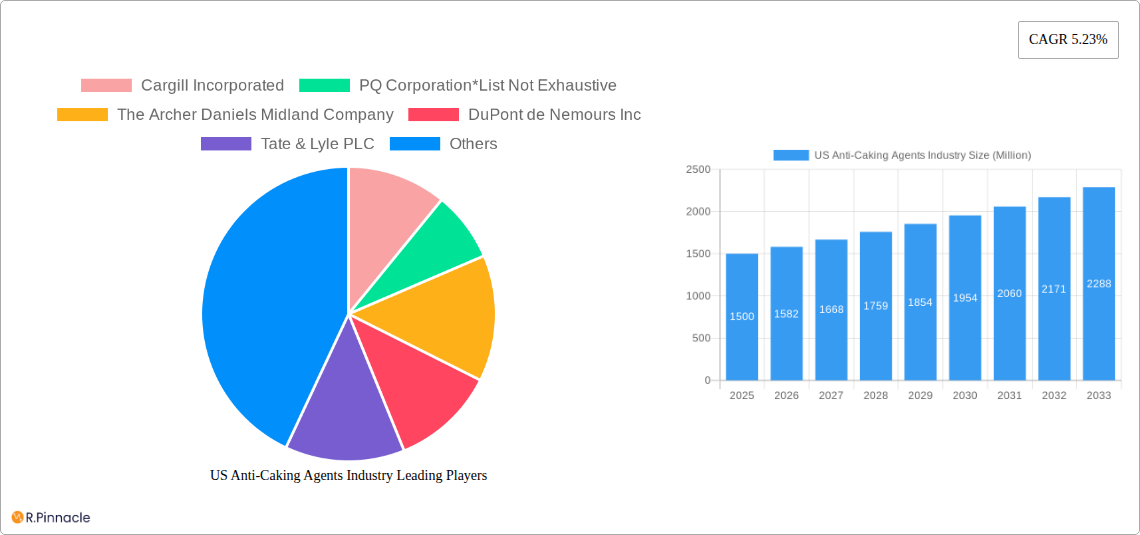
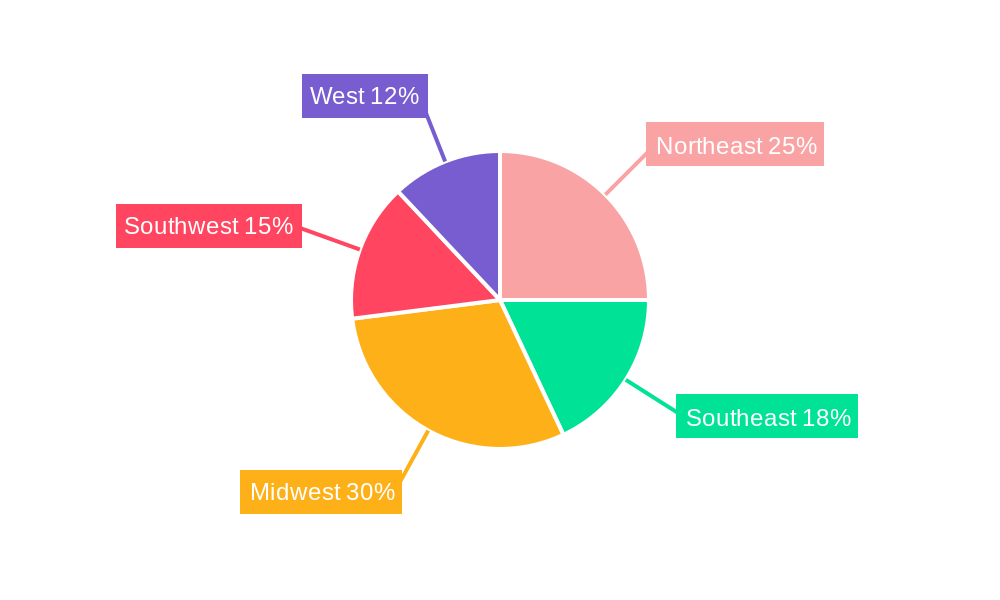
The US anti-caking agents market, valued at approximately $1.5 billion in 2025, is projected to experience robust growth, driven by increasing demand across diverse sectors. The food and beverage industry remains a major consumer, utilizing anti-caking agents to enhance the flowability and shelf life of powders, spices, and other products. The cosmetic and personal care sector also contributes significantly, incorporating these agents into powders, makeup, and other formulations to prevent clumping and improve texture. Growth is further fueled by the expansion of the feed industry, with anti-caking agents enhancing the quality and efficiency of animal feed. Calcium compounds, due to their cost-effectiveness and widespread applications, dominate the market in terms of type. However, the market is witnessing a rising demand for magnesium compounds owing to their superior functionality in certain applications and growing awareness of their health benefits. Geographic distribution shows considerable concentration in the Midwest and Northeast regions of the US, owing to established food processing and manufacturing hubs. While challenges like stringent regulations and fluctuating raw material prices exist, ongoing innovation in agent formulations, targeting more natural and sustainable options, is expected to drive continued market expansion.
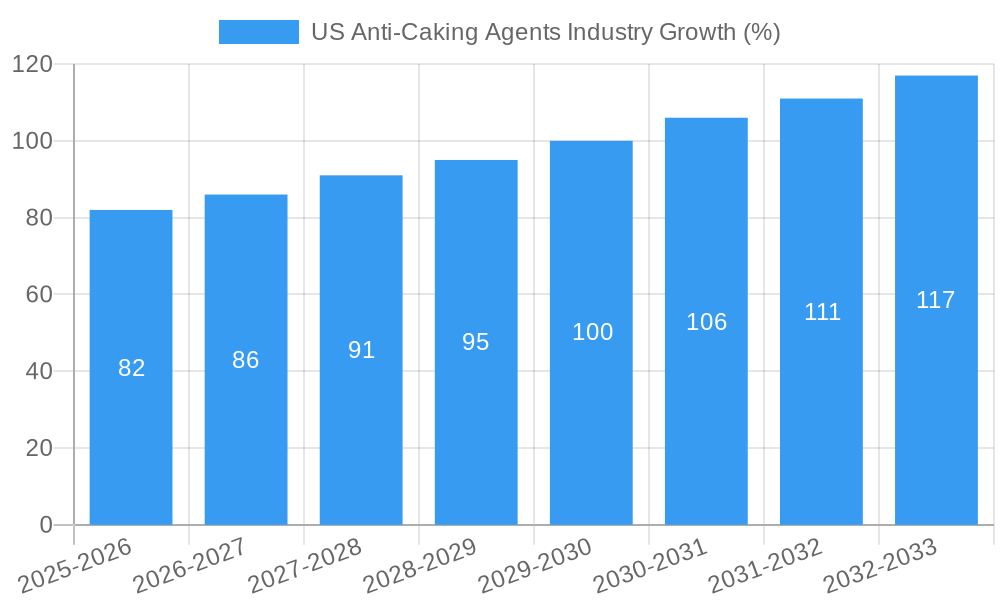
The forecast period (2025-2033) anticipates a compound annual growth rate (CAGR) of 5.23%, resulting in a projected market value exceeding $2.5 billion by 2033. Key players like Cargill, ADM, DuPont, and BASF are investing in research and development to enhance product efficacy and explore new applications. The market's growth is also influenced by consumer preferences shifting towards convenience and longer shelf-life products, which are largely dependent on effective anti-caking agents. Competition is likely to intensify as smaller players innovate and enter the market, leading to further product diversification and price optimization. The market is segmented based on both compound type and application, offering opportunities for specialized product development and targeted marketing strategies across different sectors.
US Anti-Caking Agents Industry Report: 2019-2033
This comprehensive report provides an in-depth analysis of the US anti-caking agents industry, covering market size, growth trends, competitive landscape, and future outlook. The study period spans from 2019 to 2033, with 2025 serving as the base and estimated year. The report is essential for industry professionals, investors, and researchers seeking actionable insights into this dynamic market.
US Anti-Caking Agents Industry Market Structure & Innovation Trends
This section analyzes the competitive landscape of the US anti-caking agents market, focusing on market concentration, innovation drivers, regulatory frameworks, and mergers & acquisitions (M&A) activity. The market is moderately concentrated, with key players like Cargill Incorporated, PQ Corporation, The Archer Daniels Midland Company, DuPont de Nemours Inc, Tate & Lyle PLC, BASF SE, Imac Inc, and Agropur Ingredients holding significant market share. However, the presence of numerous smaller players indicates a competitive environment. The estimated market share for Cargill in 2025 is xx%, while BASF holds approximately xx%. M&A activity has been significant, with notable deals like Cargill's acquisition of Penford Products in 2021, boosting their market position. The total value of M&A deals in the industry between 2019 and 2024 is estimated at $xx Million.
- Market Concentration: Moderately concentrated, with a few major players and numerous smaller participants.
- Innovation Drivers: Growing demand for natural and organic anti-caking agents, stringent regulations, and the need for improved product performance.
- Regulatory Framework: Compliance with FDA regulations and other relevant standards significantly impacts market dynamics.
- Product Substitutes: Limited direct substitutes exist, but alternative processing techniques can sometimes reduce the need for anti-caking agents.
- End-User Demographics: The primary end-users are food and beverage manufacturers, cosmetic and personal care companies, and feed producers.
- M&A Activity: Significant M&A activity has shaped the market landscape, driving consolidation and increasing the market share of leading players.
US Anti-Caking Agents Industry Market Dynamics & Trends
The US anti-caking agents market is experiencing robust growth, driven by factors like the increasing demand for processed food, growth of the cosmetic and personal care industries, and the rising demand for animal feed. Technological advancements such as the development of novel anti-caking agents with enhanced performance characteristics further fuel market expansion. Consumer preference for natural and organic products is also a key driver, leading to increased demand for naturally sourced anti-caking agents. The market is projected to witness a CAGR of xx% during the forecast period (2025-2033), with market penetration in the food and beverage sector exceeding xx% by 2033. Competitive dynamics are characterized by intense competition among major players, focused on product innovation, cost optimization, and strategic partnerships.
Dominant Regions & Segments in US Anti-Caking Agents Industry
The food and beverage sector represents the largest segment of the US anti-caking agents market, driven by the high consumption of processed food products. Calcium compounds constitute the largest type segment, owing to their cost-effectiveness and widespread use. The Midwest region of the US is expected to dominate the market due to its established food processing industry and presence of key manufacturers.
- Key Drivers in Food & Beverage Segment:
- High demand for processed foods.
- Growing consumer preference for convenience foods.
- Increasing disposable incomes.
- Key Drivers in Calcium Compounds Segment:
- Cost-effectiveness.
- Wide availability.
- Excellent anti-caking properties.
- Midwest Region Dominance:
- Established food processing infrastructure.
- Concentration of key industry players.
- Strong agricultural base.
Detailed analysis of market dominance reveals that the Midwestern states in the US benefit from a strong food processing industry and a well-established supply chain for raw materials. This region houses multiple significant manufacturers, contributing significantly to the sector's robust market share.
US Anti-Caking Agents Industry Product Innovations
Recent innovations in anti-caking agents focus on developing environmentally friendly, natural, and organic solutions. Companies are investing in research and development to create high-performance anti-caking agents that meet the stringent demands of various industries, including improved efficacy, extended shelf life, and enhanced safety profiles. These innovations aim to cater to the growing consumer preference for natural and organic products.
Report Scope & Segmentation Analysis
The report comprehensively segments the US anti-caking agents market by type (Calcium Compounds, Sodium Compounds, Magnesium Compounds, Others) and application (Food and Beverage, Cosmetic and Personal Care, Feed, Others). Each segment is analyzed based on historical data (2019-2024), current estimates (2025), and future projections (2025-2033). Growth projections, market sizes, and competitive dynamics are detailed for each segment, providing a granular understanding of the market structure.
Key Drivers of US Anti-Caking Agents Industry Growth
The growth of the US anti-caking agents market is primarily driven by the increasing demand for processed foods, the expansion of the cosmetic and personal care industries, and the growing animal feed sector. Government regulations promoting food safety and quality further fuel market growth. The rising disposable income and changing consumer preferences are also significant contributing factors.
Challenges in the US Anti-Caking Agents Industry Sector
The industry faces challenges such as stringent regulatory compliance, fluctuating raw material prices, and intense competition. Supply chain disruptions and potential economic downturns can also impact market growth. These factors can lead to price volatility and affect the profitability of manufacturers. For example, a xx% increase in raw material costs in 2022 resulted in a xx% reduction in profit margins for some companies.
Emerging Opportunities in US Anti-Caking Agents Industry
Emerging opportunities exist in the development of novel, sustainable anti-caking agents and expansion into new application areas, such as pharmaceuticals and industrial applications. Demand for organic and natural anti-caking agents is anticipated to increase, creating growth opportunities for manufacturers who can meet these needs. Furthermore, exploring emerging markets and strategic collaborations can enhance market penetration and brand presence.
Leading Players in the US Anti-Caking Agents Industry Market
- Cargill Incorporated
- PQ Corporation
- The Archer Daniels Midland Company
- DuPont de Nemours Inc
- Tate & Lyle PLC
- BASF SE
- Imac Inc
- Agropur Ingredients
Key Developments in US Anti-Caking Agents Industry
- 2021 (October): Cargill acquired Penford Products, expanding its portfolio of anti-caking agents and market share.
- 2022 (March): BASF launched a new line of organic anti-caking agents, catering to growing consumer demand for natural products.
- 2023 (June): PQ Corporation announced a joint venture to expand its production capacity in Asia, strengthening its global presence.
Future Outlook for US Anti-Caking Agents Industry Market
The future outlook for the US anti-caking agents market is positive, driven by sustained growth in key end-use sectors and the continuous development of innovative, high-performance products. Strategic partnerships, expansions into new markets, and a focus on sustainability are key elements of the market’s future trajectory. The market is poised for significant growth due to the increasing demand for processed foods, the growth of the cosmetics and personal care industry, and the expansion of the animal feed sector. The continued focus on product innovation will further support industry expansion.
US Anti-Caking Agents Industry Segmentation
-
1. Type
- 1.1. Calcium Compounds
- 1.2. Sodium Compounds
- 1.3. Magnesium Compounds
- 1.4. Others
-
2. Application
-
2.1. Food and Beverage
- 2.1.1. Bakery Products
- 2.1.2. Dairy Products
- 2.1.3. Soups & Sauces
- 2.1.4. Beverages
- 2.1.5. Others
- 2.2. Cosmetic and Personal Care
- 2.3. Feed
-
2.1. Food and Beverage
US Anti-Caking Agents Industry Segmentation By Geography
-
1. North America
- 1.1. United States
- 1.2. Canada
- 1.3. Mexico
-
2. South America
- 2.1. Brazil
- 2.2. Argentina
- 2.3. Rest of South America
-
3. Europe
- 3.1. United Kingdom
- 3.2. Germany
- 3.3. France
- 3.4. Italy
- 3.5. Spain
- 3.6. Russia
- 3.7. Benelux
- 3.8. Nordics
- 3.9. Rest of Europe
-
4. Middle East & Africa
- 4.1. Turkey
- 4.2. Israel
- 4.3. GCC
- 4.4. North Africa
- 4.5. South Africa
- 4.6. Rest of Middle East & Africa
-
5. Asia Pacific
- 5.1. China
- 5.2. India
- 5.3. Japan
- 5.4. South Korea
- 5.5. ASEAN
- 5.6. Oceania
- 5.7. Rest of Asia Pacific
US Anti-Caking Agents Industry REPORT HIGHLIGHTS
| Aspects | Details |
|---|---|
| Study Period | 2019-2033 |
| Base Year | 2024 |
| Estimated Year | 2025 |
| Forecast Period | 2025-2033 |
| Historical Period | 2019-2024 |
| Growth Rate | CAGR of 5.23% from 2019-2033 |
| Segmentation |
|
Table of Contents
- 1. Introduction
- 1.1. Research Scope
- 1.2. Market Segmentation
- 1.3. Research Methodology
- 1.4. Definitions and Assumptions
- 2. Executive Summary
- 2.1. Introduction
- 3. Market Dynamics
- 3.1. Introduction
- 3.2. Market Drivers
- 3.2.1. Wide Applications and Functionality; Demand For Gluten-Free Products
- 3.3. Market Restrains
- 3.3.1. Easy Availability of Economically Feasible Alternatives
- 3.4. Market Trends
- 3.4.1. Calcium Compounds Holds a Significant Share
- 4. Market Factor Analysis
- 4.1. Porters Five Forces
- 4.2. Supply/Value Chain
- 4.3. PESTEL analysis
- 4.4. Market Entropy
- 4.5. Patent/Trademark Analysis
- 5. Global US Anti-Caking Agents Industry Analysis, Insights and Forecast, 2019-2031
- 5.1. Market Analysis, Insights and Forecast - by Type
- 5.1.1. Calcium Compounds
- 5.1.2. Sodium Compounds
- 5.1.3. Magnesium Compounds
- 5.1.4. Others
- 5.2. Market Analysis, Insights and Forecast - by Application
- 5.2.1. Food and Beverage
- 5.2.1.1. Bakery Products
- 5.2.1.2. Dairy Products
- 5.2.1.3. Soups & Sauces
- 5.2.1.4. Beverages
- 5.2.1.5. Others
- 5.2.2. Cosmetic and Personal Care
- 5.2.3. Feed
- 5.2.1. Food and Beverage
- 5.3. Market Analysis, Insights and Forecast - by Region
- 5.3.1. North America
- 5.3.2. South America
- 5.3.3. Europe
- 5.3.4. Middle East & Africa
- 5.3.5. Asia Pacific
- 5.1. Market Analysis, Insights and Forecast - by Type
- 6. North America US Anti-Caking Agents Industry Analysis, Insights and Forecast, 2019-2031
- 6.1. Market Analysis, Insights and Forecast - by Type
- 6.1.1. Calcium Compounds
- 6.1.2. Sodium Compounds
- 6.1.3. Magnesium Compounds
- 6.1.4. Others
- 6.2. Market Analysis, Insights and Forecast - by Application
- 6.2.1. Food and Beverage
- 6.2.1.1. Bakery Products
- 6.2.1.2. Dairy Products
- 6.2.1.3. Soups & Sauces
- 6.2.1.4. Beverages
- 6.2.1.5. Others
- 6.2.2. Cosmetic and Personal Care
- 6.2.3. Feed
- 6.2.1. Food and Beverage
- 6.1. Market Analysis, Insights and Forecast - by Type
- 7. South America US Anti-Caking Agents Industry Analysis, Insights and Forecast, 2019-2031
- 7.1. Market Analysis, Insights and Forecast - by Type
- 7.1.1. Calcium Compounds
- 7.1.2. Sodium Compounds
- 7.1.3. Magnesium Compounds
- 7.1.4. Others
- 7.2. Market Analysis, Insights and Forecast - by Application
- 7.2.1. Food and Beverage
- 7.2.1.1. Bakery Products
- 7.2.1.2. Dairy Products
- 7.2.1.3. Soups & Sauces
- 7.2.1.4. Beverages
- 7.2.1.5. Others
- 7.2.2. Cosmetic and Personal Care
- 7.2.3. Feed
- 7.2.1. Food and Beverage
- 7.1. Market Analysis, Insights and Forecast - by Type
- 8. Europe US Anti-Caking Agents Industry Analysis, Insights and Forecast, 2019-2031
- 8.1. Market Analysis, Insights and Forecast - by Type
- 8.1.1. Calcium Compounds
- 8.1.2. Sodium Compounds
- 8.1.3. Magnesium Compounds
- 8.1.4. Others
- 8.2. Market Analysis, Insights and Forecast - by Application
- 8.2.1. Food and Beverage
- 8.2.1.1. Bakery Products
- 8.2.1.2. Dairy Products
- 8.2.1.3. Soups & Sauces
- 8.2.1.4. Beverages
- 8.2.1.5. Others
- 8.2.2. Cosmetic and Personal Care
- 8.2.3. Feed
- 8.2.1. Food and Beverage
- 8.1. Market Analysis, Insights and Forecast - by Type
- 9. Middle East & Africa US Anti-Caking Agents Industry Analysis, Insights and Forecast, 2019-2031
- 9.1. Market Analysis, Insights and Forecast - by Type
- 9.1.1. Calcium Compounds
- 9.1.2. Sodium Compounds
- 9.1.3. Magnesium Compounds
- 9.1.4. Others
- 9.2. Market Analysis, Insights and Forecast - by Application
- 9.2.1. Food and Beverage
- 9.2.1.1. Bakery Products
- 9.2.1.2. Dairy Products
- 9.2.1.3. Soups & Sauces
- 9.2.1.4. Beverages
- 9.2.1.5. Others
- 9.2.2. Cosmetic and Personal Care
- 9.2.3. Feed
- 9.2.1. Food and Beverage
- 9.1. Market Analysis, Insights and Forecast - by Type
- 10. Asia Pacific US Anti-Caking Agents Industry Analysis, Insights and Forecast, 2019-2031
- 10.1. Market Analysis, Insights and Forecast - by Type
- 10.1.1. Calcium Compounds
- 10.1.2. Sodium Compounds
- 10.1.3. Magnesium Compounds
- 10.1.4. Others
- 10.2. Market Analysis, Insights and Forecast - by Application
- 10.2.1. Food and Beverage
- 10.2.1.1. Bakery Products
- 10.2.1.2. Dairy Products
- 10.2.1.3. Soups & Sauces
- 10.2.1.4. Beverages
- 10.2.1.5. Others
- 10.2.2. Cosmetic and Personal Care
- 10.2.3. Feed
- 10.2.1. Food and Beverage
- 10.1. Market Analysis, Insights and Forecast - by Type
- 11. Northeast US Anti-Caking Agents Industry Analysis, Insights and Forecast, 2019-2031
- 12. Southeast US Anti-Caking Agents Industry Analysis, Insights and Forecast, 2019-2031
- 13. Midwest US Anti-Caking Agents Industry Analysis, Insights and Forecast, 2019-2031
- 14. Southwest US Anti-Caking Agents Industry Analysis, Insights and Forecast, 2019-2031
- 15. West US Anti-Caking Agents Industry Analysis, Insights and Forecast, 2019-2031
- 16. Competitive Analysis
- 16.1. Global Market Share Analysis 2024
- 16.2. Company Profiles
- 16.2.1 Cargill Incorporated
- 16.2.1.1. Overview
- 16.2.1.2. Products
- 16.2.1.3. SWOT Analysis
- 16.2.1.4. Recent Developments
- 16.2.1.5. Financials (Based on Availability)
- 16.2.2 PQ Corporation*List Not Exhaustive
- 16.2.2.1. Overview
- 16.2.2.2. Products
- 16.2.2.3. SWOT Analysis
- 16.2.2.4. Recent Developments
- 16.2.2.5. Financials (Based on Availability)
- 16.2.3 The Archer Daniels Midland Company
- 16.2.3.1. Overview
- 16.2.3.2. Products
- 16.2.3.3. SWOT Analysis
- 16.2.3.4. Recent Developments
- 16.2.3.5. Financials (Based on Availability)
- 16.2.4 DuPont de Nemours Inc
- 16.2.4.1. Overview
- 16.2.4.2. Products
- 16.2.4.3. SWOT Analysis
- 16.2.4.4. Recent Developments
- 16.2.4.5. Financials (Based on Availability)
- 16.2.5 Tate & Lyle PLC
- 16.2.5.1. Overview
- 16.2.5.2. Products
- 16.2.5.3. SWOT Analysis
- 16.2.5.4. Recent Developments
- 16.2.5.5. Financials (Based on Availability)
- 16.2.6 BASF SE
- 16.2.6.1. Overview
- 16.2.6.2. Products
- 16.2.6.3. SWOT Analysis
- 16.2.6.4. Recent Developments
- 16.2.6.5. Financials (Based on Availability)
- 16.2.7 Imac Inc
- 16.2.7.1. Overview
- 16.2.7.2. Products
- 16.2.7.3. SWOT Analysis
- 16.2.7.4. Recent Developments
- 16.2.7.5. Financials (Based on Availability)
- 16.2.8 Agropur Ingredients
- 16.2.8.1. Overview
- 16.2.8.2. Products
- 16.2.8.3. SWOT Analysis
- 16.2.8.4. Recent Developments
- 16.2.8.5. Financials (Based on Availability)
- 16.2.1 Cargill Incorporated
List of Figures
- Figure 1: Global US Anti-Caking Agents Industry Revenue Breakdown (Million, %) by Region 2024 & 2032
- Figure 2: United states US Anti-Caking Agents Industry Revenue (Million), by Country 2024 & 2032
- Figure 3: United states US Anti-Caking Agents Industry Revenue Share (%), by Country 2024 & 2032
- Figure 4: North America US Anti-Caking Agents Industry Revenue (Million), by Type 2024 & 2032
- Figure 5: North America US Anti-Caking Agents Industry Revenue Share (%), by Type 2024 & 2032
- Figure 6: North America US Anti-Caking Agents Industry Revenue (Million), by Application 2024 & 2032
- Figure 7: North America US Anti-Caking Agents Industry Revenue Share (%), by Application 2024 & 2032
- Figure 8: North America US Anti-Caking Agents Industry Revenue (Million), by Country 2024 & 2032
- Figure 9: North America US Anti-Caking Agents Industry Revenue Share (%), by Country 2024 & 2032
- Figure 10: South America US Anti-Caking Agents Industry Revenue (Million), by Type 2024 & 2032
- Figure 11: South America US Anti-Caking Agents Industry Revenue Share (%), by Type 2024 & 2032
- Figure 12: South America US Anti-Caking Agents Industry Revenue (Million), by Application 2024 & 2032
- Figure 13: South America US Anti-Caking Agents Industry Revenue Share (%), by Application 2024 & 2032
- Figure 14: South America US Anti-Caking Agents Industry Revenue (Million), by Country 2024 & 2032
- Figure 15: South America US Anti-Caking Agents Industry Revenue Share (%), by Country 2024 & 2032
- Figure 16: Europe US Anti-Caking Agents Industry Revenue (Million), by Type 2024 & 2032
- Figure 17: Europe US Anti-Caking Agents Industry Revenue Share (%), by Type 2024 & 2032
- Figure 18: Europe US Anti-Caking Agents Industry Revenue (Million), by Application 2024 & 2032
- Figure 19: Europe US Anti-Caking Agents Industry Revenue Share (%), by Application 2024 & 2032
- Figure 20: Europe US Anti-Caking Agents Industry Revenue (Million), by Country 2024 & 2032
- Figure 21: Europe US Anti-Caking Agents Industry Revenue Share (%), by Country 2024 & 2032
- Figure 22: Middle East & Africa US Anti-Caking Agents Industry Revenue (Million), by Type 2024 & 2032
- Figure 23: Middle East & Africa US Anti-Caking Agents Industry Revenue Share (%), by Type 2024 & 2032
- Figure 24: Middle East & Africa US Anti-Caking Agents Industry Revenue (Million), by Application 2024 & 2032
- Figure 25: Middle East & Africa US Anti-Caking Agents Industry Revenue Share (%), by Application 2024 & 2032
- Figure 26: Middle East & Africa US Anti-Caking Agents Industry Revenue (Million), by Country 2024 & 2032
- Figure 27: Middle East & Africa US Anti-Caking Agents Industry Revenue Share (%), by Country 2024 & 2032
- Figure 28: Asia Pacific US Anti-Caking Agents Industry Revenue (Million), by Type 2024 & 2032
- Figure 29: Asia Pacific US Anti-Caking Agents Industry Revenue Share (%), by Type 2024 & 2032
- Figure 30: Asia Pacific US Anti-Caking Agents Industry Revenue (Million), by Application 2024 & 2032
- Figure 31: Asia Pacific US Anti-Caking Agents Industry Revenue Share (%), by Application 2024 & 2032
- Figure 32: Asia Pacific US Anti-Caking Agents Industry Revenue (Million), by Country 2024 & 2032
- Figure 33: Asia Pacific US Anti-Caking Agents Industry Revenue Share (%), by Country 2024 & 2032
List of Tables
- Table 1: Global US Anti-Caking Agents Industry Revenue Million Forecast, by Region 2019 & 2032
- Table 2: Global US Anti-Caking Agents Industry Revenue Million Forecast, by Type 2019 & 2032
- Table 3: Global US Anti-Caking Agents Industry Revenue Million Forecast, by Application 2019 & 2032
- Table 4: Global US Anti-Caking Agents Industry Revenue Million Forecast, by Region 2019 & 2032
- Table 5: Global US Anti-Caking Agents Industry Revenue Million Forecast, by Country 2019 & 2032
- Table 6: Northeast US Anti-Caking Agents Industry Revenue (Million) Forecast, by Application 2019 & 2032
- Table 7: Southeast US Anti-Caking Agents Industry Revenue (Million) Forecast, by Application 2019 & 2032
- Table 8: Midwest US Anti-Caking Agents Industry Revenue (Million) Forecast, by Application 2019 & 2032
- Table 9: Southwest US Anti-Caking Agents Industry Revenue (Million) Forecast, by Application 2019 & 2032
- Table 10: West US Anti-Caking Agents Industry Revenue (Million) Forecast, by Application 2019 & 2032
- Table 11: Global US Anti-Caking Agents Industry Revenue Million Forecast, by Type 2019 & 2032
- Table 12: Global US Anti-Caking Agents Industry Revenue Million Forecast, by Application 2019 & 2032
- Table 13: Global US Anti-Caking Agents Industry Revenue Million Forecast, by Country 2019 & 2032
- Table 14: United States US Anti-Caking Agents Industry Revenue (Million) Forecast, by Application 2019 & 2032
- Table 15: Canada US Anti-Caking Agents Industry Revenue (Million) Forecast, by Application 2019 & 2032
- Table 16: Mexico US Anti-Caking Agents Industry Revenue (Million) Forecast, by Application 2019 & 2032
- Table 17: Global US Anti-Caking Agents Industry Revenue Million Forecast, by Type 2019 & 2032
- Table 18: Global US Anti-Caking Agents Industry Revenue Million Forecast, by Application 2019 & 2032
- Table 19: Global US Anti-Caking Agents Industry Revenue Million Forecast, by Country 2019 & 2032
- Table 20: Brazil US Anti-Caking Agents Industry Revenue (Million) Forecast, by Application 2019 & 2032
- Table 21: Argentina US Anti-Caking Agents Industry Revenue (Million) Forecast, by Application 2019 & 2032
- Table 22: Rest of South America US Anti-Caking Agents Industry Revenue (Million) Forecast, by Application 2019 & 2032
- Table 23: Global US Anti-Caking Agents Industry Revenue Million Forecast, by Type 2019 & 2032
- Table 24: Global US Anti-Caking Agents Industry Revenue Million Forecast, by Application 2019 & 2032
- Table 25: Global US Anti-Caking Agents Industry Revenue Million Forecast, by Country 2019 & 2032
- Table 26: United Kingdom US Anti-Caking Agents Industry Revenue (Million) Forecast, by Application 2019 & 2032
- Table 27: Germany US Anti-Caking Agents Industry Revenue (Million) Forecast, by Application 2019 & 2032
- Table 28: France US Anti-Caking Agents Industry Revenue (Million) Forecast, by Application 2019 & 2032
- Table 29: Italy US Anti-Caking Agents Industry Revenue (Million) Forecast, by Application 2019 & 2032
- Table 30: Spain US Anti-Caking Agents Industry Revenue (Million) Forecast, by Application 2019 & 2032
- Table 31: Russia US Anti-Caking Agents Industry Revenue (Million) Forecast, by Application 2019 & 2032
- Table 32: Benelux US Anti-Caking Agents Industry Revenue (Million) Forecast, by Application 2019 & 2032
- Table 33: Nordics US Anti-Caking Agents Industry Revenue (Million) Forecast, by Application 2019 & 2032
- Table 34: Rest of Europe US Anti-Caking Agents Industry Revenue (Million) Forecast, by Application 2019 & 2032
- Table 35: Global US Anti-Caking Agents Industry Revenue Million Forecast, by Type 2019 & 2032
- Table 36: Global US Anti-Caking Agents Industry Revenue Million Forecast, by Application 2019 & 2032
- Table 37: Global US Anti-Caking Agents Industry Revenue Million Forecast, by Country 2019 & 2032
- Table 38: Turkey US Anti-Caking Agents Industry Revenue (Million) Forecast, by Application 2019 & 2032
- Table 39: Israel US Anti-Caking Agents Industry Revenue (Million) Forecast, by Application 2019 & 2032
- Table 40: GCC US Anti-Caking Agents Industry Revenue (Million) Forecast, by Application 2019 & 2032
- Table 41: North Africa US Anti-Caking Agents Industry Revenue (Million) Forecast, by Application 2019 & 2032
- Table 42: South Africa US Anti-Caking Agents Industry Revenue (Million) Forecast, by Application 2019 & 2032
- Table 43: Rest of Middle East & Africa US Anti-Caking Agents Industry Revenue (Million) Forecast, by Application 2019 & 2032
- Table 44: Global US Anti-Caking Agents Industry Revenue Million Forecast, by Type 2019 & 2032
- Table 45: Global US Anti-Caking Agents Industry Revenue Million Forecast, by Application 2019 & 2032
- Table 46: Global US Anti-Caking Agents Industry Revenue Million Forecast, by Country 2019 & 2032
- Table 47: China US Anti-Caking Agents Industry Revenue (Million) Forecast, by Application 2019 & 2032
- Table 48: India US Anti-Caking Agents Industry Revenue (Million) Forecast, by Application 2019 & 2032
- Table 49: Japan US Anti-Caking Agents Industry Revenue (Million) Forecast, by Application 2019 & 2032
- Table 50: South Korea US Anti-Caking Agents Industry Revenue (Million) Forecast, by Application 2019 & 2032
- Table 51: ASEAN US Anti-Caking Agents Industry Revenue (Million) Forecast, by Application 2019 & 2032
- Table 52: Oceania US Anti-Caking Agents Industry Revenue (Million) Forecast, by Application 2019 & 2032
- Table 53: Rest of Asia Pacific US Anti-Caking Agents Industry Revenue (Million) Forecast, by Application 2019 & 2032
Frequently Asked Questions
1. What is the projected Compound Annual Growth Rate (CAGR) of the US Anti-Caking Agents Industry?
The projected CAGR is approximately 5.23%.
2. Which companies are prominent players in the US Anti-Caking Agents Industry?
Key companies in the market include Cargill Incorporated, PQ Corporation*List Not Exhaustive, The Archer Daniels Midland Company, DuPont de Nemours Inc, Tate & Lyle PLC, BASF SE, Imac Inc, Agropur Ingredients.
3. What are the main segments of the US Anti-Caking Agents Industry?
The market segments include Type, Application.
4. Can you provide details about the market size?
The market size is estimated to be USD XX Million as of 2022.
5. What are some drivers contributing to market growth?
Wide Applications and Functionality; Demand For Gluten-Free Products.
6. What are the notable trends driving market growth?
Calcium Compounds Holds a Significant Share.
7. Are there any restraints impacting market growth?
Easy Availability of Economically Feasible Alternatives.
8. Can you provide examples of recent developments in the market?
1. In 2021, Cargill acquired Penford Products, a leading provider of anti-caking agents for the food industry. 2. In 2022, BASF launched a new line of organic anti-caking agents for the food and beverage industry. 3. In 2023, PQ Corporation announced a joint venture with a Chinese company to expand its production of anti-caking agents in Asia.
9. What pricing options are available for accessing the report?
Pricing options include single-user, multi-user, and enterprise licenses priced at USD 3800, USD 4500, and USD 5800 respectively.
10. Is the market size provided in terms of value or volume?
The market size is provided in terms of value, measured in Million.
11. Are there any specific market keywords associated with the report?
Yes, the market keyword associated with the report is "US Anti-Caking Agents Industry," which aids in identifying and referencing the specific market segment covered.
12. How do I determine which pricing option suits my needs best?
The pricing options vary based on user requirements and access needs. Individual users may opt for single-user licenses, while businesses requiring broader access may choose multi-user or enterprise licenses for cost-effective access to the report.
13. Are there any additional resources or data provided in the US Anti-Caking Agents Industry report?
While the report offers comprehensive insights, it's advisable to review the specific contents or supplementary materials provided to ascertain if additional resources or data are available.
14. How can I stay updated on further developments or reports in the US Anti-Caking Agents Industry?
To stay informed about further developments, trends, and reports in the US Anti-Caking Agents Industry, consider subscribing to industry newsletters, following relevant companies and organizations, or regularly checking reputable industry news sources and publications.
Methodology
Step 1 - Identification of Relevant Samples Size from Population Database


Step 2 - Approaches for Defining Global Market Size (Value, Volume* & Price*)

Note*: In applicable scenarios
Step 3 - Data Sources
Primary Research
- Web Analytics
- Survey Reports
- Research Institute
- Latest Research Reports
- Opinion Leaders
Secondary Research
- Annual Reports
- White Paper
- Latest Press Release
- Industry Association
- Paid Database
- Investor Presentations

Step 4 - Data Triangulation
Involves using different sources of information in order to increase the validity of a study
These sources are likely to be stakeholders in a program - participants, other researchers, program staff, other community members, and so on.
Then we put all data in single framework & apply various statistical tools to find out the dynamic on the market.
During the analysis stage, feedback from the stakeholder groups would be compared to determine areas of agreement as well as areas of divergence


