
Key Insights
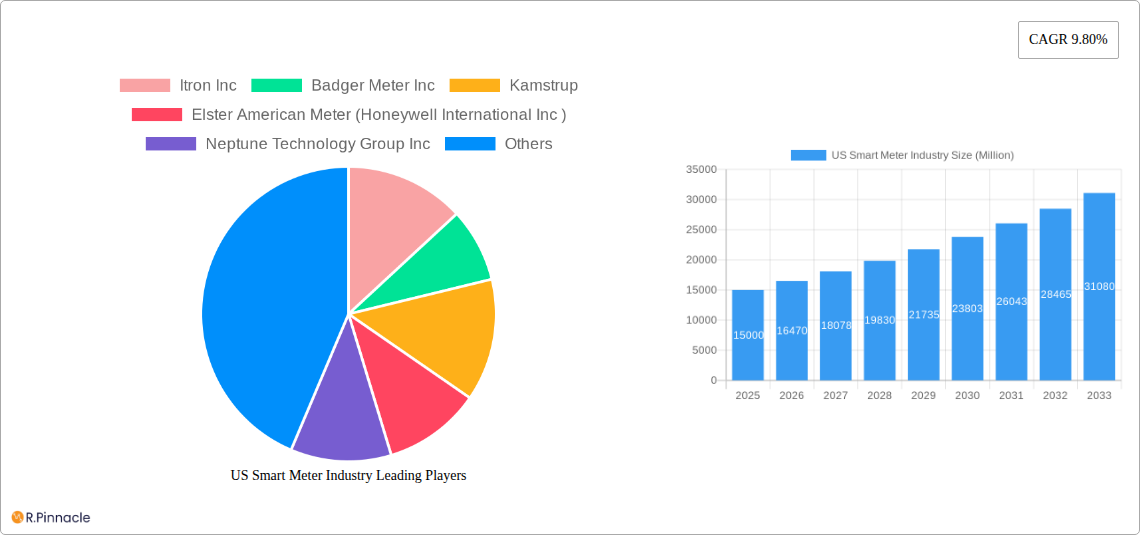
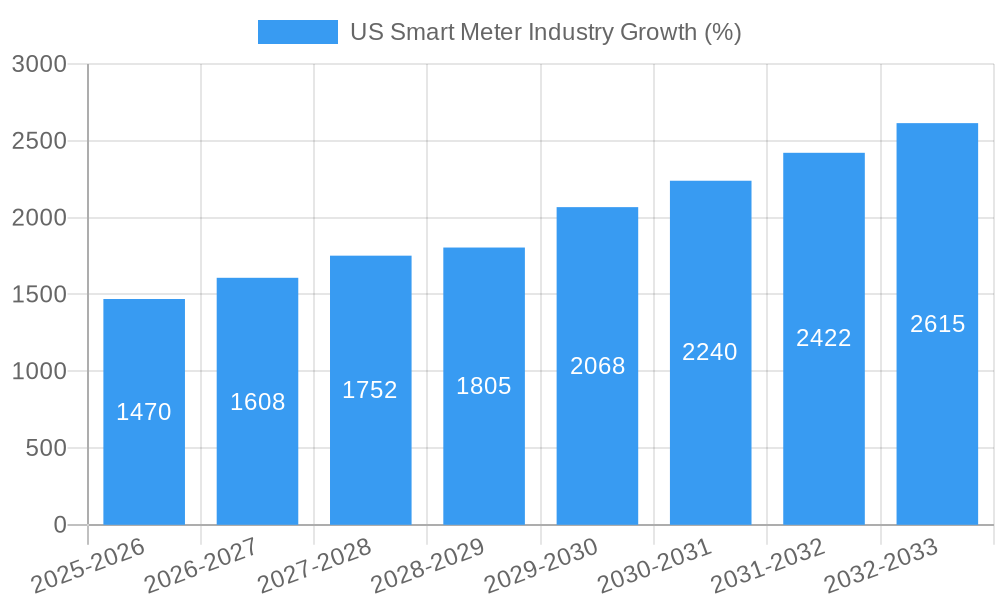
The US smart meter market, encompassing smart gas, water, and electricity meters for residential, commercial, and industrial sectors, is experiencing robust growth. Driven by increasing government mandates for energy efficiency, the expanding smart grid infrastructure, and a growing need for improved resource management, the market is projected to maintain a considerable Compound Annual Growth Rate (CAGR) exceeding 9.8% between 2025 and 2033. This growth is fueled by the transition to advanced metering infrastructure (AMI), which provides real-time data on energy consumption, enabling utilities to optimize grid operations, reduce energy losses, and enhance customer engagement through personalized consumption feedback. Furthermore, the integration of smart meters with home automation systems and the growing adoption of renewable energy sources are contributing to market expansion. Key players like Itron, Badger Meter, and Kamstrup are at the forefront of innovation, continuously developing advanced meter technologies with improved data accuracy, security features, and extended lifespan. The competition within the sector is driving technological advancements and cost reductions, making smart meters more accessible across different user segments. Regional variations exist, with states like California and New York, driven by aggressive renewable energy goals and strict environmental regulations, exhibiting higher adoption rates compared to others.
The segmentation of the market by type (gas, water, electricity) and end-user (residential, commercial, industrial) reveals differing growth trajectories. While electricity smart meters currently hold the largest market share, the smart gas and water meter segments are witnessing accelerated growth, driven by evolving regulations and an increasing awareness of water conservation. The residential segment accounts for a significant portion of the market, due to the sheer number of households, but commercial and industrial segments present lucrative opportunities, especially with the rise of energy-intensive industries adopting smart metering solutions for cost optimization and process efficiency. The competitive landscape is characterized by both established players and emerging technology providers, which encourages innovation and competitive pricing, ultimately benefiting consumers and facilitating broader market penetration. Considering the market's current trajectory and the aforementioned drivers, the US smart meter market is poised for continued significant expansion in the coming years.
US Smart Meter Industry Report: 2019-2033
This comprehensive report provides an in-depth analysis of the US smart meter industry, covering market size, segmentation, key players, growth drivers, challenges, and future outlook. The study period spans from 2019 to 2033, with 2025 as the base and estimated year. This report is crucial for industry professionals, investors, and stakeholders seeking actionable insights into this rapidly evolving market.
US Smart Meter Industry Market Structure & Innovation Trends
The US smart meter market exhibits a moderately concentrated structure, with key players like Itron Inc, Badger Meter Inc, and Kamstrup holding significant market share. The exact market share distribution for 2025 is estimated at xx%, xx%, and xx% respectively, while other players such as Elster American Meter (Honeywell International Inc), Neptune Technology Group Inc, Sensus USA Inc (Xylem Inc), General Electric Co, Diehl Metering US, and Mueller Systems LLC collectively account for the remaining xx%. Innovation is driven by increasing demand for improved grid efficiency, enhanced data analytics capabilities, and the integration of smart meters with AMI (Advanced Metering Infrastructure) systems. Regulatory frameworks, such as those promoting energy efficiency and grid modernization, significantly influence market growth. Product substitutes, while limited, include traditional electromechanical meters, but their adoption is declining due to the superior capabilities of smart meters. End-user demographics show a shift towards increased adoption across all segments (residential, commercial, and industrial), driven by cost-saving measures and improved resource management. Mergers and acquisitions (M&A) activities are prevalent, as seen in the USD 44 Million acquisition of ATi by Badger Meter in 2021, indicating consolidation and expansion strategies within the industry.
US Smart Meter Industry Market Dynamics & Trends
The US smart meter market is experiencing robust growth, driven by several key factors. The compound annual growth rate (CAGR) from 2025 to 2033 is projected to be xx%. Increased government initiatives promoting smart grid infrastructure and energy efficiency are primary growth drivers. Technological disruptions, particularly the development of advanced communication technologies (e.g., Narrowband IoT, LTE-M) and improved data analytics capabilities, are fueling market expansion. Consumer preferences are shifting towards smart meters due to enhanced billing accuracy, remote monitoring capabilities, and reduced energy consumption. Competitive dynamics are characterized by intense rivalry among major players, leading to continuous product innovation and strategic partnerships. Market penetration across residential, commercial, and industrial sectors is steadily increasing, with projected penetration rates of xx%, xx%, and xx% respectively by 2033.
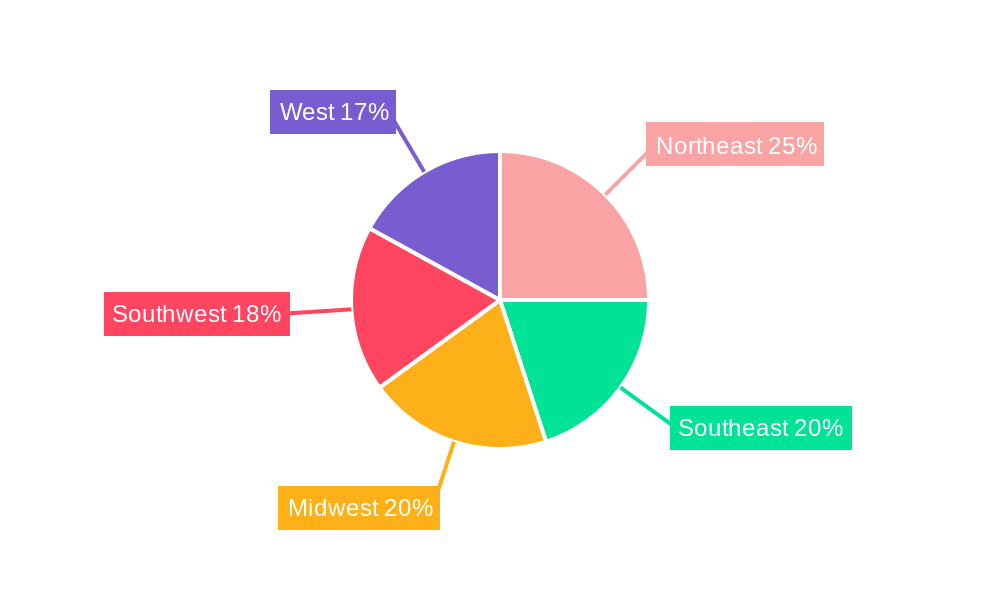
Dominant Regions & Segments in US Smart Meter Industry
The US smart meter market demonstrates significant regional variations in adoption and growth. While data on specific regional dominance is not currently available, the market will see xx million dollars growth in the state of California because of increasing adoption of smart grid technologies. This is driven by factors such as supportive government policies, robust infrastructure investments, and strong regulatory frameworks focused on sustainability.
By Type: Smart electricity meters currently constitute the largest segment, driven by large-scale grid modernization projects. However, smart water meters are experiencing rapid growth due to increasing concerns over water conservation and efficient water resource management. Smart gas meters have a relatively smaller market share compared to electricity and water meters, yet show a steady growth in selected areas because of the technological advancements in gas meter manufacturing processes that reduce the cost of production and increase the availability of smart gas meters in the market.
By End-User: The residential segment represents the largest share, driven by the significant number of households in the US. However, commercial and industrial segments are witnessing faster growth due to the potential for cost optimization and enhanced operational efficiency. Growth in the commercial and industrial segments is mainly driven by the increasing demand for efficient energy management solutions in large facilities.
US Smart Meter Industry Product Innovations
Recent product innovations in the US smart meter market focus on advanced communication technologies, improved data analytics capabilities, and enhanced security features. The integration of AI and machine learning enables predictive maintenance and improved grid management, leading to reduced operational costs and improved service reliability. These innovations enhance the market fit by addressing key customer needs and creating a compelling value proposition compared to traditional meters.
Report Scope & Segmentation Analysis
This report comprehensively segments the US smart meter market by type (Smart Gas Meters, Smart Water Meters, Smart Electricity Meters) and by end-user (Commercial, Industrial, Residential). Each segment’s growth projections, market size, and competitive dynamics are thoroughly analyzed. For example, the smart electricity meter segment is expected to grow at xx% CAGR, while the residential segment is projected to hold the largest market share throughout the forecast period. Competitive intensity varies across segments, with more established players dominating the electricity meter market while smaller specialized companies gaining ground in the water meter sector.
Key Drivers of US Smart Meter Industry Growth
Several key factors drive the growth of the US smart meter industry. Government regulations promoting smart grid infrastructure and energy efficiency play a significant role. Technological advancements such as improved communication protocols and data analytics capabilities enhance the functionality and value proposition of smart meters. Economic factors, such as the increasing cost of energy and the need to reduce operational expenses, encourage the adoption of smart meters.
Challenges in the US Smart Meter Industry Sector
The US smart meter industry faces several challenges. Regulatory hurdles and concerns regarding data security and privacy can impede market growth. Supply chain disruptions and the increasing cost of raw materials can affect production costs. Intense competition among established players and new entrants exerts pressure on pricing and profitability. The cybersecurity concerns related to the smart meters are among the major challenges faced by the industry.
Emerging Opportunities in US Smart Meter Industry
Emerging opportunities exist in the integration of smart meters with other smart home technologies, enabling comprehensive energy and water management. The development of advanced analytics platforms to leverage the vast amount of data generated by smart meters presents significant opportunities for value creation. Expanding into underserved rural markets and developing smart meter solutions for specific industry applications (e.g., agriculture, oil and gas) offers potential growth avenues.
Leading Players in the US Smart Meter Industry Market
- Itron Inc
- Badger Meter Inc
- Kamstrup
- Elster American Meter (Honeywell International Inc)
- Neptune Technology Group Inc
- Sensus USA Inc (Xylem Inc)
- General Electric Co
- Diehl Metering US
- Mueller Systems LLC
Key Developments in US Smart Meter Industry Industry
- January 2021: Badger Meter, Inc. acquired Analytical Technology, Inc. (ATi) for USD 44 million, expanding its water quality monitoring capabilities.
- March 2022: Mueller Systems deployed a pilot program for a new water meter system with mobile phone control features for Pace Water System in Santa Rosa County, Florida.
Future Outlook for US Smart Meter Industry Market
The US smart meter market is poised for continued growth, driven by increasing demand for energy efficiency, smart grid modernization initiatives, and technological advancements. Strategic partnerships, innovative product development, and expansion into new markets will be crucial for players to capitalize on the substantial growth potential. The market is expected to experience significant expansion in the coming years, driven by factors such as rising concerns about water conservation, energy efficiency, and the adoption of advanced metering infrastructure (AMI).
US Smart Meter Industry Segmentation
-
1. Type
- 1.1. Smart Gas Meters
- 1.2. Smart Water Meters
- 1.3. Smart Electricity Meters
-
2. End-User
- 2.1. Commercial
- 2.2. Industrial
- 2.3. Residential
US Smart Meter Industry Segmentation By Geography
-
1. North America
- 1.1. United States
- 1.2. Canada
- 1.3. Mexico
-
2. South America
- 2.1. Brazil
- 2.2. Argentina
- 2.3. Rest of South America
-
3. Europe
- 3.1. United Kingdom
- 3.2. Germany
- 3.3. France
- 3.4. Italy
- 3.5. Spain
- 3.6. Russia
- 3.7. Benelux
- 3.8. Nordics
- 3.9. Rest of Europe
-
4. Middle East & Africa
- 4.1. Turkey
- 4.2. Israel
- 4.3. GCC
- 4.4. North Africa
- 4.5. South Africa
- 4.6. Rest of Middle East & Africa
-
5. Asia Pacific
- 5.1. China
- 5.2. India
- 5.3. Japan
- 5.4. South Korea
- 5.5. ASEAN
- 5.6. Oceania
- 5.7. Rest of Asia Pacific
US Smart Meter Industry REPORT HIGHLIGHTS
| Aspects | Details |
|---|---|
| Study Period | 2019-2033 |
| Base Year | 2024 |
| Estimated Year | 2025 |
| Forecast Period | 2025-2033 |
| Historical Period | 2019-2024 |
| Growth Rate | CAGR of 9.80% from 2019-2033 |
| Segmentation |
|
Table of Contents
- 1. Introduction
- 1.1. Research Scope
- 1.2. Market Segmentation
- 1.3. Research Methodology
- 1.4. Definitions and Assumptions
- 2. Executive Summary
- 2.1. Introduction
- 3. Market Dynamics
- 3.1. Introduction
- 3.2. Market Drivers
- 3.2.1. Higher Consumer Awareness and Government Regulations Mandating the Installation of Smart Meters; Increased Investments in Smart Grid Projects; Investments in Smart City Developments
- 3.3. Market Restrains
- 3.3.1. High Installation Cost and Longer ROI Period; Longer Replacement Cycle of Water Meters
- 3.4. Market Trends
- 3.4.1. Smart Gas Meter Segment to Grow Significantly
- 4. Market Factor Analysis
- 4.1. Porters Five Forces
- 4.2. Supply/Value Chain
- 4.3. PESTEL analysis
- 4.4. Market Entropy
- 4.5. Patent/Trademark Analysis
- 5. Global US Smart Meter Industry Analysis, Insights and Forecast, 2019-2031
- 5.1. Market Analysis, Insights and Forecast - by Type
- 5.1.1. Smart Gas Meters
- 5.1.2. Smart Water Meters
- 5.1.3. Smart Electricity Meters
- 5.2. Market Analysis, Insights and Forecast - by End-User
- 5.2.1. Commercial
- 5.2.2. Industrial
- 5.2.3. Residential
- 5.3. Market Analysis, Insights and Forecast - by Region
- 5.3.1. North America
- 5.3.2. South America
- 5.3.3. Europe
- 5.3.4. Middle East & Africa
- 5.3.5. Asia Pacific
- 5.1. Market Analysis, Insights and Forecast - by Type
- 6. North America US Smart Meter Industry Analysis, Insights and Forecast, 2019-2031
- 6.1. Market Analysis, Insights and Forecast - by Type
- 6.1.1. Smart Gas Meters
- 6.1.2. Smart Water Meters
- 6.1.3. Smart Electricity Meters
- 6.2. Market Analysis, Insights and Forecast - by End-User
- 6.2.1. Commercial
- 6.2.2. Industrial
- 6.2.3. Residential
- 6.1. Market Analysis, Insights and Forecast - by Type
- 7. South America US Smart Meter Industry Analysis, Insights and Forecast, 2019-2031
- 7.1. Market Analysis, Insights and Forecast - by Type
- 7.1.1. Smart Gas Meters
- 7.1.2. Smart Water Meters
- 7.1.3. Smart Electricity Meters
- 7.2. Market Analysis, Insights and Forecast - by End-User
- 7.2.1. Commercial
- 7.2.2. Industrial
- 7.2.3. Residential
- 7.1. Market Analysis, Insights and Forecast - by Type
- 8. Europe US Smart Meter Industry Analysis, Insights and Forecast, 2019-2031
- 8.1. Market Analysis, Insights and Forecast - by Type
- 8.1.1. Smart Gas Meters
- 8.1.2. Smart Water Meters
- 8.1.3. Smart Electricity Meters
- 8.2. Market Analysis, Insights and Forecast - by End-User
- 8.2.1. Commercial
- 8.2.2. Industrial
- 8.2.3. Residential
- 8.1. Market Analysis, Insights and Forecast - by Type
- 9. Middle East & Africa US Smart Meter Industry Analysis, Insights and Forecast, 2019-2031
- 9.1. Market Analysis, Insights and Forecast - by Type
- 9.1.1. Smart Gas Meters
- 9.1.2. Smart Water Meters
- 9.1.3. Smart Electricity Meters
- 9.2. Market Analysis, Insights and Forecast - by End-User
- 9.2.1. Commercial
- 9.2.2. Industrial
- 9.2.3. Residential
- 9.1. Market Analysis, Insights and Forecast - by Type
- 10. Asia Pacific US Smart Meter Industry Analysis, Insights and Forecast, 2019-2031
- 10.1. Market Analysis, Insights and Forecast - by Type
- 10.1.1. Smart Gas Meters
- 10.1.2. Smart Water Meters
- 10.1.3. Smart Electricity Meters
- 10.2. Market Analysis, Insights and Forecast - by End-User
- 10.2.1. Commercial
- 10.2.2. Industrial
- 10.2.3. Residential
- 10.1. Market Analysis, Insights and Forecast - by Type
- 11. Northeast US Smart Meter Industry Analysis, Insights and Forecast, 2019-2031
- 12. Southeast US Smart Meter Industry Analysis, Insights and Forecast, 2019-2031
- 13. Midwest US Smart Meter Industry Analysis, Insights and Forecast, 2019-2031
- 14. Southwest US Smart Meter Industry Analysis, Insights and Forecast, 2019-2031
- 15. West US Smart Meter Industry Analysis, Insights and Forecast, 2019-2031
- 16. Competitive Analysis
- 16.1. Global Market Share Analysis 2024
- 16.2. Company Profiles
- 16.2.1 Itron Inc
- 16.2.1.1. Overview
- 16.2.1.2. Products
- 16.2.1.3. SWOT Analysis
- 16.2.1.4. Recent Developments
- 16.2.1.5. Financials (Based on Availability)
- 16.2.2 Badger Meter Inc
- 16.2.2.1. Overview
- 16.2.2.2. Products
- 16.2.2.3. SWOT Analysis
- 16.2.2.4. Recent Developments
- 16.2.2.5. Financials (Based on Availability)
- 16.2.3 Kamstrup
- 16.2.3.1. Overview
- 16.2.3.2. Products
- 16.2.3.3. SWOT Analysis
- 16.2.3.4. Recent Developments
- 16.2.3.5. Financials (Based on Availability)
- 16.2.4 Elster American Meter (Honeywell International Inc )
- 16.2.4.1. Overview
- 16.2.4.2. Products
- 16.2.4.3. SWOT Analysis
- 16.2.4.4. Recent Developments
- 16.2.4.5. Financials (Based on Availability)
- 16.2.5 Neptune Technology Group Inc
- 16.2.5.1. Overview
- 16.2.5.2. Products
- 16.2.5.3. SWOT Analysis
- 16.2.5.4. Recent Developments
- 16.2.5.5. Financials (Based on Availability)
- 16.2.6 Sensus USA Inc (Xylem Inc )
- 16.2.6.1. Overview
- 16.2.6.2. Products
- 16.2.6.3. SWOT Analysis
- 16.2.6.4. Recent Developments
- 16.2.6.5. Financials (Based on Availability)
- 16.2.7 General Electric Co
- 16.2.7.1. Overview
- 16.2.7.2. Products
- 16.2.7.3. SWOT Analysis
- 16.2.7.4. Recent Developments
- 16.2.7.5. Financials (Based on Availability)
- 16.2.8 Diehl Metering US
- 16.2.8.1. Overview
- 16.2.8.2. Products
- 16.2.8.3. SWOT Analysis
- 16.2.8.4. Recent Developments
- 16.2.8.5. Financials (Based on Availability)
- 16.2.9 Mueller Systems LLC
- 16.2.9.1. Overview
- 16.2.9.2. Products
- 16.2.9.3. SWOT Analysis
- 16.2.9.4. Recent Developments
- 16.2.9.5. Financials (Based on Availability)
- 16.2.1 Itron Inc
List of Figures
- Figure 1: Global US Smart Meter Industry Revenue Breakdown (Million, %) by Region 2024 & 2032
- Figure 2: Global US Smart Meter Industry Volume Breakdown (K Unit, %) by Region 2024 & 2032
- Figure 3: United states US Smart Meter Industry Revenue (Million), by Country 2024 & 2032
- Figure 4: United states US Smart Meter Industry Volume (K Unit), by Country 2024 & 2032
- Figure 5: United states US Smart Meter Industry Revenue Share (%), by Country 2024 & 2032
- Figure 6: United states US Smart Meter Industry Volume Share (%), by Country 2024 & 2032
- Figure 7: North America US Smart Meter Industry Revenue (Million), by Type 2024 & 2032
- Figure 8: North America US Smart Meter Industry Volume (K Unit), by Type 2024 & 2032
- Figure 9: North America US Smart Meter Industry Revenue Share (%), by Type 2024 & 2032
- Figure 10: North America US Smart Meter Industry Volume Share (%), by Type 2024 & 2032
- Figure 11: North America US Smart Meter Industry Revenue (Million), by End-User 2024 & 2032
- Figure 12: North America US Smart Meter Industry Volume (K Unit), by End-User 2024 & 2032
- Figure 13: North America US Smart Meter Industry Revenue Share (%), by End-User 2024 & 2032
- Figure 14: North America US Smart Meter Industry Volume Share (%), by End-User 2024 & 2032
- Figure 15: North America US Smart Meter Industry Revenue (Million), by Country 2024 & 2032
- Figure 16: North America US Smart Meter Industry Volume (K Unit), by Country 2024 & 2032
- Figure 17: North America US Smart Meter Industry Revenue Share (%), by Country 2024 & 2032
- Figure 18: North America US Smart Meter Industry Volume Share (%), by Country 2024 & 2032
- Figure 19: South America US Smart Meter Industry Revenue (Million), by Type 2024 & 2032
- Figure 20: South America US Smart Meter Industry Volume (K Unit), by Type 2024 & 2032
- Figure 21: South America US Smart Meter Industry Revenue Share (%), by Type 2024 & 2032
- Figure 22: South America US Smart Meter Industry Volume Share (%), by Type 2024 & 2032
- Figure 23: South America US Smart Meter Industry Revenue (Million), by End-User 2024 & 2032
- Figure 24: South America US Smart Meter Industry Volume (K Unit), by End-User 2024 & 2032
- Figure 25: South America US Smart Meter Industry Revenue Share (%), by End-User 2024 & 2032
- Figure 26: South America US Smart Meter Industry Volume Share (%), by End-User 2024 & 2032
- Figure 27: South America US Smart Meter Industry Revenue (Million), by Country 2024 & 2032
- Figure 28: South America US Smart Meter Industry Volume (K Unit), by Country 2024 & 2032
- Figure 29: South America US Smart Meter Industry Revenue Share (%), by Country 2024 & 2032
- Figure 30: South America US Smart Meter Industry Volume Share (%), by Country 2024 & 2032
- Figure 31: Europe US Smart Meter Industry Revenue (Million), by Type 2024 & 2032
- Figure 32: Europe US Smart Meter Industry Volume (K Unit), by Type 2024 & 2032
- Figure 33: Europe US Smart Meter Industry Revenue Share (%), by Type 2024 & 2032
- Figure 34: Europe US Smart Meter Industry Volume Share (%), by Type 2024 & 2032
- Figure 35: Europe US Smart Meter Industry Revenue (Million), by End-User 2024 & 2032
- Figure 36: Europe US Smart Meter Industry Volume (K Unit), by End-User 2024 & 2032
- Figure 37: Europe US Smart Meter Industry Revenue Share (%), by End-User 2024 & 2032
- Figure 38: Europe US Smart Meter Industry Volume Share (%), by End-User 2024 & 2032
- Figure 39: Europe US Smart Meter Industry Revenue (Million), by Country 2024 & 2032
- Figure 40: Europe US Smart Meter Industry Volume (K Unit), by Country 2024 & 2032
- Figure 41: Europe US Smart Meter Industry Revenue Share (%), by Country 2024 & 2032
- Figure 42: Europe US Smart Meter Industry Volume Share (%), by Country 2024 & 2032
- Figure 43: Middle East & Africa US Smart Meter Industry Revenue (Million), by Type 2024 & 2032
- Figure 44: Middle East & Africa US Smart Meter Industry Volume (K Unit), by Type 2024 & 2032
- Figure 45: Middle East & Africa US Smart Meter Industry Revenue Share (%), by Type 2024 & 2032
- Figure 46: Middle East & Africa US Smart Meter Industry Volume Share (%), by Type 2024 & 2032
- Figure 47: Middle East & Africa US Smart Meter Industry Revenue (Million), by End-User 2024 & 2032
- Figure 48: Middle East & Africa US Smart Meter Industry Volume (K Unit), by End-User 2024 & 2032
- Figure 49: Middle East & Africa US Smart Meter Industry Revenue Share (%), by End-User 2024 & 2032
- Figure 50: Middle East & Africa US Smart Meter Industry Volume Share (%), by End-User 2024 & 2032
- Figure 51: Middle East & Africa US Smart Meter Industry Revenue (Million), by Country 2024 & 2032
- Figure 52: Middle East & Africa US Smart Meter Industry Volume (K Unit), by Country 2024 & 2032
- Figure 53: Middle East & Africa US Smart Meter Industry Revenue Share (%), by Country 2024 & 2032
- Figure 54: Middle East & Africa US Smart Meter Industry Volume Share (%), by Country 2024 & 2032
- Figure 55: Asia Pacific US Smart Meter Industry Revenue (Million), by Type 2024 & 2032
- Figure 56: Asia Pacific US Smart Meter Industry Volume (K Unit), by Type 2024 & 2032
- Figure 57: Asia Pacific US Smart Meter Industry Revenue Share (%), by Type 2024 & 2032
- Figure 58: Asia Pacific US Smart Meter Industry Volume Share (%), by Type 2024 & 2032
- Figure 59: Asia Pacific US Smart Meter Industry Revenue (Million), by End-User 2024 & 2032
- Figure 60: Asia Pacific US Smart Meter Industry Volume (K Unit), by End-User 2024 & 2032
- Figure 61: Asia Pacific US Smart Meter Industry Revenue Share (%), by End-User 2024 & 2032
- Figure 62: Asia Pacific US Smart Meter Industry Volume Share (%), by End-User 2024 & 2032
- Figure 63: Asia Pacific US Smart Meter Industry Revenue (Million), by Country 2024 & 2032
- Figure 64: Asia Pacific US Smart Meter Industry Volume (K Unit), by Country 2024 & 2032
- Figure 65: Asia Pacific US Smart Meter Industry Revenue Share (%), by Country 2024 & 2032
- Figure 66: Asia Pacific US Smart Meter Industry Volume Share (%), by Country 2024 & 2032
List of Tables
- Table 1: Global US Smart Meter Industry Revenue Million Forecast, by Region 2019 & 2032
- Table 2: Global US Smart Meter Industry Volume K Unit Forecast, by Region 2019 & 2032
- Table 3: Global US Smart Meter Industry Revenue Million Forecast, by Type 2019 & 2032
- Table 4: Global US Smart Meter Industry Volume K Unit Forecast, by Type 2019 & 2032
- Table 5: Global US Smart Meter Industry Revenue Million Forecast, by End-User 2019 & 2032
- Table 6: Global US Smart Meter Industry Volume K Unit Forecast, by End-User 2019 & 2032
- Table 7: Global US Smart Meter Industry Revenue Million Forecast, by Region 2019 & 2032
- Table 8: Global US Smart Meter Industry Volume K Unit Forecast, by Region 2019 & 2032
- Table 9: Global US Smart Meter Industry Revenue Million Forecast, by Country 2019 & 2032
- Table 10: Global US Smart Meter Industry Volume K Unit Forecast, by Country 2019 & 2032
- Table 11: Northeast US Smart Meter Industry Revenue (Million) Forecast, by Application 2019 & 2032
- Table 12: Northeast US Smart Meter Industry Volume (K Unit) Forecast, by Application 2019 & 2032
- Table 13: Southeast US Smart Meter Industry Revenue (Million) Forecast, by Application 2019 & 2032
- Table 14: Southeast US Smart Meter Industry Volume (K Unit) Forecast, by Application 2019 & 2032
- Table 15: Midwest US Smart Meter Industry Revenue (Million) Forecast, by Application 2019 & 2032
- Table 16: Midwest US Smart Meter Industry Volume (K Unit) Forecast, by Application 2019 & 2032
- Table 17: Southwest US Smart Meter Industry Revenue (Million) Forecast, by Application 2019 & 2032
- Table 18: Southwest US Smart Meter Industry Volume (K Unit) Forecast, by Application 2019 & 2032
- Table 19: West US Smart Meter Industry Revenue (Million) Forecast, by Application 2019 & 2032
- Table 20: West US Smart Meter Industry Volume (K Unit) Forecast, by Application 2019 & 2032
- Table 21: Global US Smart Meter Industry Revenue Million Forecast, by Type 2019 & 2032
- Table 22: Global US Smart Meter Industry Volume K Unit Forecast, by Type 2019 & 2032
- Table 23: Global US Smart Meter Industry Revenue Million Forecast, by End-User 2019 & 2032
- Table 24: Global US Smart Meter Industry Volume K Unit Forecast, by End-User 2019 & 2032
- Table 25: Global US Smart Meter Industry Revenue Million Forecast, by Country 2019 & 2032
- Table 26: Global US Smart Meter Industry Volume K Unit Forecast, by Country 2019 & 2032
- Table 27: United States US Smart Meter Industry Revenue (Million) Forecast, by Application 2019 & 2032
- Table 28: United States US Smart Meter Industry Volume (K Unit) Forecast, by Application 2019 & 2032
- Table 29: Canada US Smart Meter Industry Revenue (Million) Forecast, by Application 2019 & 2032
- Table 30: Canada US Smart Meter Industry Volume (K Unit) Forecast, by Application 2019 & 2032
- Table 31: Mexico US Smart Meter Industry Revenue (Million) Forecast, by Application 2019 & 2032
- Table 32: Mexico US Smart Meter Industry Volume (K Unit) Forecast, by Application 2019 & 2032
- Table 33: Global US Smart Meter Industry Revenue Million Forecast, by Type 2019 & 2032
- Table 34: Global US Smart Meter Industry Volume K Unit Forecast, by Type 2019 & 2032
- Table 35: Global US Smart Meter Industry Revenue Million Forecast, by End-User 2019 & 2032
- Table 36: Global US Smart Meter Industry Volume K Unit Forecast, by End-User 2019 & 2032
- Table 37: Global US Smart Meter Industry Revenue Million Forecast, by Country 2019 & 2032
- Table 38: Global US Smart Meter Industry Volume K Unit Forecast, by Country 2019 & 2032
- Table 39: Brazil US Smart Meter Industry Revenue (Million) Forecast, by Application 2019 & 2032
- Table 40: Brazil US Smart Meter Industry Volume (K Unit) Forecast, by Application 2019 & 2032
- Table 41: Argentina US Smart Meter Industry Revenue (Million) Forecast, by Application 2019 & 2032
- Table 42: Argentina US Smart Meter Industry Volume (K Unit) Forecast, by Application 2019 & 2032
- Table 43: Rest of South America US Smart Meter Industry Revenue (Million) Forecast, by Application 2019 & 2032
- Table 44: Rest of South America US Smart Meter Industry Volume (K Unit) Forecast, by Application 2019 & 2032
- Table 45: Global US Smart Meter Industry Revenue Million Forecast, by Type 2019 & 2032
- Table 46: Global US Smart Meter Industry Volume K Unit Forecast, by Type 2019 & 2032
- Table 47: Global US Smart Meter Industry Revenue Million Forecast, by End-User 2019 & 2032
- Table 48: Global US Smart Meter Industry Volume K Unit Forecast, by End-User 2019 & 2032
- Table 49: Global US Smart Meter Industry Revenue Million Forecast, by Country 2019 & 2032
- Table 50: Global US Smart Meter Industry Volume K Unit Forecast, by Country 2019 & 2032
- Table 51: United Kingdom US Smart Meter Industry Revenue (Million) Forecast, by Application 2019 & 2032
- Table 52: United Kingdom US Smart Meter Industry Volume (K Unit) Forecast, by Application 2019 & 2032
- Table 53: Germany US Smart Meter Industry Revenue (Million) Forecast, by Application 2019 & 2032
- Table 54: Germany US Smart Meter Industry Volume (K Unit) Forecast, by Application 2019 & 2032
- Table 55: France US Smart Meter Industry Revenue (Million) Forecast, by Application 2019 & 2032
- Table 56: France US Smart Meter Industry Volume (K Unit) Forecast, by Application 2019 & 2032
- Table 57: Italy US Smart Meter Industry Revenue (Million) Forecast, by Application 2019 & 2032
- Table 58: Italy US Smart Meter Industry Volume (K Unit) Forecast, by Application 2019 & 2032
- Table 59: Spain US Smart Meter Industry Revenue (Million) Forecast, by Application 2019 & 2032
- Table 60: Spain US Smart Meter Industry Volume (K Unit) Forecast, by Application 2019 & 2032
- Table 61: Russia US Smart Meter Industry Revenue (Million) Forecast, by Application 2019 & 2032
- Table 62: Russia US Smart Meter Industry Volume (K Unit) Forecast, by Application 2019 & 2032
- Table 63: Benelux US Smart Meter Industry Revenue (Million) Forecast, by Application 2019 & 2032
- Table 64: Benelux US Smart Meter Industry Volume (K Unit) Forecast, by Application 2019 & 2032
- Table 65: Nordics US Smart Meter Industry Revenue (Million) Forecast, by Application 2019 & 2032
- Table 66: Nordics US Smart Meter Industry Volume (K Unit) Forecast, by Application 2019 & 2032
- Table 67: Rest of Europe US Smart Meter Industry Revenue (Million) Forecast, by Application 2019 & 2032
- Table 68: Rest of Europe US Smart Meter Industry Volume (K Unit) Forecast, by Application 2019 & 2032
- Table 69: Global US Smart Meter Industry Revenue Million Forecast, by Type 2019 & 2032
- Table 70: Global US Smart Meter Industry Volume K Unit Forecast, by Type 2019 & 2032
- Table 71: Global US Smart Meter Industry Revenue Million Forecast, by End-User 2019 & 2032
- Table 72: Global US Smart Meter Industry Volume K Unit Forecast, by End-User 2019 & 2032
- Table 73: Global US Smart Meter Industry Revenue Million Forecast, by Country 2019 & 2032
- Table 74: Global US Smart Meter Industry Volume K Unit Forecast, by Country 2019 & 2032
- Table 75: Turkey US Smart Meter Industry Revenue (Million) Forecast, by Application 2019 & 2032
- Table 76: Turkey US Smart Meter Industry Volume (K Unit) Forecast, by Application 2019 & 2032
- Table 77: Israel US Smart Meter Industry Revenue (Million) Forecast, by Application 2019 & 2032
- Table 78: Israel US Smart Meter Industry Volume (K Unit) Forecast, by Application 2019 & 2032
- Table 79: GCC US Smart Meter Industry Revenue (Million) Forecast, by Application 2019 & 2032
- Table 80: GCC US Smart Meter Industry Volume (K Unit) Forecast, by Application 2019 & 2032
- Table 81: North Africa US Smart Meter Industry Revenue (Million) Forecast, by Application 2019 & 2032
- Table 82: North Africa US Smart Meter Industry Volume (K Unit) Forecast, by Application 2019 & 2032
- Table 83: South Africa US Smart Meter Industry Revenue (Million) Forecast, by Application 2019 & 2032
- Table 84: South Africa US Smart Meter Industry Volume (K Unit) Forecast, by Application 2019 & 2032
- Table 85: Rest of Middle East & Africa US Smart Meter Industry Revenue (Million) Forecast, by Application 2019 & 2032
- Table 86: Rest of Middle East & Africa US Smart Meter Industry Volume (K Unit) Forecast, by Application 2019 & 2032
- Table 87: Global US Smart Meter Industry Revenue Million Forecast, by Type 2019 & 2032
- Table 88: Global US Smart Meter Industry Volume K Unit Forecast, by Type 2019 & 2032
- Table 89: Global US Smart Meter Industry Revenue Million Forecast, by End-User 2019 & 2032
- Table 90: Global US Smart Meter Industry Volume K Unit Forecast, by End-User 2019 & 2032
- Table 91: Global US Smart Meter Industry Revenue Million Forecast, by Country 2019 & 2032
- Table 92: Global US Smart Meter Industry Volume K Unit Forecast, by Country 2019 & 2032
- Table 93: China US Smart Meter Industry Revenue (Million) Forecast, by Application 2019 & 2032
- Table 94: China US Smart Meter Industry Volume (K Unit) Forecast, by Application 2019 & 2032
- Table 95: India US Smart Meter Industry Revenue (Million) Forecast, by Application 2019 & 2032
- Table 96: India US Smart Meter Industry Volume (K Unit) Forecast, by Application 2019 & 2032
- Table 97: Japan US Smart Meter Industry Revenue (Million) Forecast, by Application 2019 & 2032
- Table 98: Japan US Smart Meter Industry Volume (K Unit) Forecast, by Application 2019 & 2032
- Table 99: South Korea US Smart Meter Industry Revenue (Million) Forecast, by Application 2019 & 2032
- Table 100: South Korea US Smart Meter Industry Volume (K Unit) Forecast, by Application 2019 & 2032
- Table 101: ASEAN US Smart Meter Industry Revenue (Million) Forecast, by Application 2019 & 2032
- Table 102: ASEAN US Smart Meter Industry Volume (K Unit) Forecast, by Application 2019 & 2032
- Table 103: Oceania US Smart Meter Industry Revenue (Million) Forecast, by Application 2019 & 2032
- Table 104: Oceania US Smart Meter Industry Volume (K Unit) Forecast, by Application 2019 & 2032
- Table 105: Rest of Asia Pacific US Smart Meter Industry Revenue (Million) Forecast, by Application 2019 & 2032
- Table 106: Rest of Asia Pacific US Smart Meter Industry Volume (K Unit) Forecast, by Application 2019 & 2032
Frequently Asked Questions
1. What is the projected Compound Annual Growth Rate (CAGR) of the US Smart Meter Industry?
The projected CAGR is approximately 9.80%.
2. Which companies are prominent players in the US Smart Meter Industry?
Key companies in the market include Itron Inc, Badger Meter Inc, Kamstrup, Elster American Meter (Honeywell International Inc ), Neptune Technology Group Inc, Sensus USA Inc (Xylem Inc ), General Electric Co, Diehl Metering US, Mueller Systems LLC.
3. What are the main segments of the US Smart Meter Industry?
The market segments include Type, End-User.
4. Can you provide details about the market size?
The market size is estimated to be USD XX Million as of 2022.
5. What are some drivers contributing to market growth?
Higher Consumer Awareness and Government Regulations Mandating the Installation of Smart Meters; Increased Investments in Smart Grid Projects; Investments in Smart City Developments.
6. What are the notable trends driving market growth?
Smart Gas Meter Segment to Grow Significantly.
7. Are there any restraints impacting market growth?
High Installation Cost and Longer ROI Period; Longer Replacement Cycle of Water Meters.
8. Can you provide examples of recent developments in the market?
January 2021 - Badger Meter, Inc. announced the acquisition of US-based Analytical Technology, Inc. (ATi), a privately held provider of water quality monitoring systems, for USD 44 million. ATi specializes in the design, manufacture and distribution of water quality instruments based on electrochemical and optical sensors.
9. What pricing options are available for accessing the report?
Pricing options include single-user, multi-user, and enterprise licenses priced at USD 3800, USD 4500, and USD 5800 respectively.
10. Is the market size provided in terms of value or volume?
The market size is provided in terms of value, measured in Million and volume, measured in K Unit.
11. Are there any specific market keywords associated with the report?
Yes, the market keyword associated with the report is "US Smart Meter Industry," which aids in identifying and referencing the specific market segment covered.
12. How do I determine which pricing option suits my needs best?
The pricing options vary based on user requirements and access needs. Individual users may opt for single-user licenses, while businesses requiring broader access may choose multi-user or enterprise licenses for cost-effective access to the report.
13. Are there any additional resources or data provided in the US Smart Meter Industry report?
While the report offers comprehensive insights, it's advisable to review the specific contents or supplementary materials provided to ascertain if additional resources or data are available.
14. How can I stay updated on further developments or reports in the US Smart Meter Industry?
To stay informed about further developments, trends, and reports in the US Smart Meter Industry, consider subscribing to industry newsletters, following relevant companies and organizations, or regularly checking reputable industry news sources and publications.
Methodology
Step 1 - Identification of Relevant Samples Size from Population Database


Step 2 - Approaches for Defining Global Market Size (Value, Volume* & Price*)

Note*: In applicable scenarios
Step 3 - Data Sources
Primary Research
- Web Analytics
- Survey Reports
- Research Institute
- Latest Research Reports
- Opinion Leaders
Secondary Research
- Annual Reports
- White Paper
- Latest Press Release
- Industry Association
- Paid Database
- Investor Presentations

Step 4 - Data Triangulation
Involves using different sources of information in order to increase the validity of a study
These sources are likely to be stakeholders in a program - participants, other researchers, program staff, other community members, and so on.
Then we put all data in single framework & apply various statistical tools to find out the dynamic on the market.
During the analysis stage, feedback from the stakeholder groups would be compared to determine areas of agreement as well as areas of divergence


