

Key Insights
The US whey protein ingredients market is experiencing substantial growth, driven by heightened consumer focus on health and wellness. Key growth drivers include the escalating popularity of fitness and sports nutrition, alongside growing awareness of protein's benefits for muscle development and recovery. Furthermore, the integration of whey protein into a broader array of food and beverage items, such as protein bars, shakes, yogurts, and baked goods, is expanding its market penetration beyond traditional sports nutrition consumers. Innovations in processing are yielding superior and diverse whey protein forms (concentrates, hydrolysates, isolates), effectively addressing specific consumer requirements.
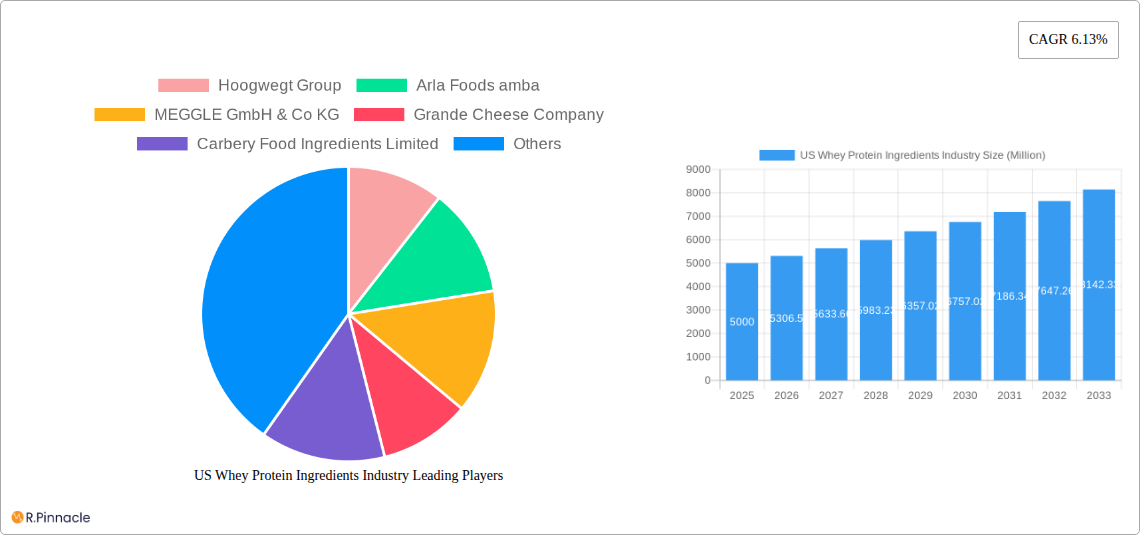
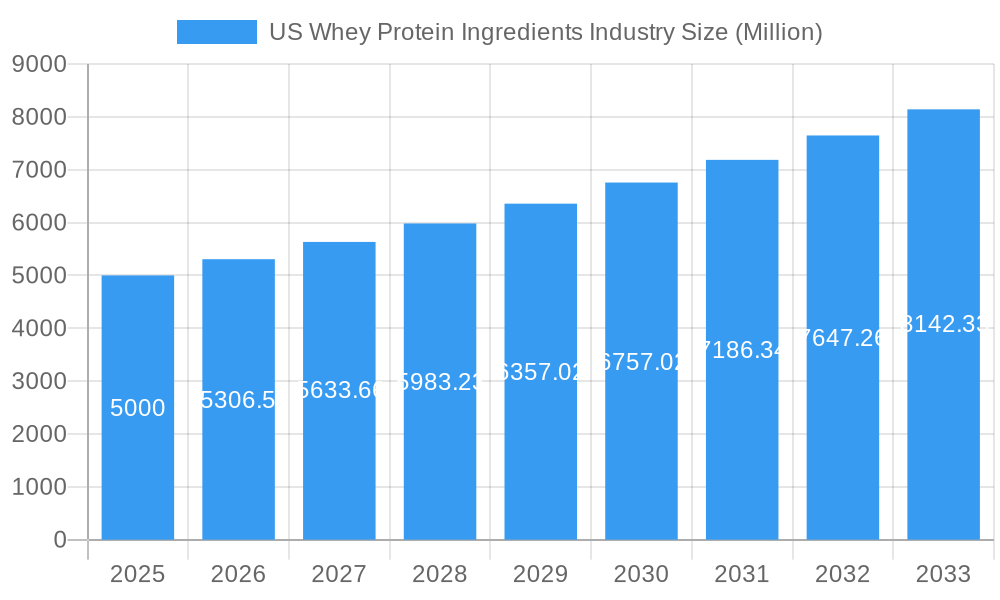
US Whey Protein Ingredients Industry Market Size (In Billion)
Despite these positive indicators, the market encounters challenges such as milk production volatility impacting ingredient costs and consumer concerns regarding dairy sourcing and sustainability. Nevertheless, the overall outlook remains optimistic. The market is projected to grow at a CAGR of 14.25% from a market size of $8.36 billion in the base year 2025. The sports/performance nutrition segment is anticipated to exhibit the highest growth potential due to the surging popularity of fitness and demand for premium protein supplements. North America, particularly the United States, demonstrates significant regional dominance in both production and consumption of whey protein ingredients.
US Whey Protein Ingredients Industry Company Market Share
US Whey Protein Ingredients Industry Report: 2019-2033
This comprehensive report provides a detailed analysis of the US whey protein ingredients industry, offering invaluable insights for industry professionals, investors, and strategic decision-makers. Covering the period from 2019 to 2033, with a focus on 2025, this report meticulously examines market dynamics, competitive landscapes, and future growth prospects. Benefit from in-depth analysis of key segments, including concentrates, hydrolyzed, and isolates, across various end-user applications like animal feed, food and beverages, and sports/performance nutrition.
US Whey Protein Ingredients Industry Market Structure & Innovation Trends
The US whey protein ingredients market exhibits a moderately concentrated structure, with several major players holding significant market share. Hoogwegt Group, Arla Foods amba, MEGGLE GmbH & Co KG, and Glanbia PLC are amongst the key competitors, each possessing unique strengths and market strategies. Market concentration is estimated at xx%, with the top five players collectively controlling approximately xx% of the market in 2025. Innovation is driven by increasing demand for high-protein products, coupled with technological advancements in whey processing and formulation. Regulatory frameworks, such as FDA guidelines on labeling and food safety, significantly influence industry practices. Product substitutes, including soy and pea protein, pose a competitive challenge, though whey protein maintains its dominance due to its superior nutritional profile. M&A activity has been moderate, with deal values averaging xx Million in the historical period (2019-2024). Recent examples include Fonterra's joint venture, signifying the ongoing consolidation within the industry. End-user demographics are shifting towards health-conscious consumers, particularly millennials and Gen Z, fueling demand for premium whey protein products.
- Market Concentration: xx% in 2025 (estimated)
- Top 5 Players Market Share: xx% (estimated)
- Average M&A Deal Value (2019-2024): xx Million
- Key Innovation Drivers: Demand for high-protein products, technological advancements in whey processing.
US Whey Protein Ingredients Industry Market Dynamics & Trends
The US whey protein ingredients market is experiencing robust growth, driven primarily by rising consumer awareness of the health benefits of protein, escalating demand for convenient and functional foods, and the expansion of the sports nutrition sector. The market is projected to exhibit a CAGR of xx% during the forecast period (2025-2033), with market penetration exceeding xx% by 2033. Technological disruptions, such as advancements in whey protein processing techniques (e.g., microfiltration and ultrafiltration) leading to improved protein quality and functionality, are reshaping the competitive landscape. Consumer preferences are shifting towards clean-label, organic, and sustainably sourced whey protein, prompting companies to adapt their sourcing and manufacturing processes. Competitive dynamics are characterized by intense rivalry among major players, focusing on product innovation, brand building, and strategic partnerships.
Dominant Regions & Segments in US Whey Protein Ingredients Industry
The Midwest region dominates the US whey protein ingredients market due to its high concentration of dairy farms and processing facilities, robust agricultural infrastructure, and favorable economic policies supporting the dairy industry. Within the segments, whey protein isolates account for the largest market share, followed by concentrates and hydrolyzed whey protein, reflecting consumer preference for high-protein, easily digestible products. The Food and Beverages segment demonstrates the highest demand, driven by the growing popularity of protein-enhanced beverages and functional foods.
- Key Drivers for Midwest Dominance:
- High concentration of dairy farms
- Robust agricultural infrastructure
- Favorable economic policies
- Dominant Segment: Whey Protein Isolates
- Largest End-User Segment: Food and Beverages
US Whey Protein Ingredients Industry Product Innovations
Recent innovations in the US whey protein ingredients industry focus on enhancing product functionality, improving digestibility, and meeting consumer demands for clean-label products. This includes the development of novel whey protein hydrolysates with enhanced bioavailability, the introduction of organic and sustainably sourced whey proteins, and the creation of whey protein-based functional ingredients designed to improve texture, taste, and nutritional value in a variety of food and beverage applications. These innovations are driven by technological advancements in whey processing and a greater focus on meeting evolving consumer expectations.
Report Scope & Segmentation Analysis
This report segments the US whey protein ingredients market by form (concentrates, hydrolyzed, isolates) and end-user (animal feed, food and beverages, sport/performance nutrition). Each segment is analyzed based on its market size, growth projections, and competitive dynamics. For example, the isolates segment shows strong growth driven by its high protein content and improved digestibility, while the food and beverages segment is experiencing expansion due to the inclusion of whey protein in an increasing variety of food products. The animal feed segment represents a substantial market driven by the need for high-quality protein in animal feed formulations.
Key Drivers of US Whey Protein Ingredients Industry Growth
The growth of the US whey protein ingredients industry is fueled by several factors. The increasing health consciousness among consumers and rising demand for high-protein foods and beverages are key drivers. Technological advancements in whey processing have also led to the development of improved protein products. Furthermore, favorable government regulations and policies related to the dairy industry and food safety have supported growth.
Challenges in the US Whey Protein Ingredients Industry Sector
The US whey protein ingredients industry faces challenges, including fluctuating raw material prices, stringent regulatory requirements regarding labeling and food safety, and intense competition from substitute protein sources like soy and pea protein. Supply chain disruptions can also affect production and profitability. These factors can lead to increased costs and potentially decreased profit margins for companies in the sector.
Emerging Opportunities in US Whey Protein Ingredients Industry
Emerging opportunities exist in the development of novel whey protein products catering to specific dietary needs, such as vegan whey protein alternatives or those tailored to specific health conditions. The growing interest in personalized nutrition and functional foods also presents opportunities for innovation. Moreover, expansion into new geographic markets and exploring partnerships with food and beverage manufacturers can drive future growth.
Leading Players in the US Whey Protein Ingredients Industry Market
- Hoogwegt Group
- Arla Foods amba
- MEGGLE GmbH & Co KG
- Grande Cheese Company
- Carbery Food Ingredients Limited
- Koninklijke FrieslandCampina NV
- Glanbia PLC
- Talley's Group Limited
- Dairy Farmers of America
- Agropur Dairy Cooperative
- Fonterra Co-operative Group Limited
- Tatua Co-operative Dairy Company Ltd
- Hilmar Cheese Company Inc
- Morinaga Milk Industry Co Ltd
- Groupe Lactalis
Key Developments in US Whey Protein Ingredients Industry
- November 2021: FrieslandCampina Ingredients showcased its fortified protein water concept, "45D," featuring Nutri Whey Isolate Clear, at Food Ingredients Europe 2021.
- June 2022: Fonterra JV launched Pro-Optima™, a functional whey protein concentrate (fWPC), through a joint venture with Tillamook County Creamery Association.
- August 2022: Optimum Nutrition introduced its Gold Standard Protein Shake, a ready-to-drink (RTD) product containing 24 grams of protein per serving.
Future Outlook for US Whey Protein Ingredients Market
The US whey protein ingredients market is poised for continued growth, driven by sustained demand from the food and beverage, sports nutrition, and animal feed sectors. Innovation in product formulations, coupled with a focus on sustainability and clean-label ingredients, will shape future market dynamics. Strategic collaborations and investments in research and development will be crucial for maintaining competitiveness and capturing emerging market opportunities.
US Whey Protein Ingredients Industry Segmentation
-
1. Form
- 1.1. Concentrates
- 1.2. Hydrolyzed
- 1.3. Isolates
-
2. End User
- 2.1. Animal Feed
-
2.2. Food and Beverages
-
2.2.1. By Sub End User
- 2.2.1.1. Bakery
- 2.2.1.2. Breakfast Cereals
- 2.2.1.3. Condiments/Sauces
- 2.2.1.4. Dairy and Dairy Alternative Products
- 2.2.1.5. RTE/RTC Food Products
- 2.2.1.6. Snacks
-
2.2.1. By Sub End User
- 2.3. Personal Care and Cosmetics
-
2.4. Supplements
- 2.4.1. Baby Food and Infant Formula
- 2.4.2. Elderly Nutrition and Medical Nutrition
- 2.4.3. Sport/Performance Nutrition
US Whey Protein Ingredients Industry Segmentation By Geography
-
1. North America
- 1.1. United States
- 1.2. Canada
- 1.3. Mexico
-
2. South America
- 2.1. Brazil
- 2.2. Argentina
- 2.3. Rest of South America
-
3. Europe
- 3.1. United Kingdom
- 3.2. Germany
- 3.3. France
- 3.4. Italy
- 3.5. Spain
- 3.6. Russia
- 3.7. Benelux
- 3.8. Nordics
- 3.9. Rest of Europe
-
4. Middle East & Africa
- 4.1. Turkey
- 4.2. Israel
- 4.3. GCC
- 4.4. North Africa
- 4.5. South Africa
- 4.6. Rest of Middle East & Africa
-
5. Asia Pacific
- 5.1. China
- 5.2. India
- 5.3. Japan
- 5.4. South Korea
- 5.5. ASEAN
- 5.6. Oceania
- 5.7. Rest of Asia Pacific
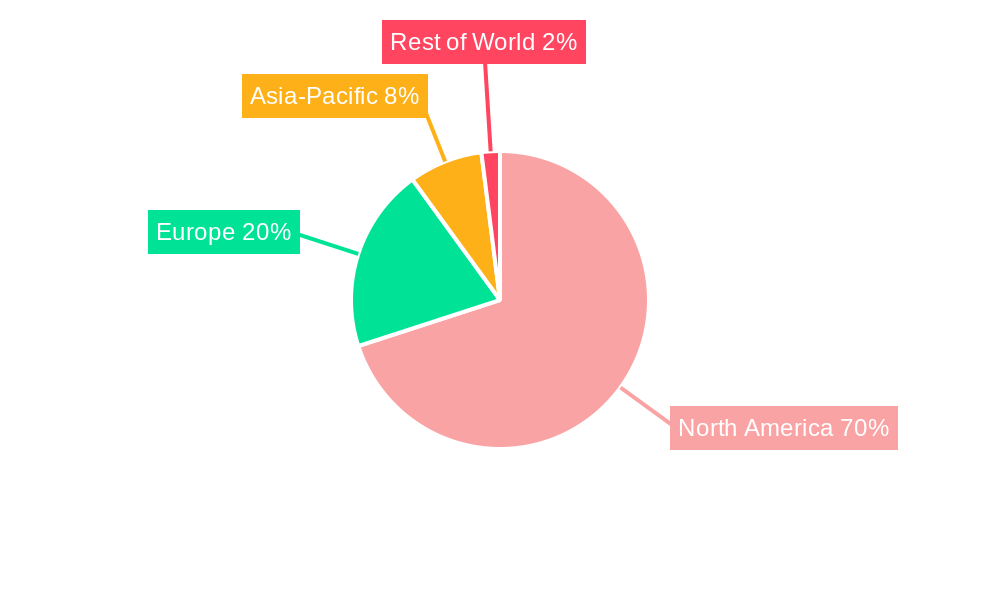
US Whey Protein Ingredients Industry Regional Market Share
Geographic Coverage of US Whey Protein Ingredients Industry
US Whey Protein Ingredients Industry REPORT HIGHLIGHTS
| Aspects | Details |
|---|---|
| Study Period | 2020-2034 |
| Base Year | 2025 |
| Estimated Year | 2026 |
| Forecast Period | 2026-2034 |
| Historical Period | 2020-2025 |
| Growth Rate | CAGR of 14.25% from 2020-2034 |
| Segmentation |
|
Table of Contents
- 1. Introduction
- 1.1. Research Scope
- 1.2. Market Segmentation
- 1.3. Research Methodology
- 1.4. Definitions and Assumptions
- 2. Executive Summary
- 2.1. Introduction
- 3. Market Dynamics
- 3.1. Introduction
- 3.2. Market Drivers
- 3.2.1. Rising Health and Wellness Trends Drives the Market; Rising Demand for functional Food Drives the Market
- 3.3. Market Restrains
- 3.3.1. High Competition from Other Protein Sources
- 3.4. Market Trends
- 3.4.1. OTHER KEY INDUSTRY TRENDS COVERED IN THE REPORT
- 4. Market Factor Analysis
- 4.1. Porters Five Forces
- 4.2. Supply/Value Chain
- 4.3. PESTEL analysis
- 4.4. Market Entropy
- 4.5. Patent/Trademark Analysis
- 5. Global US Whey Protein Ingredients Industry Analysis, Insights and Forecast, 2020-2032
- 5.1. Market Analysis, Insights and Forecast - by Form
- 5.1.1. Concentrates
- 5.1.2. Hydrolyzed
- 5.1.3. Isolates
- 5.2. Market Analysis, Insights and Forecast - by End User
- 5.2.1. Animal Feed
- 5.2.2. Food and Beverages
- 5.2.2.1. By Sub End User
- 5.2.2.1.1. Bakery
- 5.2.2.1.2. Breakfast Cereals
- 5.2.2.1.3. Condiments/Sauces
- 5.2.2.1.4. Dairy and Dairy Alternative Products
- 5.2.2.1.5. RTE/RTC Food Products
- 5.2.2.1.6. Snacks
- 5.2.2.1. By Sub End User
- 5.2.3. Personal Care and Cosmetics
- 5.2.4. Supplements
- 5.2.4.1. Baby Food and Infant Formula
- 5.2.4.2. Elderly Nutrition and Medical Nutrition
- 5.2.4.3. Sport/Performance Nutrition
- 5.3. Market Analysis, Insights and Forecast - by Region
- 5.3.1. North America
- 5.3.2. South America
- 5.3.3. Europe
- 5.3.4. Middle East & Africa
- 5.3.5. Asia Pacific
- 5.1. Market Analysis, Insights and Forecast - by Form
- 6. North America US Whey Protein Ingredients Industry Analysis, Insights and Forecast, 2020-2032
- 6.1. Market Analysis, Insights and Forecast - by Form
- 6.1.1. Concentrates
- 6.1.2. Hydrolyzed
- 6.1.3. Isolates
- 6.2. Market Analysis, Insights and Forecast - by End User
- 6.2.1. Animal Feed
- 6.2.2. Food and Beverages
- 6.2.2.1. By Sub End User
- 6.2.2.1.1. Bakery
- 6.2.2.1.2. Breakfast Cereals
- 6.2.2.1.3. Condiments/Sauces
- 6.2.2.1.4. Dairy and Dairy Alternative Products
- 6.2.2.1.5. RTE/RTC Food Products
- 6.2.2.1.6. Snacks
- 6.2.2.1. By Sub End User
- 6.2.3. Personal Care and Cosmetics
- 6.2.4. Supplements
- 6.2.4.1. Baby Food and Infant Formula
- 6.2.4.2. Elderly Nutrition and Medical Nutrition
- 6.2.4.3. Sport/Performance Nutrition
- 6.1. Market Analysis, Insights and Forecast - by Form
- 7. South America US Whey Protein Ingredients Industry Analysis, Insights and Forecast, 2020-2032
- 7.1. Market Analysis, Insights and Forecast - by Form
- 7.1.1. Concentrates
- 7.1.2. Hydrolyzed
- 7.1.3. Isolates
- 7.2. Market Analysis, Insights and Forecast - by End User
- 7.2.1. Animal Feed
- 7.2.2. Food and Beverages
- 7.2.2.1. By Sub End User
- 7.2.2.1.1. Bakery
- 7.2.2.1.2. Breakfast Cereals
- 7.2.2.1.3. Condiments/Sauces
- 7.2.2.1.4. Dairy and Dairy Alternative Products
- 7.2.2.1.5. RTE/RTC Food Products
- 7.2.2.1.6. Snacks
- 7.2.2.1. By Sub End User
- 7.2.3. Personal Care and Cosmetics
- 7.2.4. Supplements
- 7.2.4.1. Baby Food and Infant Formula
- 7.2.4.2. Elderly Nutrition and Medical Nutrition
- 7.2.4.3. Sport/Performance Nutrition
- 7.1. Market Analysis, Insights and Forecast - by Form
- 8. Europe US Whey Protein Ingredients Industry Analysis, Insights and Forecast, 2020-2032
- 8.1. Market Analysis, Insights and Forecast - by Form
- 8.1.1. Concentrates
- 8.1.2. Hydrolyzed
- 8.1.3. Isolates
- 8.2. Market Analysis, Insights and Forecast - by End User
- 8.2.1. Animal Feed
- 8.2.2. Food and Beverages
- 8.2.2.1. By Sub End User
- 8.2.2.1.1. Bakery
- 8.2.2.1.2. Breakfast Cereals
- 8.2.2.1.3. Condiments/Sauces
- 8.2.2.1.4. Dairy and Dairy Alternative Products
- 8.2.2.1.5. RTE/RTC Food Products
- 8.2.2.1.6. Snacks
- 8.2.2.1. By Sub End User
- 8.2.3. Personal Care and Cosmetics
- 8.2.4. Supplements
- 8.2.4.1. Baby Food and Infant Formula
- 8.2.4.2. Elderly Nutrition and Medical Nutrition
- 8.2.4.3. Sport/Performance Nutrition
- 8.1. Market Analysis, Insights and Forecast - by Form
- 9. Middle East & Africa US Whey Protein Ingredients Industry Analysis, Insights and Forecast, 2020-2032
- 9.1. Market Analysis, Insights and Forecast - by Form
- 9.1.1. Concentrates
- 9.1.2. Hydrolyzed
- 9.1.3. Isolates
- 9.2. Market Analysis, Insights and Forecast - by End User
- 9.2.1. Animal Feed
- 9.2.2. Food and Beverages
- 9.2.2.1. By Sub End User
- 9.2.2.1.1. Bakery
- 9.2.2.1.2. Breakfast Cereals
- 9.2.2.1.3. Condiments/Sauces
- 9.2.2.1.4. Dairy and Dairy Alternative Products
- 9.2.2.1.5. RTE/RTC Food Products
- 9.2.2.1.6. Snacks
- 9.2.2.1. By Sub End User
- 9.2.3. Personal Care and Cosmetics
- 9.2.4. Supplements
- 9.2.4.1. Baby Food and Infant Formula
- 9.2.4.2. Elderly Nutrition and Medical Nutrition
- 9.2.4.3. Sport/Performance Nutrition
- 9.1. Market Analysis, Insights and Forecast - by Form
- 10. Asia Pacific US Whey Protein Ingredients Industry Analysis, Insights and Forecast, 2020-2032
- 10.1. Market Analysis, Insights and Forecast - by Form
- 10.1.1. Concentrates
- 10.1.2. Hydrolyzed
- 10.1.3. Isolates
- 10.2. Market Analysis, Insights and Forecast - by End User
- 10.2.1. Animal Feed
- 10.2.2. Food and Beverages
- 10.2.2.1. By Sub End User
- 10.2.2.1.1. Bakery
- 10.2.2.1.2. Breakfast Cereals
- 10.2.2.1.3. Condiments/Sauces
- 10.2.2.1.4. Dairy and Dairy Alternative Products
- 10.2.2.1.5. RTE/RTC Food Products
- 10.2.2.1.6. Snacks
- 10.2.2.1. By Sub End User
- 10.2.3. Personal Care and Cosmetics
- 10.2.4. Supplements
- 10.2.4.1. Baby Food and Infant Formula
- 10.2.4.2. Elderly Nutrition and Medical Nutrition
- 10.2.4.3. Sport/Performance Nutrition
- 10.1. Market Analysis, Insights and Forecast - by Form
- 11. Competitive Analysis
- 11.1. Global Market Share Analysis 2025
- 11.2. Company Profiles
- 11.2.1 Hoogwegt Group
- 11.2.1.1. Overview
- 11.2.1.2. Products
- 11.2.1.3. SWOT Analysis
- 11.2.1.4. Recent Developments
- 11.2.1.5. Financials (Based on Availability)
- 11.2.2 Arla Foods amba
- 11.2.2.1. Overview
- 11.2.2.2. Products
- 11.2.2.3. SWOT Analysis
- 11.2.2.4. Recent Developments
- 11.2.2.5. Financials (Based on Availability)
- 11.2.3 MEGGLE GmbH & Co KG
- 11.2.3.1. Overview
- 11.2.3.2. Products
- 11.2.3.3. SWOT Analysis
- 11.2.3.4. Recent Developments
- 11.2.3.5. Financials (Based on Availability)
- 11.2.4 Grande Cheese Company
- 11.2.4.1. Overview
- 11.2.4.2. Products
- 11.2.4.3. SWOT Analysis
- 11.2.4.4. Recent Developments
- 11.2.4.5. Financials (Based on Availability)
- 11.2.5 Carbery Food Ingredients Limited
- 11.2.5.1. Overview
- 11.2.5.2. Products
- 11.2.5.3. SWOT Analysis
- 11.2.5.4. Recent Developments
- 11.2.5.5. Financials (Based on Availability)
- 11.2.6 Koninklijke FrieslandCampina NV
- 11.2.6.1. Overview
- 11.2.6.2. Products
- 11.2.6.3. SWOT Analysis
- 11.2.6.4. Recent Developments
- 11.2.6.5. Financials (Based on Availability)
- 11.2.7 Glanbia PLC
- 11.2.7.1. Overview
- 11.2.7.2. Products
- 11.2.7.3. SWOT Analysis
- 11.2.7.4. Recent Developments
- 11.2.7.5. Financials (Based on Availability)
- 11.2.8 Talley's Group Limited
- 11.2.8.1. Overview
- 11.2.8.2. Products
- 11.2.8.3. SWOT Analysis
- 11.2.8.4. Recent Developments
- 11.2.8.5. Financials (Based on Availability)
- 11.2.9 Dairy Farmers of America
- 11.2.9.1. Overview
- 11.2.9.2. Products
- 11.2.9.3. SWOT Analysis
- 11.2.9.4. Recent Developments
- 11.2.9.5. Financials (Based on Availability)
- 11.2.10 Agropur Dairy Cooperative
- 11.2.10.1. Overview
- 11.2.10.2. Products
- 11.2.10.3. SWOT Analysis
- 11.2.10.4. Recent Developments
- 11.2.10.5. Financials (Based on Availability)
- 11.2.11 Fonterra Co-operative Group Limited
- 11.2.11.1. Overview
- 11.2.11.2. Products
- 11.2.11.3. SWOT Analysis
- 11.2.11.4. Recent Developments
- 11.2.11.5. Financials (Based on Availability)
- 11.2.12 Tatua Co-operative Dairy Company Lt
- 11.2.12.1. Overview
- 11.2.12.2. Products
- 11.2.12.3. SWOT Analysis
- 11.2.12.4. Recent Developments
- 11.2.12.5. Financials (Based on Availability)
- 11.2.13 Hilmar Cheese Company Inc
- 11.2.13.1. Overview
- 11.2.13.2. Products
- 11.2.13.3. SWOT Analysis
- 11.2.13.4. Recent Developments
- 11.2.13.5. Financials (Based on Availability)
- 11.2.14 Morinaga Milk Industry Co Ltd
- 11.2.14.1. Overview
- 11.2.14.2. Products
- 11.2.14.3. SWOT Analysis
- 11.2.14.4. Recent Developments
- 11.2.14.5. Financials (Based on Availability)
- 11.2.15 Groupe Lactalis
- 11.2.15.1. Overview
- 11.2.15.2. Products
- 11.2.15.3. SWOT Analysis
- 11.2.15.4. Recent Developments
- 11.2.15.5. Financials (Based on Availability)
- 11.2.1 Hoogwegt Group
List of Figures
- Figure 1: Global US Whey Protein Ingredients Industry Revenue Breakdown (billion, %) by Region 2025 & 2033
- Figure 2: North America US Whey Protein Ingredients Industry Revenue (billion), by Form 2025 & 2033
- Figure 3: North America US Whey Protein Ingredients Industry Revenue Share (%), by Form 2025 & 2033
- Figure 4: North America US Whey Protein Ingredients Industry Revenue (billion), by End User 2025 & 2033
- Figure 5: North America US Whey Protein Ingredients Industry Revenue Share (%), by End User 2025 & 2033
- Figure 6: North America US Whey Protein Ingredients Industry Revenue (billion), by Country 2025 & 2033
- Figure 7: North America US Whey Protein Ingredients Industry Revenue Share (%), by Country 2025 & 2033
- Figure 8: South America US Whey Protein Ingredients Industry Revenue (billion), by Form 2025 & 2033
- Figure 9: South America US Whey Protein Ingredients Industry Revenue Share (%), by Form 2025 & 2033
- Figure 10: South America US Whey Protein Ingredients Industry Revenue (billion), by End User 2025 & 2033
- Figure 11: South America US Whey Protein Ingredients Industry Revenue Share (%), by End User 2025 & 2033
- Figure 12: South America US Whey Protein Ingredients Industry Revenue (billion), by Country 2025 & 2033
- Figure 13: South America US Whey Protein Ingredients Industry Revenue Share (%), by Country 2025 & 2033
- Figure 14: Europe US Whey Protein Ingredients Industry Revenue (billion), by Form 2025 & 2033
- Figure 15: Europe US Whey Protein Ingredients Industry Revenue Share (%), by Form 2025 & 2033
- Figure 16: Europe US Whey Protein Ingredients Industry Revenue (billion), by End User 2025 & 2033
- Figure 17: Europe US Whey Protein Ingredients Industry Revenue Share (%), by End User 2025 & 2033
- Figure 18: Europe US Whey Protein Ingredients Industry Revenue (billion), by Country 2025 & 2033
- Figure 19: Europe US Whey Protein Ingredients Industry Revenue Share (%), by Country 2025 & 2033
- Figure 20: Middle East & Africa US Whey Protein Ingredients Industry Revenue (billion), by Form 2025 & 2033
- Figure 21: Middle East & Africa US Whey Protein Ingredients Industry Revenue Share (%), by Form 2025 & 2033
- Figure 22: Middle East & Africa US Whey Protein Ingredients Industry Revenue (billion), by End User 2025 & 2033
- Figure 23: Middle East & Africa US Whey Protein Ingredients Industry Revenue Share (%), by End User 2025 & 2033
- Figure 24: Middle East & Africa US Whey Protein Ingredients Industry Revenue (billion), by Country 2025 & 2033
- Figure 25: Middle East & Africa US Whey Protein Ingredients Industry Revenue Share (%), by Country 2025 & 2033
- Figure 26: Asia Pacific US Whey Protein Ingredients Industry Revenue (billion), by Form 2025 & 2033
- Figure 27: Asia Pacific US Whey Protein Ingredients Industry Revenue Share (%), by Form 2025 & 2033
- Figure 28: Asia Pacific US Whey Protein Ingredients Industry Revenue (billion), by End User 2025 & 2033
- Figure 29: Asia Pacific US Whey Protein Ingredients Industry Revenue Share (%), by End User 2025 & 2033
- Figure 30: Asia Pacific US Whey Protein Ingredients Industry Revenue (billion), by Country 2025 & 2033
- Figure 31: Asia Pacific US Whey Protein Ingredients Industry Revenue Share (%), by Country 2025 & 2033
List of Tables
- Table 1: Global US Whey Protein Ingredients Industry Revenue billion Forecast, by Form 2020 & 2033
- Table 2: Global US Whey Protein Ingredients Industry Revenue billion Forecast, by End User 2020 & 2033
- Table 3: Global US Whey Protein Ingredients Industry Revenue billion Forecast, by Region 2020 & 2033
- Table 4: Global US Whey Protein Ingredients Industry Revenue billion Forecast, by Form 2020 & 2033
- Table 5: Global US Whey Protein Ingredients Industry Revenue billion Forecast, by End User 2020 & 2033
- Table 6: Global US Whey Protein Ingredients Industry Revenue billion Forecast, by Country 2020 & 2033
- Table 7: United States US Whey Protein Ingredients Industry Revenue (billion) Forecast, by Application 2020 & 2033
- Table 8: Canada US Whey Protein Ingredients Industry Revenue (billion) Forecast, by Application 2020 & 2033
- Table 9: Mexico US Whey Protein Ingredients Industry Revenue (billion) Forecast, by Application 2020 & 2033
- Table 10: Global US Whey Protein Ingredients Industry Revenue billion Forecast, by Form 2020 & 2033
- Table 11: Global US Whey Protein Ingredients Industry Revenue billion Forecast, by End User 2020 & 2033
- Table 12: Global US Whey Protein Ingredients Industry Revenue billion Forecast, by Country 2020 & 2033
- Table 13: Brazil US Whey Protein Ingredients Industry Revenue (billion) Forecast, by Application 2020 & 2033
- Table 14: Argentina US Whey Protein Ingredients Industry Revenue (billion) Forecast, by Application 2020 & 2033
- Table 15: Rest of South America US Whey Protein Ingredients Industry Revenue (billion) Forecast, by Application 2020 & 2033
- Table 16: Global US Whey Protein Ingredients Industry Revenue billion Forecast, by Form 2020 & 2033
- Table 17: Global US Whey Protein Ingredients Industry Revenue billion Forecast, by End User 2020 & 2033
- Table 18: Global US Whey Protein Ingredients Industry Revenue billion Forecast, by Country 2020 & 2033
- Table 19: United Kingdom US Whey Protein Ingredients Industry Revenue (billion) Forecast, by Application 2020 & 2033
- Table 20: Germany US Whey Protein Ingredients Industry Revenue (billion) Forecast, by Application 2020 & 2033
- Table 21: France US Whey Protein Ingredients Industry Revenue (billion) Forecast, by Application 2020 & 2033
- Table 22: Italy US Whey Protein Ingredients Industry Revenue (billion) Forecast, by Application 2020 & 2033
- Table 23: Spain US Whey Protein Ingredients Industry Revenue (billion) Forecast, by Application 2020 & 2033
- Table 24: Russia US Whey Protein Ingredients Industry Revenue (billion) Forecast, by Application 2020 & 2033
- Table 25: Benelux US Whey Protein Ingredients Industry Revenue (billion) Forecast, by Application 2020 & 2033
- Table 26: Nordics US Whey Protein Ingredients Industry Revenue (billion) Forecast, by Application 2020 & 2033
- Table 27: Rest of Europe US Whey Protein Ingredients Industry Revenue (billion) Forecast, by Application 2020 & 2033
- Table 28: Global US Whey Protein Ingredients Industry Revenue billion Forecast, by Form 2020 & 2033
- Table 29: Global US Whey Protein Ingredients Industry Revenue billion Forecast, by End User 2020 & 2033
- Table 30: Global US Whey Protein Ingredients Industry Revenue billion Forecast, by Country 2020 & 2033
- Table 31: Turkey US Whey Protein Ingredients Industry Revenue (billion) Forecast, by Application 2020 & 2033
- Table 32: Israel US Whey Protein Ingredients Industry Revenue (billion) Forecast, by Application 2020 & 2033
- Table 33: GCC US Whey Protein Ingredients Industry Revenue (billion) Forecast, by Application 2020 & 2033
- Table 34: North Africa US Whey Protein Ingredients Industry Revenue (billion) Forecast, by Application 2020 & 2033
- Table 35: South Africa US Whey Protein Ingredients Industry Revenue (billion) Forecast, by Application 2020 & 2033
- Table 36: Rest of Middle East & Africa US Whey Protein Ingredients Industry Revenue (billion) Forecast, by Application 2020 & 2033
- Table 37: Global US Whey Protein Ingredients Industry Revenue billion Forecast, by Form 2020 & 2033
- Table 38: Global US Whey Protein Ingredients Industry Revenue billion Forecast, by End User 2020 & 2033
- Table 39: Global US Whey Protein Ingredients Industry Revenue billion Forecast, by Country 2020 & 2033
- Table 40: China US Whey Protein Ingredients Industry Revenue (billion) Forecast, by Application 2020 & 2033
- Table 41: India US Whey Protein Ingredients Industry Revenue (billion) Forecast, by Application 2020 & 2033
- Table 42: Japan US Whey Protein Ingredients Industry Revenue (billion) Forecast, by Application 2020 & 2033
- Table 43: South Korea US Whey Protein Ingredients Industry Revenue (billion) Forecast, by Application 2020 & 2033
- Table 44: ASEAN US Whey Protein Ingredients Industry Revenue (billion) Forecast, by Application 2020 & 2033
- Table 45: Oceania US Whey Protein Ingredients Industry Revenue (billion) Forecast, by Application 2020 & 2033
- Table 46: Rest of Asia Pacific US Whey Protein Ingredients Industry Revenue (billion) Forecast, by Application 2020 & 2033
Frequently Asked Questions
1. What is the projected Compound Annual Growth Rate (CAGR) of the US Whey Protein Ingredients Industry?
The projected CAGR is approximately 14.25%.
2. Which companies are prominent players in the US Whey Protein Ingredients Industry?
Key companies in the market include Hoogwegt Group, Arla Foods amba, MEGGLE GmbH & Co KG, Grande Cheese Company, Carbery Food Ingredients Limited, Koninklijke FrieslandCampina NV, Glanbia PLC, Talley's Group Limited, Dairy Farmers of America, Agropur Dairy Cooperative, Fonterra Co-operative Group Limited, Tatua Co-operative Dairy Company Lt, Hilmar Cheese Company Inc, Morinaga Milk Industry Co Ltd, Groupe Lactalis.
3. What are the main segments of the US Whey Protein Ingredients Industry?
The market segments include Form, End User.
4. Can you provide details about the market size?
The market size is estimated to be USD 8.36 billion as of 2022.
5. What are some drivers contributing to market growth?
Rising Health and Wellness Trends Drives the Market; Rising Demand for functional Food Drives the Market.
6. What are the notable trends driving market growth?
OTHER KEY INDUSTRY TRENDS COVERED IN THE REPORT.
7. Are there any restraints impacting market growth?
High Competition from Other Protein Sources.
8. Can you provide examples of recent developments in the market?
August 2022: Optimum Nutrition announced the launch of its new Gold Standard Protein Shake. The RTD is available in chocolate and vanilla flavors and is formulated with 24 grams of protein per serving.June 2022: Fonterra JV entered a joint venture with Tillamook County Creamery Association (TCCA) and a three-mile canyon farm in the United States to launch Pro-Optima TM, a grade A functional whey protein concentrate (fWPC).November 2021: At the Food ingredient Europe 2021, FrieslandCampina Ingredients exhibited 45D, its fortified protein water concept containing Nutri Whey Isolate Clear, in the New Product Zone.
9. What pricing options are available for accessing the report?
Pricing options include single-user, multi-user, and enterprise licenses priced at USD 3800, USD 4500, and USD 5800 respectively.
10. Is the market size provided in terms of value or volume?
The market size is provided in terms of value, measured in billion.
11. Are there any specific market keywords associated with the report?
Yes, the market keyword associated with the report is "US Whey Protein Ingredients Industry," which aids in identifying and referencing the specific market segment covered.
12. How do I determine which pricing option suits my needs best?
The pricing options vary based on user requirements and access needs. Individual users may opt for single-user licenses, while businesses requiring broader access may choose multi-user or enterprise licenses for cost-effective access to the report.
13. Are there any additional resources or data provided in the US Whey Protein Ingredients Industry report?
While the report offers comprehensive insights, it's advisable to review the specific contents or supplementary materials provided to ascertain if additional resources or data are available.
14. How can I stay updated on further developments or reports in the US Whey Protein Ingredients Industry?
To stay informed about further developments, trends, and reports in the US Whey Protein Ingredients Industry, consider subscribing to industry newsletters, following relevant companies and organizations, or regularly checking reputable industry news sources and publications.
Methodology
Step 1 - Identification of Relevant Samples Size from Population Database


Step 2 - Approaches for Defining Global Market Size (Value, Volume* & Price*)

Note*: In applicable scenarios
Step 3 - Data Sources
Primary Research
- Web Analytics
- Survey Reports
- Research Institute
- Latest Research Reports
- Opinion Leaders
Secondary Research
- Annual Reports
- White Paper
- Latest Press Release
- Industry Association
- Paid Database
- Investor Presentations

Step 4 - Data Triangulation
Involves using different sources of information in order to increase the validity of a study
These sources are likely to be stakeholders in a program - participants, other researchers, program staff, other community members, and so on.
Then we put all data in single framework & apply various statistical tools to find out the dynamic on the market.
During the analysis stage, feedback from the stakeholder groups would be compared to determine areas of agreement as well as areas of divergence