
Key Insights
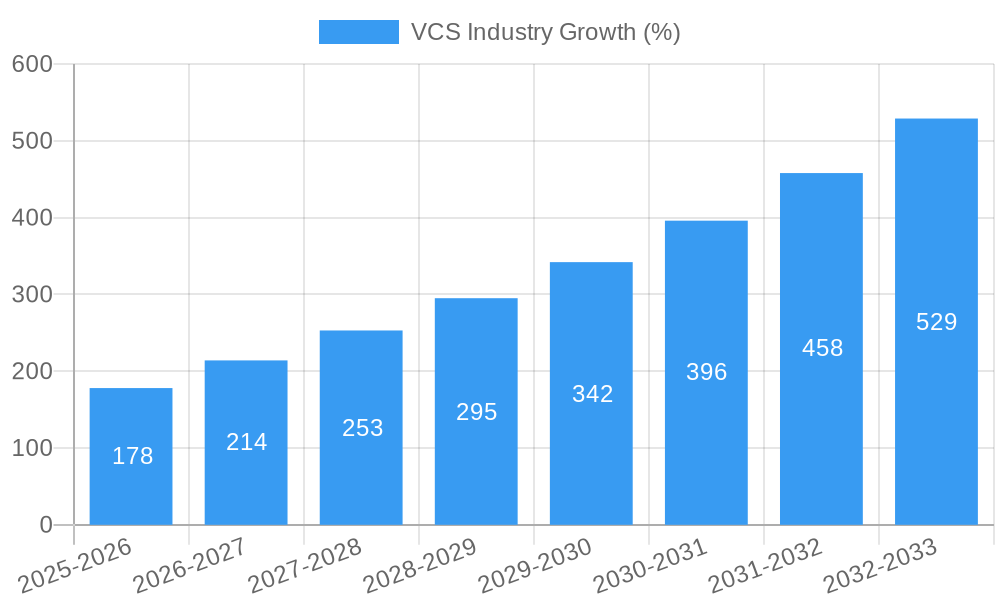
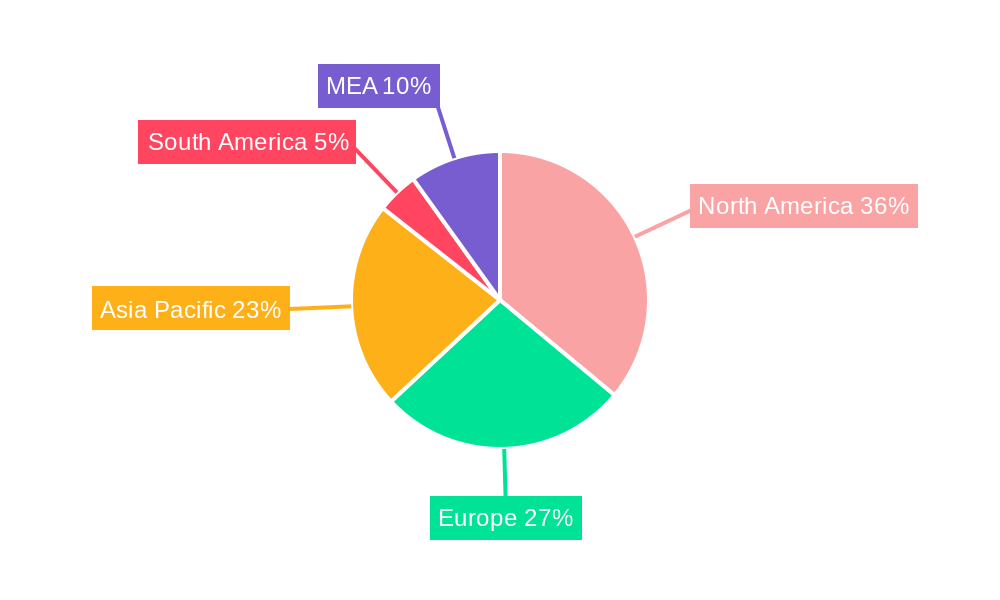
The Version Control System (VCS) market is experiencing robust growth, projected to reach $1.11 billion in 2025 and expand at a Compound Annual Growth Rate (CAGR) of 16.63% from 2025 to 2033. This expansion is fueled by several key drivers. The increasing adoption of DevOps methodologies and Agile software development across various industries, including IT & Telecom, Retail & E-commerce, and Healthcare & Life Sciences, necessitates efficient version control. The rising need for collaborative software development, enhanced security features, and improved code management further fuels market growth. The shift towards cloud-based deployment models, offering scalability and cost-effectiveness, is a significant trend, alongside the increasing popularity of distributed VCS solutions that cater to geographically dispersed teams. However, the market faces certain restraints such as the complexities associated with migrating to new VCS platforms and the potential security risks associated with cloud-based solutions. The market is segmented by end-user industry, VCS type (distributed and centralized), and deployment mode (on-premise and on-cloud). North America currently holds a significant market share, driven by the early adoption of advanced technologies and a robust IT infrastructure. However, the Asia Pacific region is projected to witness substantial growth in the coming years due to rapid digital transformation initiatives and a burgeoning tech industry. Competition is intense, with major players including GitLab, CollabNet, Perforce, and Microsoft vying for market dominance through innovation and strategic partnerships.
The projected growth of the VCS market will likely be influenced by several factors. Continued technological advancements leading to improved features and user-friendliness will contribute to market expansion. The increasing demand for efficient and reliable software development processes within organizations of all sizes will drive adoption. Government initiatives promoting digitalization and the adoption of advanced technologies in different regions will also stimulate market growth. However, challenges such as the need for skilled professionals to effectively manage and utilize VCS and the potential for integration challenges with existing systems could moderate the growth rate. Strategic acquisitions and mergers within the VCS landscape will likely shape the competitive landscape, influencing market share and driving further innovation. The ongoing evolution of security protocols and compliance regulations will also play a significant role in shaping the future of the VCS market.

VCS Industry Market Report: 2019-2033
This comprehensive report provides an in-depth analysis of the Version Control System (VCS) industry, offering invaluable insights for industry professionals, investors, and strategists. The report covers the period from 2019 to 2033, with a focus on market dynamics, key players, and future growth potential. With a base year of 2025 and an estimated year of 2025, this report projects market size in Millions and provides actionable forecasts from 2025 to 2033.
VCS Industry Market Structure & Innovation Trends
The VCS market is characterized by a dynamic interplay of established players and emerging innovators. Market concentration is moderate, with several key players holding significant market share, while numerous smaller companies offer specialized solutions. GitLab Inc, GitHub Inc, Bitbucket (Atlassian), and Microsoft Corporation are prominent examples, though precise market share figures vary across segments and are constantly shifting. The total market value is estimated to be in the range of xx Million in 2025. Innovation is driven by increasing demand for collaborative development, cloud-based solutions, and enhanced security features.
- Market Concentration: Moderate, with top players holding significant but not dominant shares.
- Innovation Drivers: Cloud adoption, DevOps practices, enhanced collaboration tools, and improved security features.
- Regulatory Frameworks: Vary by region, impacting data privacy and security compliance.
- Product Substitutes: Limited, as VCS is integral to software development workflows.
- End-User Demographics: Primarily software developers, IT professionals, and project managers across diverse industries.
- M&A Activities: The historical period (2019-2024) saw xx Million in M&A deals. The forecast period anticipates continued M&A activity, driven by consolidation and expansion into new markets, though the specific value is projected to be in the range of xx Million.
VCS Industry Market Dynamics & Trends
The VCS market exhibits robust growth, propelled by the increasing adoption of agile development methodologies and the rise of DevOps practices. The global market is projected to reach xx Million by 2033, exhibiting a compound annual growth rate (CAGR) of xx% during the forecast period (2025-2033). Market penetration continues to increase across various industries, especially IT and Telecom, and Retail & E-commerce, driven by the need for efficient code management and streamlined collaboration. Technological disruptions, such as the increasing adoption of AI-powered tools for code analysis and automation, are further shaping market dynamics. Competitive dynamics are intense, with companies focusing on product innovation, strategic partnerships, and expanding their cloud-based offerings.
Dominant Regions & Segments in VCS Industry
The North American region currently holds a dominant position in the VCS market, driven by a high concentration of tech companies and early adoption of advanced technologies. Within market segments:
End-user Industry: The IT and Telecom sector accounts for the largest segment, followed by Retail & E-commerce and Healthcare and Life Sciences. Growth drivers include the rapid digital transformation and increasing software development needs.
VCS Type: Distributed VCS (e.g., Git) dominates the market due to its flexibility and scalability. However, Centralized VCS retains significant share in specific enterprise environments.
Deployment Mode: On-cloud deployment is rapidly gaining traction, driven by cost-effectiveness and accessibility. On-premise deployments remain relevant in organizations with stringent security requirements.
Key Drivers for North America: Strong technological infrastructure, high R&D investment, and a large pool of skilled developers.
Key Drivers for other regions: Government initiatives promoting digital transformation, increasing internet penetration, and growing adoption of agile methodologies.
VCS Industry Product Innovations
Recent product innovations in the VCS industry focus on improving collaboration, security, and integration with DevOps tools. Features such as enhanced code review tools, improved branching strategies, and better integration with CI/CD pipelines are driving adoption. The market is witnessing a shift towards cloud-native VCS solutions that offer enhanced scalability, flexibility, and accessibility.
Report Scope & Segmentation Analysis
This report segments the VCS market by end-user industry (IT & Telecom, Retail & E-commerce, Healthcare & Life Sciences, BFSI, Other), VCS type (Distributed, Centralized), and deployment mode (On-premise, On-cloud). Each segment's growth projections, market size (in Millions), and competitive dynamics are analyzed in detail. For instance, the IT & Telecom segment is projected to maintain significant growth due to the increasing demand for software solutions. The Distributed VCS segment is expected to dominate, while cloud deployment will grow exponentially.
Key Drivers of VCS Industry Growth
Several factors drive the growth of the VCS industry:
- Technological advancements: Development of cloud-based VCS solutions, AI-powered code analysis tools, and enhanced collaboration features.
- Economic factors: Increasing IT spending across industries and the rising adoption of agile development methodologies.
- Regulatory factors: Data privacy regulations are indirectly driving demand for secure VCS solutions.
Challenges in the VCS Industry Sector
The VCS industry faces several challenges:
- Security concerns: Protecting sensitive code and data from breaches and unauthorized access. This impacts market growth by xx Million annually.
- Integration complexities: Integrating VCS with other DevOps tools and enterprise systems can be complex and time-consuming.
- Competitive pressures: Intense competition among vendors requires continuous innovation and differentiation.
Emerging Opportunities in VCS Industry
Emerging opportunities include:
- AI-powered code analysis and automation: Tools leveraging AI to improve code quality, identify bugs, and automate repetitive tasks.
- Integration with emerging technologies: Integrating VCS with blockchain, IoT, and other technologies.
- Expansion into new markets: Targeting industries with limited VCS adoption, such as the education sector.
Leading Players in the VCS Industry Market
- GitLab Inc
- CollabNet Inc
- Perforce Software Inc
- Beanstalk (Wildbit LLC)
- Microsoft Corporation
- Bitbucket org (Atlassian Corporation Plc)
- Amazon Web Services Inc
- APAChe Software Foundation
- Github Inc
- Dynamsoft Corporatio
Key Developments in VCS Industry
- September 2023: Accenture and Workday's expanded partnership to create agile, data-driven finance solutions impacts the adoption of VCS within targeted industries.
- December 2022: Microsoft's new Git version control feature for canvas apps significantly improves collaboration in distributed development environments.
- September 2022: WebKit's migration to GitHub highlights the platform's growing dominance and the benefits of its large developer community and automation features.
Future Outlook for VCS Industry Market
The VCS market is poised for continued robust growth, driven by increasing demand for cloud-based solutions, the rising adoption of DevOps, and the emergence of AI-powered tools. Strategic partnerships, acquisitions, and continuous innovation will play a vital role in shaping the future landscape. The market is projected to reach xx Million by 2033.
VCS Industry Segmentation
-
1. Deployment Mode
- 1.1. On-Premise
- 1.2. On-Cloud
-
2. End-user Industry
- 2.1. IT and Telecom
- 2.2. Retail & E-commerce
- 2.3. Healthcare and Life Sciences
- 2.4. BFSI
- 2.5. Other
-
3. Type
- 3.1. Distributed VCS
- 3.2. Centralized VCS
VCS Industry Segmentation By Geography
- 1. North America
- 2. Europe
- 3. Asia Pacific
- 4. Latin America
- 5. Middle East and Africa
VCS Industry REPORT HIGHLIGHTS
| Aspects | Details |
|---|---|
| Study Period | 2019-2033 |
| Base Year | 2024 |
| Estimated Year | 2025 |
| Forecast Period | 2025-2033 |
| Historical Period | 2019-2024 |
| Growth Rate | CAGR of 16.63% from 2019-2033 |
| Segmentation |
|
Table of Contents
- 1. Introduction
- 1.1. Research Scope
- 1.2. Market Segmentation
- 1.3. Research Methodology
- 1.4. Definitions and Assumptions
- 2. Executive Summary
- 2.1. Introduction
- 3. Market Dynamics
- 3.1. Introduction
- 3.2. Market Drivers
- 3.2.1. Digitization of Business Processes Leading to Adoption of Software; Increasing Demand for Reduced Complexities in Software Development and Cost Optimization
- 3.3. Market Restrains
- 3.3.1. Use of Diversified Software Applications in Organizations; Growing Complexity Due to Massive Data Generation
- 3.4. Market Trends
- 3.4.1. BFSI Industry Expected to Hold Significant Share
- 4. Market Factor Analysis
- 4.1. Porters Five Forces
- 4.2. Supply/Value Chain
- 4.3. PESTEL analysis
- 4.4. Market Entropy
- 4.5. Patent/Trademark Analysis
- 5. Global VCS Industry Analysis, Insights and Forecast, 2019-2031
- 5.1. Market Analysis, Insights and Forecast - by Deployment Mode
- 5.1.1. On-Premise
- 5.1.2. On-Cloud
- 5.2. Market Analysis, Insights and Forecast - by End-user Industry
- 5.2.1. IT and Telecom
- 5.2.2. Retail & E-commerce
- 5.2.3. Healthcare and Life Sciences
- 5.2.4. BFSI
- 5.2.5. Other
- 5.3. Market Analysis, Insights and Forecast - by Type
- 5.3.1. Distributed VCS
- 5.3.2. Centralized VCS
- 5.4. Market Analysis, Insights and Forecast - by Region
- 5.4.1. North America
- 5.4.2. Europe
- 5.4.3. Asia Pacific
- 5.4.4. Latin America
- 5.4.5. Middle East and Africa
- 5.1. Market Analysis, Insights and Forecast - by Deployment Mode
- 6. North America VCS Industry Analysis, Insights and Forecast, 2019-2031
- 6.1. Market Analysis, Insights and Forecast - by Deployment Mode
- 6.1.1. On-Premise
- 6.1.2. On-Cloud
- 6.2. Market Analysis, Insights and Forecast - by End-user Industry
- 6.2.1. IT and Telecom
- 6.2.2. Retail & E-commerce
- 6.2.3. Healthcare and Life Sciences
- 6.2.4. BFSI
- 6.2.5. Other
- 6.3. Market Analysis, Insights and Forecast - by Type
- 6.3.1. Distributed VCS
- 6.3.2. Centralized VCS
- 6.1. Market Analysis, Insights and Forecast - by Deployment Mode
- 7. Europe VCS Industry Analysis, Insights and Forecast, 2019-2031
- 7.1. Market Analysis, Insights and Forecast - by Deployment Mode
- 7.1.1. On-Premise
- 7.1.2. On-Cloud
- 7.2. Market Analysis, Insights and Forecast - by End-user Industry
- 7.2.1. IT and Telecom
- 7.2.2. Retail & E-commerce
- 7.2.3. Healthcare and Life Sciences
- 7.2.4. BFSI
- 7.2.5. Other
- 7.3. Market Analysis, Insights and Forecast - by Type
- 7.3.1. Distributed VCS
- 7.3.2. Centralized VCS
- 7.1. Market Analysis, Insights and Forecast - by Deployment Mode
- 8. Asia Pacific VCS Industry Analysis, Insights and Forecast, 2019-2031
- 8.1. Market Analysis, Insights and Forecast - by Deployment Mode
- 8.1.1. On-Premise
- 8.1.2. On-Cloud
- 8.2. Market Analysis, Insights and Forecast - by End-user Industry
- 8.2.1. IT and Telecom
- 8.2.2. Retail & E-commerce
- 8.2.3. Healthcare and Life Sciences
- 8.2.4. BFSI
- 8.2.5. Other
- 8.3. Market Analysis, Insights and Forecast - by Type
- 8.3.1. Distributed VCS
- 8.3.2. Centralized VCS
- 8.1. Market Analysis, Insights and Forecast - by Deployment Mode
- 9. Latin America VCS Industry Analysis, Insights and Forecast, 2019-2031
- 9.1. Market Analysis, Insights and Forecast - by Deployment Mode
- 9.1.1. On-Premise
- 9.1.2. On-Cloud
- 9.2. Market Analysis, Insights and Forecast - by End-user Industry
- 9.2.1. IT and Telecom
- 9.2.2. Retail & E-commerce
- 9.2.3. Healthcare and Life Sciences
- 9.2.4. BFSI
- 9.2.5. Other
- 9.3. Market Analysis, Insights and Forecast - by Type
- 9.3.1. Distributed VCS
- 9.3.2. Centralized VCS
- 9.1. Market Analysis, Insights and Forecast - by Deployment Mode
- 10. Middle East and Africa VCS Industry Analysis, Insights and Forecast, 2019-2031
- 10.1. Market Analysis, Insights and Forecast - by Deployment Mode
- 10.1.1. On-Premise
- 10.1.2. On-Cloud
- 10.2. Market Analysis, Insights and Forecast - by End-user Industry
- 10.2.1. IT and Telecom
- 10.2.2. Retail & E-commerce
- 10.2.3. Healthcare and Life Sciences
- 10.2.4. BFSI
- 10.2.5. Other
- 10.3. Market Analysis, Insights and Forecast - by Type
- 10.3.1. Distributed VCS
- 10.3.2. Centralized VCS
- 10.1. Market Analysis, Insights and Forecast - by Deployment Mode
- 11. North America VCS Industry Analysis, Insights and Forecast, 2019-2031
- 11.1. Market Analysis, Insights and Forecast - By Country/Sub-region
- 11.1.1 United States
- 11.1.2 Canada
- 11.1.3 Mexico
- 12. Europe VCS Industry Analysis, Insights and Forecast, 2019-2031
- 12.1. Market Analysis, Insights and Forecast - By Country/Sub-region
- 12.1.1 Germany
- 12.1.2 United Kingdom
- 12.1.3 France
- 12.1.4 Spain
- 12.1.5 Italy
- 12.1.6 Spain
- 12.1.7 Belgium
- 12.1.8 Netherland
- 12.1.9 Nordics
- 12.1.10 Rest of Europe
- 13. Asia Pacific VCS Industry Analysis, Insights and Forecast, 2019-2031
- 13.1. Market Analysis, Insights and Forecast - By Country/Sub-region
- 13.1.1 China
- 13.1.2 Japan
- 13.1.3 India
- 13.1.4 South Korea
- 13.1.5 Southeast Asia
- 13.1.6 Australia
- 13.1.7 Indonesia
- 13.1.8 Phillipes
- 13.1.9 Singapore
- 13.1.10 Thailandc
- 13.1.11 Rest of Asia Pacific
- 14. South America VCS Industry Analysis, Insights and Forecast, 2019-2031
- 14.1. Market Analysis, Insights and Forecast - By Country/Sub-region
- 14.1.1 Brazil
- 14.1.2 Argentina
- 14.1.3 Peru
- 14.1.4 Chile
- 14.1.5 Colombia
- 14.1.6 Ecuador
- 14.1.7 Venezuela
- 14.1.8 Rest of South America
- 15. North America VCS Industry Analysis, Insights and Forecast, 2019-2031
- 15.1. Market Analysis, Insights and Forecast - By Country/Sub-region
- 15.1.1 United States
- 15.1.2 Canada
- 15.1.3 Mexico
- 16. MEA VCS Industry Analysis, Insights and Forecast, 2019-2031
- 16.1. Market Analysis, Insights and Forecast - By Country/Sub-region
- 16.1.1 United Arab Emirates
- 16.1.2 Saudi Arabia
- 16.1.3 South Africa
- 16.1.4 Rest of Middle East and Africa
- 17. Competitive Analysis
- 17.1. Global Market Share Analysis 2024
- 17.2. Company Profiles
- 17.2.1 Gitlab Inc
- 17.2.1.1. Overview
- 17.2.1.2. Products
- 17.2.1.3. SWOT Analysis
- 17.2.1.4. Recent Developments
- 17.2.1.5. Financials (Based on Availability)
- 17.2.2 CollabNet Inc
- 17.2.2.1. Overview
- 17.2.2.2. Products
- 17.2.2.3. SWOT Analysis
- 17.2.2.4. Recent Developments
- 17.2.2.5. Financials (Based on Availability)
- 17.2.3 Perforce Software Inc
- 17.2.3.1. Overview
- 17.2.3.2. Products
- 17.2.3.3. SWOT Analysis
- 17.2.3.4. Recent Developments
- 17.2.3.5. Financials (Based on Availability)
- 17.2.4 Beanstalk (Wildbit LLC)
- 17.2.4.1. Overview
- 17.2.4.2. Products
- 17.2.4.3. SWOT Analysis
- 17.2.4.4. Recent Developments
- 17.2.4.5. Financials (Based on Availability)
- 17.2.5 Microsoft Corporation
- 17.2.5.1. Overview
- 17.2.5.2. Products
- 17.2.5.3. SWOT Analysis
- 17.2.5.4. Recent Developments
- 17.2.5.5. Financials (Based on Availability)
- 17.2.6 Bitbucket org (Atlassian Corporation Plc)
- 17.2.6.1. Overview
- 17.2.6.2. Products
- 17.2.6.3. SWOT Analysis
- 17.2.6.4. Recent Developments
- 17.2.6.5. Financials (Based on Availability)
- 17.2.7 Amazon Web Services Inc
- 17.2.7.1. Overview
- 17.2.7.2. Products
- 17.2.7.3. SWOT Analysis
- 17.2.7.4. Recent Developments
- 17.2.7.5. Financials (Based on Availability)
- 17.2.8 APAChe Software Foundation
- 17.2.8.1. Overview
- 17.2.8.2. Products
- 17.2.8.3. SWOT Analysis
- 17.2.8.4. Recent Developments
- 17.2.8.5. Financials (Based on Availability)
- 17.2.9 Github Inc
- 17.2.9.1. Overview
- 17.2.9.2. Products
- 17.2.9.3. SWOT Analysis
- 17.2.9.4. Recent Developments
- 17.2.9.5. Financials (Based on Availability)
- 17.2.10 Dynamsoft Corporatio
- 17.2.10.1. Overview
- 17.2.10.2. Products
- 17.2.10.3. SWOT Analysis
- 17.2.10.4. Recent Developments
- 17.2.10.5. Financials (Based on Availability)
- 17.2.1 Gitlab Inc
List of Figures
- Figure 1: Global VCS Industry Revenue Breakdown (Million, %) by Region 2024 & 2032
- Figure 2: North America VCS Industry Revenue (Million), by Country 2024 & 2032
- Figure 3: North America VCS Industry Revenue Share (%), by Country 2024 & 2032
- Figure 4: Europe VCS Industry Revenue (Million), by Country 2024 & 2032
- Figure 5: Europe VCS Industry Revenue Share (%), by Country 2024 & 2032
- Figure 6: Asia Pacific VCS Industry Revenue (Million), by Country 2024 & 2032
- Figure 7: Asia Pacific VCS Industry Revenue Share (%), by Country 2024 & 2032
- Figure 8: South America VCS Industry Revenue (Million), by Country 2024 & 2032
- Figure 9: South America VCS Industry Revenue Share (%), by Country 2024 & 2032
- Figure 10: North America VCS Industry Revenue (Million), by Country 2024 & 2032
- Figure 11: North America VCS Industry Revenue Share (%), by Country 2024 & 2032
- Figure 12: MEA VCS Industry Revenue (Million), by Country 2024 & 2032
- Figure 13: MEA VCS Industry Revenue Share (%), by Country 2024 & 2032
- Figure 14: North America VCS Industry Revenue (Million), by Deployment Mode 2024 & 2032
- Figure 15: North America VCS Industry Revenue Share (%), by Deployment Mode 2024 & 2032
- Figure 16: North America VCS Industry Revenue (Million), by End-user Industry 2024 & 2032
- Figure 17: North America VCS Industry Revenue Share (%), by End-user Industry 2024 & 2032
- Figure 18: North America VCS Industry Revenue (Million), by Type 2024 & 2032
- Figure 19: North America VCS Industry Revenue Share (%), by Type 2024 & 2032
- Figure 20: North America VCS Industry Revenue (Million), by Country 2024 & 2032
- Figure 21: North America VCS Industry Revenue Share (%), by Country 2024 & 2032
- Figure 22: Europe VCS Industry Revenue (Million), by Deployment Mode 2024 & 2032
- Figure 23: Europe VCS Industry Revenue Share (%), by Deployment Mode 2024 & 2032
- Figure 24: Europe VCS Industry Revenue (Million), by End-user Industry 2024 & 2032
- Figure 25: Europe VCS Industry Revenue Share (%), by End-user Industry 2024 & 2032
- Figure 26: Europe VCS Industry Revenue (Million), by Type 2024 & 2032
- Figure 27: Europe VCS Industry Revenue Share (%), by Type 2024 & 2032
- Figure 28: Europe VCS Industry Revenue (Million), by Country 2024 & 2032
- Figure 29: Europe VCS Industry Revenue Share (%), by Country 2024 & 2032
- Figure 30: Asia Pacific VCS Industry Revenue (Million), by Deployment Mode 2024 & 2032
- Figure 31: Asia Pacific VCS Industry Revenue Share (%), by Deployment Mode 2024 & 2032
- Figure 32: Asia Pacific VCS Industry Revenue (Million), by End-user Industry 2024 & 2032
- Figure 33: Asia Pacific VCS Industry Revenue Share (%), by End-user Industry 2024 & 2032
- Figure 34: Asia Pacific VCS Industry Revenue (Million), by Type 2024 & 2032
- Figure 35: Asia Pacific VCS Industry Revenue Share (%), by Type 2024 & 2032
- Figure 36: Asia Pacific VCS Industry Revenue (Million), by Country 2024 & 2032
- Figure 37: Asia Pacific VCS Industry Revenue Share (%), by Country 2024 & 2032
- Figure 38: Latin America VCS Industry Revenue (Million), by Deployment Mode 2024 & 2032
- Figure 39: Latin America VCS Industry Revenue Share (%), by Deployment Mode 2024 & 2032
- Figure 40: Latin America VCS Industry Revenue (Million), by End-user Industry 2024 & 2032
- Figure 41: Latin America VCS Industry Revenue Share (%), by End-user Industry 2024 & 2032
- Figure 42: Latin America VCS Industry Revenue (Million), by Type 2024 & 2032
- Figure 43: Latin America VCS Industry Revenue Share (%), by Type 2024 & 2032
- Figure 44: Latin America VCS Industry Revenue (Million), by Country 2024 & 2032
- Figure 45: Latin America VCS Industry Revenue Share (%), by Country 2024 & 2032
- Figure 46: Middle East and Africa VCS Industry Revenue (Million), by Deployment Mode 2024 & 2032
- Figure 47: Middle East and Africa VCS Industry Revenue Share (%), by Deployment Mode 2024 & 2032
- Figure 48: Middle East and Africa VCS Industry Revenue (Million), by End-user Industry 2024 & 2032
- Figure 49: Middle East and Africa VCS Industry Revenue Share (%), by End-user Industry 2024 & 2032
- Figure 50: Middle East and Africa VCS Industry Revenue (Million), by Type 2024 & 2032
- Figure 51: Middle East and Africa VCS Industry Revenue Share (%), by Type 2024 & 2032
- Figure 52: Middle East and Africa VCS Industry Revenue (Million), by Country 2024 & 2032
- Figure 53: Middle East and Africa VCS Industry Revenue Share (%), by Country 2024 & 2032
List of Tables
- Table 1: Global VCS Industry Revenue Million Forecast, by Region 2019 & 2032
- Table 2: Global VCS Industry Revenue Million Forecast, by Deployment Mode 2019 & 2032
- Table 3: Global VCS Industry Revenue Million Forecast, by End-user Industry 2019 & 2032
- Table 4: Global VCS Industry Revenue Million Forecast, by Type 2019 & 2032
- Table 5: Global VCS Industry Revenue Million Forecast, by Region 2019 & 2032
- Table 6: Global VCS Industry Revenue Million Forecast, by Country 2019 & 2032
- Table 7: United States VCS Industry Revenue (Million) Forecast, by Application 2019 & 2032
- Table 8: Canada VCS Industry Revenue (Million) Forecast, by Application 2019 & 2032
- Table 9: Mexico VCS Industry Revenue (Million) Forecast, by Application 2019 & 2032
- Table 10: Global VCS Industry Revenue Million Forecast, by Country 2019 & 2032
- Table 11: Germany VCS Industry Revenue (Million) Forecast, by Application 2019 & 2032
- Table 12: United Kingdom VCS Industry Revenue (Million) Forecast, by Application 2019 & 2032
- Table 13: France VCS Industry Revenue (Million) Forecast, by Application 2019 & 2032
- Table 14: Spain VCS Industry Revenue (Million) Forecast, by Application 2019 & 2032
- Table 15: Italy VCS Industry Revenue (Million) Forecast, by Application 2019 & 2032
- Table 16: Spain VCS Industry Revenue (Million) Forecast, by Application 2019 & 2032
- Table 17: Belgium VCS Industry Revenue (Million) Forecast, by Application 2019 & 2032
- Table 18: Netherland VCS Industry Revenue (Million) Forecast, by Application 2019 & 2032
- Table 19: Nordics VCS Industry Revenue (Million) Forecast, by Application 2019 & 2032
- Table 20: Rest of Europe VCS Industry Revenue (Million) Forecast, by Application 2019 & 2032
- Table 21: Global VCS Industry Revenue Million Forecast, by Country 2019 & 2032
- Table 22: China VCS Industry Revenue (Million) Forecast, by Application 2019 & 2032
- Table 23: Japan VCS Industry Revenue (Million) Forecast, by Application 2019 & 2032
- Table 24: India VCS Industry Revenue (Million) Forecast, by Application 2019 & 2032
- Table 25: South Korea VCS Industry Revenue (Million) Forecast, by Application 2019 & 2032
- Table 26: Southeast Asia VCS Industry Revenue (Million) Forecast, by Application 2019 & 2032
- Table 27: Australia VCS Industry Revenue (Million) Forecast, by Application 2019 & 2032
- Table 28: Indonesia VCS Industry Revenue (Million) Forecast, by Application 2019 & 2032
- Table 29: Phillipes VCS Industry Revenue (Million) Forecast, by Application 2019 & 2032
- Table 30: Singapore VCS Industry Revenue (Million) Forecast, by Application 2019 & 2032
- Table 31: Thailandc VCS Industry Revenue (Million) Forecast, by Application 2019 & 2032
- Table 32: Rest of Asia Pacific VCS Industry Revenue (Million) Forecast, by Application 2019 & 2032
- Table 33: Global VCS Industry Revenue Million Forecast, by Country 2019 & 2032
- Table 34: Brazil VCS Industry Revenue (Million) Forecast, by Application 2019 & 2032
- Table 35: Argentina VCS Industry Revenue (Million) Forecast, by Application 2019 & 2032
- Table 36: Peru VCS Industry Revenue (Million) Forecast, by Application 2019 & 2032
- Table 37: Chile VCS Industry Revenue (Million) Forecast, by Application 2019 & 2032
- Table 38: Colombia VCS Industry Revenue (Million) Forecast, by Application 2019 & 2032
- Table 39: Ecuador VCS Industry Revenue (Million) Forecast, by Application 2019 & 2032
- Table 40: Venezuela VCS Industry Revenue (Million) Forecast, by Application 2019 & 2032
- Table 41: Rest of South America VCS Industry Revenue (Million) Forecast, by Application 2019 & 2032
- Table 42: Global VCS Industry Revenue Million Forecast, by Country 2019 & 2032
- Table 43: United States VCS Industry Revenue (Million) Forecast, by Application 2019 & 2032
- Table 44: Canada VCS Industry Revenue (Million) Forecast, by Application 2019 & 2032
- Table 45: Mexico VCS Industry Revenue (Million) Forecast, by Application 2019 & 2032
- Table 46: Global VCS Industry Revenue Million Forecast, by Country 2019 & 2032
- Table 47: United Arab Emirates VCS Industry Revenue (Million) Forecast, by Application 2019 & 2032
- Table 48: Saudi Arabia VCS Industry Revenue (Million) Forecast, by Application 2019 & 2032
- Table 49: South Africa VCS Industry Revenue (Million) Forecast, by Application 2019 & 2032
- Table 50: Rest of Middle East and Africa VCS Industry Revenue (Million) Forecast, by Application 2019 & 2032
- Table 51: Global VCS Industry Revenue Million Forecast, by Deployment Mode 2019 & 2032
- Table 52: Global VCS Industry Revenue Million Forecast, by End-user Industry 2019 & 2032
- Table 53: Global VCS Industry Revenue Million Forecast, by Type 2019 & 2032
- Table 54: Global VCS Industry Revenue Million Forecast, by Country 2019 & 2032
- Table 55: Global VCS Industry Revenue Million Forecast, by Deployment Mode 2019 & 2032
- Table 56: Global VCS Industry Revenue Million Forecast, by End-user Industry 2019 & 2032
- Table 57: Global VCS Industry Revenue Million Forecast, by Type 2019 & 2032
- Table 58: Global VCS Industry Revenue Million Forecast, by Country 2019 & 2032
- Table 59: Global VCS Industry Revenue Million Forecast, by Deployment Mode 2019 & 2032
- Table 60: Global VCS Industry Revenue Million Forecast, by End-user Industry 2019 & 2032
- Table 61: Global VCS Industry Revenue Million Forecast, by Type 2019 & 2032
- Table 62: Global VCS Industry Revenue Million Forecast, by Country 2019 & 2032
- Table 63: Global VCS Industry Revenue Million Forecast, by Deployment Mode 2019 & 2032
- Table 64: Global VCS Industry Revenue Million Forecast, by End-user Industry 2019 & 2032
- Table 65: Global VCS Industry Revenue Million Forecast, by Type 2019 & 2032
- Table 66: Global VCS Industry Revenue Million Forecast, by Country 2019 & 2032
- Table 67: Global VCS Industry Revenue Million Forecast, by Deployment Mode 2019 & 2032
- Table 68: Global VCS Industry Revenue Million Forecast, by End-user Industry 2019 & 2032
- Table 69: Global VCS Industry Revenue Million Forecast, by Type 2019 & 2032
- Table 70: Global VCS Industry Revenue Million Forecast, by Country 2019 & 2032
Frequently Asked Questions
1. What is the projected Compound Annual Growth Rate (CAGR) of the VCS Industry?
The projected CAGR is approximately 16.63%.
2. Which companies are prominent players in the VCS Industry?
Key companies in the market include Gitlab Inc, CollabNet Inc, Perforce Software Inc, Beanstalk (Wildbit LLC), Microsoft Corporation, Bitbucket org (Atlassian Corporation Plc), Amazon Web Services Inc, APAChe Software Foundation, Github Inc, Dynamsoft Corporatio.
3. What are the main segments of the VCS Industry?
The market segments include Deployment Mode, End-user Industry, Type.
4. Can you provide details about the market size?
The market size is estimated to be USD 1.11 Million as of 2022.
5. What are some drivers contributing to market growth?
Digitization of Business Processes Leading to Adoption of Software; Increasing Demand for Reduced Complexities in Software Development and Cost Optimization.
6. What are the notable trends driving market growth?
BFSI Industry Expected to Hold Significant Share.
7. Are there any restraints impacting market growth?
Use of Diversified Software Applications in Organizations; Growing Complexity Due to Massive Data Generation.
8. Can you provide examples of recent developments in the market?
September 2023 - Accenture and Workday have expanded their partnership to assist organizations in reinventing their finance functions to be more agile, data-driven, and customer-centric. The companies are collaborating to develop a suite of data-led, composable finance solutions that can be configured and reconfigured to help clients in the software and technology, retail, and media industries be more responsive to changing business requirements.
9. What pricing options are available for accessing the report?
Pricing options include single-user, multi-user, and enterprise licenses priced at USD 4750, USD 5250, and USD 8750 respectively.
10. Is the market size provided in terms of value or volume?
The market size is provided in terms of value, measured in Million.
11. Are there any specific market keywords associated with the report?
Yes, the market keyword associated with the report is "VCS Industry," which aids in identifying and referencing the specific market segment covered.
12. How do I determine which pricing option suits my needs best?
The pricing options vary based on user requirements and access needs. Individual users may opt for single-user licenses, while businesses requiring broader access may choose multi-user or enterprise licenses for cost-effective access to the report.
13. Are there any additional resources or data provided in the VCS Industry report?
While the report offers comprehensive insights, it's advisable to review the specific contents or supplementary materials provided to ascertain if additional resources or data are available.
14. How can I stay updated on further developments or reports in the VCS Industry?
To stay informed about further developments, trends, and reports in the VCS Industry, consider subscribing to industry newsletters, following relevant companies and organizations, or regularly checking reputable industry news sources and publications.
Methodology
Step 1 - Identification of Relevant Samples Size from Population Database


Step 2 - Approaches for Defining Global Market Size (Value, Volume* & Price*)

Note*: In applicable scenarios
Step 3 - Data Sources
Primary Research
- Web Analytics
- Survey Reports
- Research Institute
- Latest Research Reports
- Opinion Leaders
Secondary Research
- Annual Reports
- White Paper
- Latest Press Release
- Industry Association
- Paid Database
- Investor Presentations

Step 4 - Data Triangulation
Involves using different sources of information in order to increase the validity of a study
These sources are likely to be stakeholders in a program - participants, other researchers, program staff, other community members, and so on.
Then we put all data in single framework & apply various statistical tools to find out the dynamic on the market.
During the analysis stage, feedback from the stakeholder groups would be compared to determine areas of agreement as well as areas of divergence


