
Key Insights
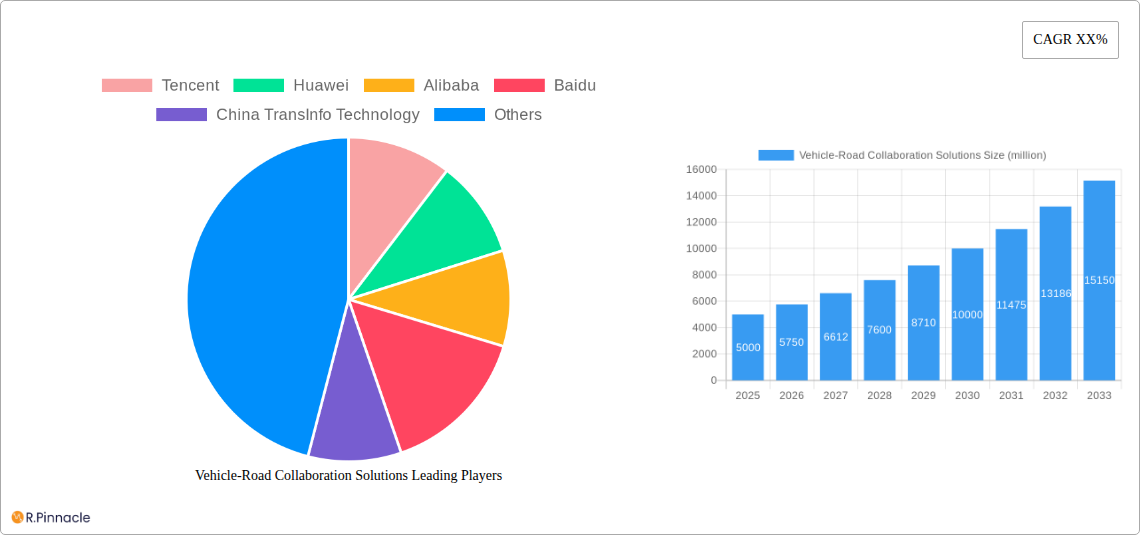
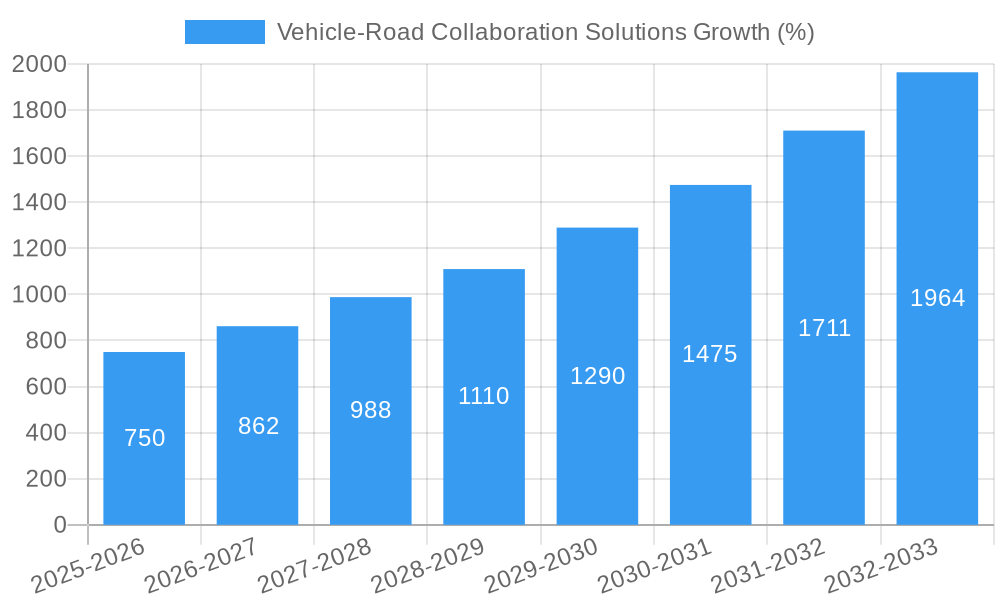
The Vehicle-Road Collaboration (VRC) solutions market is experiencing robust growth, driven by increasing urbanization, the demand for enhanced road safety, and the proliferation of connected and autonomous vehicles. The market, currently valued at approximately $5 billion in 2025, is projected to achieve a Compound Annual Growth Rate (CAGR) of 15% from 2025 to 2033, reaching an estimated market size of $15 billion by 2033. Key drivers include government initiatives promoting smart city infrastructure, the development of advanced driver-assistance systems (ADAS), and the increasing adoption of 5G technology, which enables real-time data exchange between vehicles and road infrastructure. Leading technology companies like Tencent, Huawei, and Alibaba are significantly investing in developing VRC solutions, fostering competition and innovation within the market. Furthermore, the integration of artificial intelligence (AI) and machine learning (ML) is enhancing the capabilities of VRC systems, enabling predictive maintenance and improved traffic management. While data privacy and security concerns pose some restraints, the overall market outlook remains positive, propelled by the convergence of technological advancements and the imperative for efficient and safe transportation systems.
Despite the positive outlook, market penetration faces challenges. The high initial investment costs associated with deploying VRC infrastructure can hinder adoption, particularly in developing regions. Standardization of communication protocols and data formats remains a crucial factor for seamless interoperability between different VRC systems. Furthermore, overcoming public skepticism and addressing potential concerns regarding data security are essential for successful market expansion. However, the long-term benefits in terms of reduced traffic congestion, improved road safety, and enhanced efficiency are expected to outweigh these initial hurdles. The continued collaboration between governments, technology providers, and automotive manufacturers is key to accelerating market growth and realizing the full potential of VRC solutions.
This comprehensive report provides an in-depth analysis of the Vehicle-Road Collaboration (VRC) Solutions market, projecting a robust growth trajectory driven by technological advancements and increasing government investments in smart infrastructure. The study period spans 2019-2033, with 2025 serving as the base and estimated year. The forecast period covers 2025-2033, while the historical period encompasses 2019-2024. This report is invaluable for industry professionals, investors, and strategists seeking to navigate this rapidly evolving landscape. The market is valued at $xx million in 2025 and is projected to reach $xx million by 2033, exhibiting a CAGR of xx%.
Vehicle-Road Collaboration Solutions Market Structure & Innovation Trends
The VRC Solutions market is characterized by a moderate level of concentration, with key players like Tencent, Huawei, Alibaba, and Baidu holding significant market share, estimated at a combined xx% in 2025. Innovation is driven by the convergence of several technologies, including 5G, AI, and IoT. Regulatory frameworks, particularly those focused on autonomous driving and safety standards, are significantly shaping market development. Product substitutes are limited, primarily focusing on alternative traffic management systems. The end-user demographics comprise government agencies, automotive manufacturers, and infrastructure providers. M&A activity in the sector has been significant, with a total deal value of approximately $xx million recorded between 2019 and 2024. Examples include the acquisition of xx by xx for $xx million and several strategic partnerships forming between leading tech companies and automotive players.
- Market Concentration: Moderate, with top 5 players holding xx% market share (2025).
- Innovation Drivers: 5G, AI, IoT, autonomous driving technologies.
- Regulatory Frameworks: Increasingly stringent standards for safety and data privacy.
- M&A Activity: Total deal value of approximately $xx million (2019-2024).
Vehicle-Road Collaboration Solutions Market Dynamics & Trends
The VRC Solutions market is experiencing rapid growth fueled by the increasing demand for improved traffic management, enhanced road safety, and the proliferation of connected and autonomous vehicles. Technological disruptions, particularly in areas like sensor technology, communication protocols, and data analytics, are transforming the market landscape. Consumer preferences for enhanced safety and convenience are driving adoption rates. Intense competitive dynamics are evident, with established players vying for market share against emerging startups. The market's CAGR is expected to remain strong throughout the forecast period, driven by substantial investments in smart city initiatives globally and the rising adoption of V2X communication. Market penetration is expected to reach xx% by 2033, showcasing significant market growth and an increasing acceptance of VRC solutions by stakeholders.
Dominant Regions & Segments in Vehicle-Road Collaboration Solutions
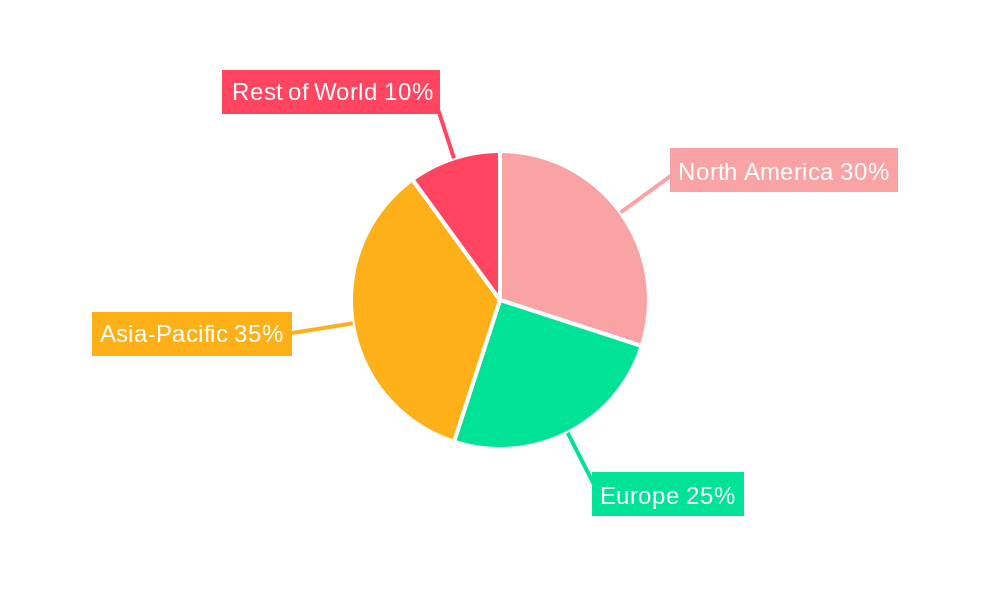
North America currently holds the leading position in the VRC Solutions market, driven by robust investments in infrastructure modernization and a higher adoption rate of advanced technologies. This dominance is further fueled by supportive government policies and a well-developed technological ecosystem.
Key Drivers in North America:
- Substantial investments in smart city infrastructure.
- High adoption rate of advanced technologies.
- Supportive government policies and regulations.
- Well-established technological ecosystem.
Dominance Analysis: The region's well-established technological infrastructure and the presence of major automotive manufacturers contribute significantly to its leading position. Furthermore, increasing government support for smart city initiatives further amplifies market growth in the region. However, strong competition is expected from the Asia-Pacific region, driven by significant governmental investments in smart city development.
Vehicle-Road Collaboration Solutions Product Innovations
Recent product innovations focus on improving the accuracy and reliability of sensor data, enhancing communication protocols for V2X communication, and developing advanced data analytics capabilities to optimize traffic flow and improve road safety. The market is seeing advancements in AI-powered traffic management systems, predictive maintenance solutions for road infrastructure, and integrated platforms combining various VRC functionalities. These innovations are aimed at creating seamless and efficient transportation systems, addressing the growing challenges of urban mobility, and improving the overall driving experience.
Report Scope & Segmentation Analysis
This report segments the VRC Solutions market based on component (hardware, software, services), technology (5G, Wi-Fi, etc.), application (traffic management, safety, parking), deployment (urban, rural), and region. Each segment exhibits distinct growth trajectories and competitive dynamics. The hardware segment is currently the largest, but the software and service segments are expected to experience the fastest growth over the forecast period. Regional variations in market size and growth are significant, with North America and Asia-Pacific representing the most prominent markets.
Key Drivers of Vehicle-Road Collaboration Solutions Growth
The VRC Solutions market growth is driven by several factors, including:
- Technological Advancements: The rapid development of 5G, AI, and IoT technologies enables the deployment of more efficient and reliable VRC systems.
- Government Initiatives: Increasing government investments in smart city projects and infrastructure modernization are fueling market expansion.
- Enhanced Road Safety: The integration of VRC systems significantly improves road safety, leading to increased adoption.
- Improved Traffic Efficiency: VRC solutions optimize traffic flow and reduce congestion, resulting in economic benefits.
Challenges in the Vehicle-Road Collaboration Solutions Sector
The VRC Solutions sector faces several challenges:
- High Initial Investment Costs: The deployment of VRC infrastructure requires significant upfront investments.
- Data Security and Privacy Concerns: The collection and sharing of large amounts of data raise concerns about data security and privacy.
- Standardization Issues: The lack of standardized communication protocols can hinder interoperability between different systems.
- Cybersecurity Threats: The increasing reliance on connected systems increases the vulnerability to cyberattacks.
Emerging Opportunities in Vehicle-Road Collaboration Solutions
Emerging opportunities include:
- Expansion into New Markets: Significant growth potential exists in developing economies with rapidly growing urban populations.
- Integration with Autonomous Driving: VRC systems are critical for the safe and efficient operation of autonomous vehicles.
- Development of Advanced Analytics: Data analytics capabilities can be further enhanced to provide deeper insights into traffic patterns and road conditions.
- Focus on Sustainability: VRC solutions can contribute to creating more sustainable transportation systems.
Leading Players in the Vehicle-Road Collaboration Solutions Market
- Tencent
- Huawei
- Alibaba
- Baidu
- China TransInfo Technology
- Wanji Technology
- EMQ
- Enel Energia
- The Mobility House
- Hitachi
- Nexteer
- SWARCO
Key Developments in Vehicle-Road Collaboration Solutions Industry
- 2022-Q4: Tencent launches a new AI-powered traffic management system.
- 2023-Q1: Huawei partners with a major automotive manufacturer to integrate V2X technology into new vehicle models.
- 2023-Q3: Alibaba invests in a startup developing advanced sensor technology for VRC applications.
- 2024-Q2: A significant merger occurs between two leading VRC solution providers. (Specific details unavailable, use xx for value).
Future Outlook for Vehicle-Road Collaboration Solutions Market
The VRC Solutions market is poised for continued strong growth, driven by increasing government support, technological advancements, and the growing demand for smarter, safer, and more efficient transportation systems. Strategic partnerships and collaborations between technology companies and automotive manufacturers will continue to shape market dynamics. The adoption of autonomous vehicles and the further development of smart city initiatives will significantly contribute to market expansion in the coming years. Opportunities exist for companies to capitalize on emerging technologies and address the challenges associated with data security and interoperability to capture a significant share of this rapidly expanding market.
Vehicle-Road Collaboration Solutions Segmentation
-
1. Application
- 1.1. Urban Roads
- 1.2. Highways
-
2. Types
- 2.1. Equipment
- 2.2. Service
Vehicle-Road Collaboration Solutions Segmentation By Geography
-
1. North America
- 1.1. United States
- 1.2. Canada
- 1.3. Mexico
-
2. South America
- 2.1. Brazil
- 2.2. Argentina
- 2.3. Rest of South America
-
3. Europe
- 3.1. United Kingdom
- 3.2. Germany
- 3.3. France
- 3.4. Italy
- 3.5. Spain
- 3.6. Russia
- 3.7. Benelux
- 3.8. Nordics
- 3.9. Rest of Europe
-
4. Middle East & Africa
- 4.1. Turkey
- 4.2. Israel
- 4.3. GCC
- 4.4. North Africa
- 4.5. South Africa
- 4.6. Rest of Middle East & Africa
-
5. Asia Pacific
- 5.1. China
- 5.2. India
- 5.3. Japan
- 5.4. South Korea
- 5.5. ASEAN
- 5.6. Oceania
- 5.7. Rest of Asia Pacific
Vehicle-Road Collaboration Solutions REPORT HIGHLIGHTS
| Aspects | Details |
|---|---|
| Study Period | 2019-2033 |
| Base Year | 2024 |
| Estimated Year | 2025 |
| Forecast Period | 2025-2033 |
| Historical Period | 2019-2024 |
| Growth Rate | CAGR of XX% from 2019-2033 |
| Segmentation |
|
Table of Contents
- 1. Introduction
- 1.1. Research Scope
- 1.2. Market Segmentation
- 1.3. Research Methodology
- 1.4. Definitions and Assumptions
- 2. Executive Summary
- 2.1. Introduction
- 3. Market Dynamics
- 3.1. Introduction
- 3.2. Market Drivers
- 3.3. Market Restrains
- 3.4. Market Trends
- 4. Market Factor Analysis
- 4.1. Porters Five Forces
- 4.2. Supply/Value Chain
- 4.3. PESTEL analysis
- 4.4. Market Entropy
- 4.5. Patent/Trademark Analysis
- 5. Global Vehicle-Road Collaboration Solutions Analysis, Insights and Forecast, 2019-2031
- 5.1. Market Analysis, Insights and Forecast - by Application
- 5.1.1. Urban Roads
- 5.1.2. Highways
- 5.2. Market Analysis, Insights and Forecast - by Types
- 5.2.1. Equipment
- 5.2.2. Service
- 5.3. Market Analysis, Insights and Forecast - by Region
- 5.3.1. North America
- 5.3.2. South America
- 5.3.3. Europe
- 5.3.4. Middle East & Africa
- 5.3.5. Asia Pacific
- 5.1. Market Analysis, Insights and Forecast - by Application
- 6. North America Vehicle-Road Collaboration Solutions Analysis, Insights and Forecast, 2019-2031
- 6.1. Market Analysis, Insights and Forecast - by Application
- 6.1.1. Urban Roads
- 6.1.2. Highways
- 6.2. Market Analysis, Insights and Forecast - by Types
- 6.2.1. Equipment
- 6.2.2. Service
- 6.1. Market Analysis, Insights and Forecast - by Application
- 7. South America Vehicle-Road Collaboration Solutions Analysis, Insights and Forecast, 2019-2031
- 7.1. Market Analysis, Insights and Forecast - by Application
- 7.1.1. Urban Roads
- 7.1.2. Highways
- 7.2. Market Analysis, Insights and Forecast - by Types
- 7.2.1. Equipment
- 7.2.2. Service
- 7.1. Market Analysis, Insights and Forecast - by Application
- 8. Europe Vehicle-Road Collaboration Solutions Analysis, Insights and Forecast, 2019-2031
- 8.1. Market Analysis, Insights and Forecast - by Application
- 8.1.1. Urban Roads
- 8.1.2. Highways
- 8.2. Market Analysis, Insights and Forecast - by Types
- 8.2.1. Equipment
- 8.2.2. Service
- 8.1. Market Analysis, Insights and Forecast - by Application
- 9. Middle East & Africa Vehicle-Road Collaboration Solutions Analysis, Insights and Forecast, 2019-2031
- 9.1. Market Analysis, Insights and Forecast - by Application
- 9.1.1. Urban Roads
- 9.1.2. Highways
- 9.2. Market Analysis, Insights and Forecast - by Types
- 9.2.1. Equipment
- 9.2.2. Service
- 9.1. Market Analysis, Insights and Forecast - by Application
- 10. Asia Pacific Vehicle-Road Collaboration Solutions Analysis, Insights and Forecast, 2019-2031
- 10.1. Market Analysis, Insights and Forecast - by Application
- 10.1.1. Urban Roads
- 10.1.2. Highways
- 10.2. Market Analysis, Insights and Forecast - by Types
- 10.2.1. Equipment
- 10.2.2. Service
- 10.1. Market Analysis, Insights and Forecast - by Application
- 11. Competitive Analysis
- 11.1. Global Market Share Analysis 2024
- 11.2. Company Profiles
- 11.2.1 Tencent
- 11.2.1.1. Overview
- 11.2.1.2. Products
- 11.2.1.3. SWOT Analysis
- 11.2.1.4. Recent Developments
- 11.2.1.5. Financials (Based on Availability)
- 11.2.2 Huawei
- 11.2.2.1. Overview
- 11.2.2.2. Products
- 11.2.2.3. SWOT Analysis
- 11.2.2.4. Recent Developments
- 11.2.2.5. Financials (Based on Availability)
- 11.2.3 Alibaba
- 11.2.3.1. Overview
- 11.2.3.2. Products
- 11.2.3.3. SWOT Analysis
- 11.2.3.4. Recent Developments
- 11.2.3.5. Financials (Based on Availability)
- 11.2.4 Baidu
- 11.2.4.1. Overview
- 11.2.4.2. Products
- 11.2.4.3. SWOT Analysis
- 11.2.4.4. Recent Developments
- 11.2.4.5. Financials (Based on Availability)
- 11.2.5 China TransInfo Technology
- 11.2.5.1. Overview
- 11.2.5.2. Products
- 11.2.5.3. SWOT Analysis
- 11.2.5.4. Recent Developments
- 11.2.5.5. Financials (Based on Availability)
- 11.2.6 Wanji Technology
- 11.2.6.1. Overview
- 11.2.6.2. Products
- 11.2.6.3. SWOT Analysis
- 11.2.6.4. Recent Developments
- 11.2.6.5. Financials (Based on Availability)
- 11.2.7 EMQ
- 11.2.7.1. Overview
- 11.2.7.2. Products
- 11.2.7.3. SWOT Analysis
- 11.2.7.4. Recent Developments
- 11.2.7.5. Financials (Based on Availability)
- 11.2.8 Enel Energia
- 11.2.8.1. Overview
- 11.2.8.2. Products
- 11.2.8.3. SWOT Analysis
- 11.2.8.4. Recent Developments
- 11.2.8.5. Financials (Based on Availability)
- 11.2.9 The Mobility House
- 11.2.9.1. Overview
- 11.2.9.2. Products
- 11.2.9.3. SWOT Analysis
- 11.2.9.4. Recent Developments
- 11.2.9.5. Financials (Based on Availability)
- 11.2.10 Hitachi
- 11.2.10.1. Overview
- 11.2.10.2. Products
- 11.2.10.3. SWOT Analysis
- 11.2.10.4. Recent Developments
- 11.2.10.5. Financials (Based on Availability)
- 11.2.11 Nexteer
- 11.2.11.1. Overview
- 11.2.11.2. Products
- 11.2.11.3. SWOT Analysis
- 11.2.11.4. Recent Developments
- 11.2.11.5. Financials (Based on Availability)
- 11.2.12 SWARCO
- 11.2.12.1. Overview
- 11.2.12.2. Products
- 11.2.12.3. SWOT Analysis
- 11.2.12.4. Recent Developments
- 11.2.12.5. Financials (Based on Availability)
- 11.2.1 Tencent
List of Figures
- Figure 1: Global Vehicle-Road Collaboration Solutions Revenue Breakdown (million, %) by Region 2024 & 2032
- Figure 2: North America Vehicle-Road Collaboration Solutions Revenue (million), by Application 2024 & 2032
- Figure 3: North America Vehicle-Road Collaboration Solutions Revenue Share (%), by Application 2024 & 2032
- Figure 4: North America Vehicle-Road Collaboration Solutions Revenue (million), by Types 2024 & 2032
- Figure 5: North America Vehicle-Road Collaboration Solutions Revenue Share (%), by Types 2024 & 2032
- Figure 6: North America Vehicle-Road Collaboration Solutions Revenue (million), by Country 2024 & 2032
- Figure 7: North America Vehicle-Road Collaboration Solutions Revenue Share (%), by Country 2024 & 2032
- Figure 8: South America Vehicle-Road Collaboration Solutions Revenue (million), by Application 2024 & 2032
- Figure 9: South America Vehicle-Road Collaboration Solutions Revenue Share (%), by Application 2024 & 2032
- Figure 10: South America Vehicle-Road Collaboration Solutions Revenue (million), by Types 2024 & 2032
- Figure 11: South America Vehicle-Road Collaboration Solutions Revenue Share (%), by Types 2024 & 2032
- Figure 12: South America Vehicle-Road Collaboration Solutions Revenue (million), by Country 2024 & 2032
- Figure 13: South America Vehicle-Road Collaboration Solutions Revenue Share (%), by Country 2024 & 2032
- Figure 14: Europe Vehicle-Road Collaboration Solutions Revenue (million), by Application 2024 & 2032
- Figure 15: Europe Vehicle-Road Collaboration Solutions Revenue Share (%), by Application 2024 & 2032
- Figure 16: Europe Vehicle-Road Collaboration Solutions Revenue (million), by Types 2024 & 2032
- Figure 17: Europe Vehicle-Road Collaboration Solutions Revenue Share (%), by Types 2024 & 2032
- Figure 18: Europe Vehicle-Road Collaboration Solutions Revenue (million), by Country 2024 & 2032
- Figure 19: Europe Vehicle-Road Collaboration Solutions Revenue Share (%), by Country 2024 & 2032
- Figure 20: Middle East & Africa Vehicle-Road Collaboration Solutions Revenue (million), by Application 2024 & 2032
- Figure 21: Middle East & Africa Vehicle-Road Collaboration Solutions Revenue Share (%), by Application 2024 & 2032
- Figure 22: Middle East & Africa Vehicle-Road Collaboration Solutions Revenue (million), by Types 2024 & 2032
- Figure 23: Middle East & Africa Vehicle-Road Collaboration Solutions Revenue Share (%), by Types 2024 & 2032
- Figure 24: Middle East & Africa Vehicle-Road Collaboration Solutions Revenue (million), by Country 2024 & 2032
- Figure 25: Middle East & Africa Vehicle-Road Collaboration Solutions Revenue Share (%), by Country 2024 & 2032
- Figure 26: Asia Pacific Vehicle-Road Collaboration Solutions Revenue (million), by Application 2024 & 2032
- Figure 27: Asia Pacific Vehicle-Road Collaboration Solutions Revenue Share (%), by Application 2024 & 2032
- Figure 28: Asia Pacific Vehicle-Road Collaboration Solutions Revenue (million), by Types 2024 & 2032
- Figure 29: Asia Pacific Vehicle-Road Collaboration Solutions Revenue Share (%), by Types 2024 & 2032
- Figure 30: Asia Pacific Vehicle-Road Collaboration Solutions Revenue (million), by Country 2024 & 2032
- Figure 31: Asia Pacific Vehicle-Road Collaboration Solutions Revenue Share (%), by Country 2024 & 2032
List of Tables
- Table 1: Global Vehicle-Road Collaboration Solutions Revenue million Forecast, by Region 2019 & 2032
- Table 2: Global Vehicle-Road Collaboration Solutions Revenue million Forecast, by Application 2019 & 2032
- Table 3: Global Vehicle-Road Collaboration Solutions Revenue million Forecast, by Types 2019 & 2032
- Table 4: Global Vehicle-Road Collaboration Solutions Revenue million Forecast, by Region 2019 & 2032
- Table 5: Global Vehicle-Road Collaboration Solutions Revenue million Forecast, by Application 2019 & 2032
- Table 6: Global Vehicle-Road Collaboration Solutions Revenue million Forecast, by Types 2019 & 2032
- Table 7: Global Vehicle-Road Collaboration Solutions Revenue million Forecast, by Country 2019 & 2032
- Table 8: United States Vehicle-Road Collaboration Solutions Revenue (million) Forecast, by Application 2019 & 2032
- Table 9: Canada Vehicle-Road Collaboration Solutions Revenue (million) Forecast, by Application 2019 & 2032
- Table 10: Mexico Vehicle-Road Collaboration Solutions Revenue (million) Forecast, by Application 2019 & 2032
- Table 11: Global Vehicle-Road Collaboration Solutions Revenue million Forecast, by Application 2019 & 2032
- Table 12: Global Vehicle-Road Collaboration Solutions Revenue million Forecast, by Types 2019 & 2032
- Table 13: Global Vehicle-Road Collaboration Solutions Revenue million Forecast, by Country 2019 & 2032
- Table 14: Brazil Vehicle-Road Collaboration Solutions Revenue (million) Forecast, by Application 2019 & 2032
- Table 15: Argentina Vehicle-Road Collaboration Solutions Revenue (million) Forecast, by Application 2019 & 2032
- Table 16: Rest of South America Vehicle-Road Collaboration Solutions Revenue (million) Forecast, by Application 2019 & 2032
- Table 17: Global Vehicle-Road Collaboration Solutions Revenue million Forecast, by Application 2019 & 2032
- Table 18: Global Vehicle-Road Collaboration Solutions Revenue million Forecast, by Types 2019 & 2032
- Table 19: Global Vehicle-Road Collaboration Solutions Revenue million Forecast, by Country 2019 & 2032
- Table 20: United Kingdom Vehicle-Road Collaboration Solutions Revenue (million) Forecast, by Application 2019 & 2032
- Table 21: Germany Vehicle-Road Collaboration Solutions Revenue (million) Forecast, by Application 2019 & 2032
- Table 22: France Vehicle-Road Collaboration Solutions Revenue (million) Forecast, by Application 2019 & 2032
- Table 23: Italy Vehicle-Road Collaboration Solutions Revenue (million) Forecast, by Application 2019 & 2032
- Table 24: Spain Vehicle-Road Collaboration Solutions Revenue (million) Forecast, by Application 2019 & 2032
- Table 25: Russia Vehicle-Road Collaboration Solutions Revenue (million) Forecast, by Application 2019 & 2032
- Table 26: Benelux Vehicle-Road Collaboration Solutions Revenue (million) Forecast, by Application 2019 & 2032
- Table 27: Nordics Vehicle-Road Collaboration Solutions Revenue (million) Forecast, by Application 2019 & 2032
- Table 28: Rest of Europe Vehicle-Road Collaboration Solutions Revenue (million) Forecast, by Application 2019 & 2032
- Table 29: Global Vehicle-Road Collaboration Solutions Revenue million Forecast, by Application 2019 & 2032
- Table 30: Global Vehicle-Road Collaboration Solutions Revenue million Forecast, by Types 2019 & 2032
- Table 31: Global Vehicle-Road Collaboration Solutions Revenue million Forecast, by Country 2019 & 2032
- Table 32: Turkey Vehicle-Road Collaboration Solutions Revenue (million) Forecast, by Application 2019 & 2032
- Table 33: Israel Vehicle-Road Collaboration Solutions Revenue (million) Forecast, by Application 2019 & 2032
- Table 34: GCC Vehicle-Road Collaboration Solutions Revenue (million) Forecast, by Application 2019 & 2032
- Table 35: North Africa Vehicle-Road Collaboration Solutions Revenue (million) Forecast, by Application 2019 & 2032
- Table 36: South Africa Vehicle-Road Collaboration Solutions Revenue (million) Forecast, by Application 2019 & 2032
- Table 37: Rest of Middle East & Africa Vehicle-Road Collaboration Solutions Revenue (million) Forecast, by Application 2019 & 2032
- Table 38: Global Vehicle-Road Collaboration Solutions Revenue million Forecast, by Application 2019 & 2032
- Table 39: Global Vehicle-Road Collaboration Solutions Revenue million Forecast, by Types 2019 & 2032
- Table 40: Global Vehicle-Road Collaboration Solutions Revenue million Forecast, by Country 2019 & 2032
- Table 41: China Vehicle-Road Collaboration Solutions Revenue (million) Forecast, by Application 2019 & 2032
- Table 42: India Vehicle-Road Collaboration Solutions Revenue (million) Forecast, by Application 2019 & 2032
- Table 43: Japan Vehicle-Road Collaboration Solutions Revenue (million) Forecast, by Application 2019 & 2032
- Table 44: South Korea Vehicle-Road Collaboration Solutions Revenue (million) Forecast, by Application 2019 & 2032
- Table 45: ASEAN Vehicle-Road Collaboration Solutions Revenue (million) Forecast, by Application 2019 & 2032
- Table 46: Oceania Vehicle-Road Collaboration Solutions Revenue (million) Forecast, by Application 2019 & 2032
- Table 47: Rest of Asia Pacific Vehicle-Road Collaboration Solutions Revenue (million) Forecast, by Application 2019 & 2032
Frequently Asked Questions
1. What is the projected Compound Annual Growth Rate (CAGR) of the Vehicle-Road Collaboration Solutions?
The projected CAGR is approximately XX%.
2. Which companies are prominent players in the Vehicle-Road Collaboration Solutions?
Key companies in the market include Tencent, Huawei, Alibaba, Baidu, China TransInfo Technology, Wanji Technology, EMQ, Enel Energia, The Mobility House, Hitachi, Nexteer, SWARCO.
3. What are the main segments of the Vehicle-Road Collaboration Solutions?
The market segments include Application, Types.
4. Can you provide details about the market size?
The market size is estimated to be USD XXX million as of 2022.
5. What are some drivers contributing to market growth?
N/A
6. What are the notable trends driving market growth?
N/A
7. Are there any restraints impacting market growth?
N/A
8. Can you provide examples of recent developments in the market?
N/A
9. What pricing options are available for accessing the report?
Pricing options include single-user, multi-user, and enterprise licenses priced at USD 4900.00, USD 7350.00, and USD 9800.00 respectively.
10. Is the market size provided in terms of value or volume?
The market size is provided in terms of value, measured in million.
11. Are there any specific market keywords associated with the report?
Yes, the market keyword associated with the report is "Vehicle-Road Collaboration Solutions," which aids in identifying and referencing the specific market segment covered.
12. How do I determine which pricing option suits my needs best?
The pricing options vary based on user requirements and access needs. Individual users may opt for single-user licenses, while businesses requiring broader access may choose multi-user or enterprise licenses for cost-effective access to the report.
13. Are there any additional resources or data provided in the Vehicle-Road Collaboration Solutions report?
While the report offers comprehensive insights, it's advisable to review the specific contents or supplementary materials provided to ascertain if additional resources or data are available.
14. How can I stay updated on further developments or reports in the Vehicle-Road Collaboration Solutions?
To stay informed about further developments, trends, and reports in the Vehicle-Road Collaboration Solutions, consider subscribing to industry newsletters, following relevant companies and organizations, or regularly checking reputable industry news sources and publications.
Methodology
Step 1 - Identification of Relevant Samples Size from Population Database


Step 2 - Approaches for Defining Global Market Size (Value, Volume* & Price*)

Note*: In applicable scenarios
Step 3 - Data Sources
Primary Research
- Web Analytics
- Survey Reports
- Research Institute
- Latest Research Reports
- Opinion Leaders
Secondary Research
- Annual Reports
- White Paper
- Latest Press Release
- Industry Association
- Paid Database
- Investor Presentations

Step 4 - Data Triangulation
Involves using different sources of information in order to increase the validity of a study
These sources are likely to be stakeholders in a program - participants, other researchers, program staff, other community members, and so on.
Then we put all data in single framework & apply various statistical tools to find out the dynamic on the market.
During the analysis stage, feedback from the stakeholder groups would be compared to determine areas of agreement as well as areas of divergence


