
Key Insights
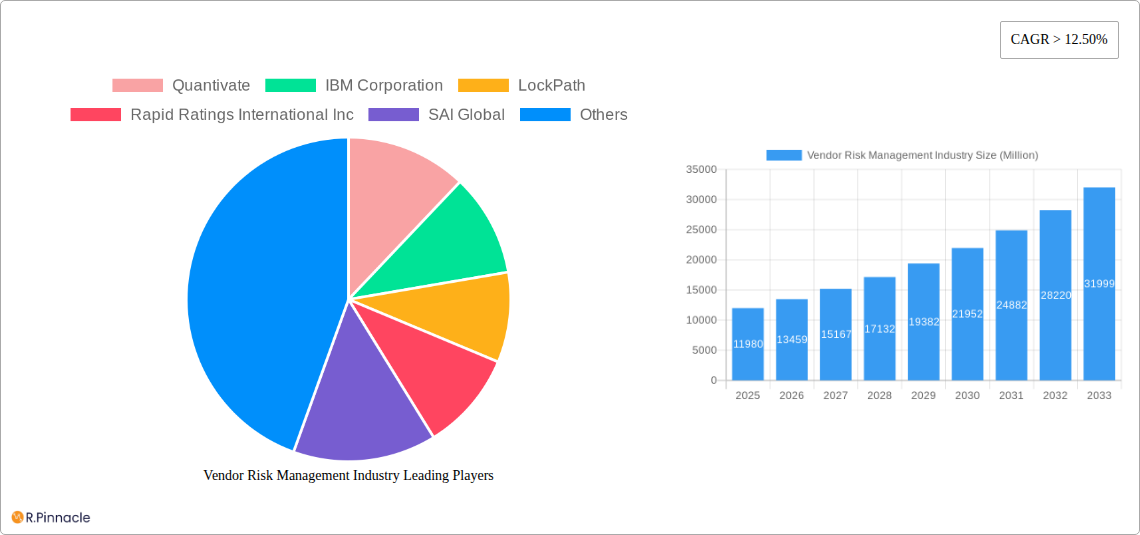
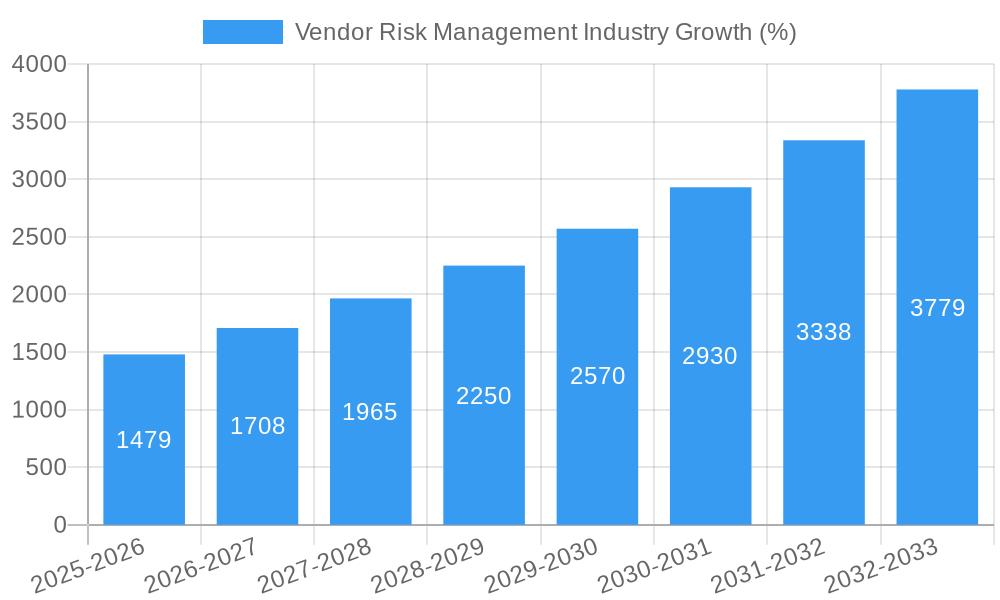
The Vendor Risk Management (VRM) market is experiencing robust growth, projected to reach $11.98 billion in 2025 and maintain a Compound Annual Growth Rate (CAGR) exceeding 12.50% from 2025 to 2033. This expansion is fueled by several key drivers. Increasing cyber threats and regulatory compliance mandates, particularly within sectors like banking, finance, healthcare, and government, are compelling organizations to proactively manage risks associated with third-party vendors. The shift towards cloud-based solutions is further accelerating market growth, offering scalability, flexibility, and cost-effectiveness compared to on-premises deployments. Furthermore, the rising adoption of sophisticated VRM solutions incorporating advanced analytics and artificial intelligence for risk assessment and mitigation contributes significantly to this expanding market. The market is segmented by solution type (qualitative analysis solutions, contract management software, and others), deployment (on-premises and cloud), organization size (SMEs and large enterprises), and industry vertical (BFSI, Telecom/IT, Manufacturing, Government, Healthcare, and others). Competition is fierce, with established players like IBM, SAI Global, and MetricStream alongside emerging specialized vendors vying for market share.
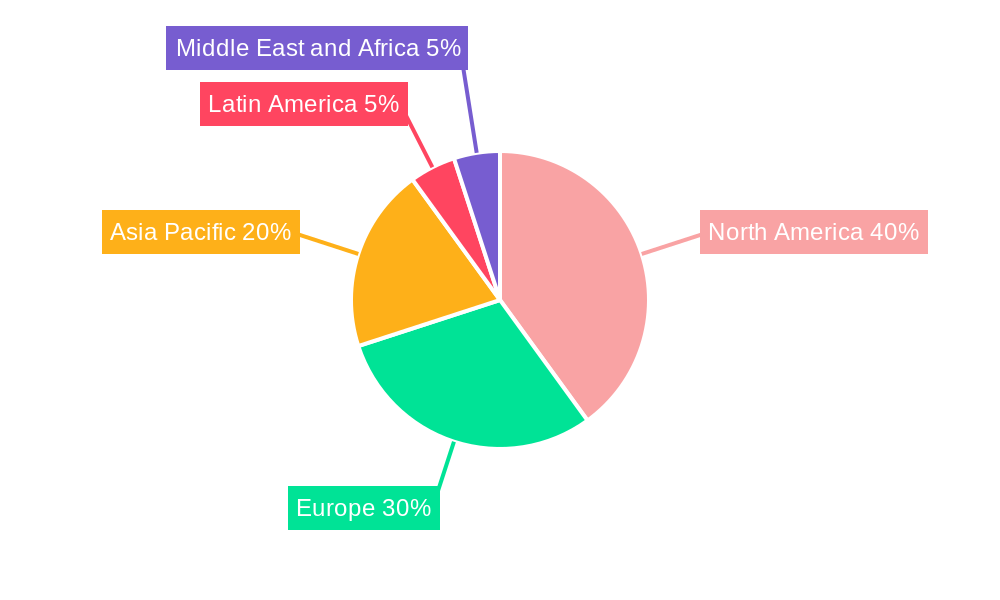
The sustained growth trajectory is expected to continue through 2033, driven by ongoing digital transformation, increasing interconnectedness, and the ever-evolving threat landscape. While data breaches and associated reputational damage pose a significant restraint, the market's resilience stems from the critical need for robust VRM strategies. North America currently holds a significant market share, but the Asia-Pacific region is poised for rapid growth due to increasing technological adoption and stringent regulatory frameworks. The overall market is characterized by a blend of established players offering comprehensive suites and specialized niche players providing focused solutions, leading to a competitive and innovative market landscape. The continued focus on automation, integration with existing security infrastructure, and the development of more sophisticated risk scoring models will shape the future evolution of the VRM market.
Vendor Risk Management (VRM) Industry Report: 2019-2033
This comprehensive report provides an in-depth analysis of the Vendor Risk Management (VRM) industry, offering valuable insights for industry professionals, investors, and strategic decision-makers. With a study period spanning 2019-2033, a base year of 2025, and a forecast period of 2025-2033, this report leverages extensive market research to deliver actionable intelligence on market size, growth drivers, competitive landscape, and future trends. The global VRM market is projected to reach xx Million by 2033.
Vendor Risk Management Industry Market Structure & Innovation Trends
The Vendor Risk Management market exhibits a moderately concentrated structure, with several key players commanding significant market share. While precise figures for market share are proprietary, companies like IBM Corporation, SAI Global, and Quantivate hold substantial positions. The market is characterized by ongoing innovation driven by increasing regulatory scrutiny, cybersecurity threats, and the growing complexity of supply chains. Mergers and acquisitions (M&A) are frequent, with deal values reaching hundreds of Millions annually in recent years. For instance, a notable xx Million M&A deal involved [Insert Example if available, otherwise replace with "a key player in the space"]. Product substitution is primarily driven by the emergence of AI-powered solutions offering automation and enhanced efficiency. The end-user demographics are predominantly large enterprises across various industry verticals, with a growing adoption among SMEs.
- Key Players: IBM Corporation, SAI Global, Quantivate, and others.
- Innovation Drivers: Regulatory compliance, cybersecurity threats, supply chain complexity.
- M&A Activity: Significant activity, with deal values exceeding xx Million annually.
- Market Concentration: Moderately concentrated, with several key players dominating.
Vendor Risk Management Industry Market Dynamics & Trends
The VRM market is experiencing robust growth, driven primarily by increasing awareness of third-party risks, stringent regulatory frameworks (like GDPR and CCPA), and the rising adoption of cloud-based solutions. Technological disruptions, specifically the integration of artificial intelligence and machine learning, are significantly enhancing the efficiency and effectiveness of VRM solutions. Consumer preferences are shifting toward automated, integrated platforms that streamline vendor risk assessments and compliance monitoring. The competitive landscape is dynamic, with established players facing increasing competition from agile startups and niche players. The Compound Annual Growth Rate (CAGR) is projected to be xx% during the forecast period, with market penetration expected to reach xx% by 2033.
Dominant Regions & Segments in Vendor Risk Management Industry
The North American region currently dominates the VRM market, driven by robust regulatory frameworks, high adoption rates among large enterprises, and significant investments in cybersecurity. However, the Asia-Pacific region is poised for significant growth fueled by rapid economic expansion and increasing digitalization.
- By Type: Solutions (including Qualitative Analysis sub-segments) holds the largest market share due to its comprehensive coverage of vendor risk management needs. Contract management solutions are a rapidly growing sub-segment within the Solutions category. Services are also significant, offering tailored expertise to manage complex risk scenarios.
- By Deployment Type: Cloud-based deployments are gaining traction due to scalability, cost-effectiveness, and ease of access. However, on-premises solutions remain relevant for organizations with stringent security requirements.
- By Organization Size: Large enterprises currently drive most of the market demand due to their complex supply chains and higher risk exposure. However, the SME segment is demonstrating substantial growth potential.
- By Industry Vertical: Banking, Financial Services, and Insurance (BFSI) hold the largest market share owing to their stringent regulatory compliance needs. However, Telecom and IT, Manufacturing, and Healthcare are also experiencing robust growth due to increased vulnerability to cyber threats.
Vendor Risk Management Industry Product Innovations
Recent product innovations in the VRM space focus on leveraging AI and automation to streamline vendor risk assessments, improve accuracy, and reduce manual effort. New platforms offer integrated workflows, enhanced reporting capabilities, and seamless integration with other security tools. This enhances the overall value proposition by reducing operational costs, improving decision-making, and minimizing risks.
Report Scope & Segmentation Analysis
This report comprehensively analyzes the VRM market across various segments: By Type (Solutions - including Qualitative Analysis sub-segments, Contract Management and Other Services), By Deployment Type (On-Premises, Cloud), By Organization Size (SMEs, Large Enterprises), and By Industry Vertical (BFSI, Telecom & IT, Manufacturing, Government, Healthcare, and Others). Each segment's growth projections, market size, and competitive dynamics are detailed within the full report.
Key Drivers of Vendor Risk Management Industry Growth
The growth of the VRM industry is propelled by several factors: stringent government regulations mandating third-party risk management, increasing cyber threats targeting supply chains, the rising adoption of cloud-based technologies, and the growing awareness of the financial and reputational risks associated with vendor vulnerabilities.
Challenges in the Vendor Risk Management Industry Sector
The VRM sector faces challenges including the high cost of implementation, the complexity of integrating VRM solutions with existing systems, the shortage of skilled professionals, and the constant evolution of cyber threats. These challenges can lead to difficulties in effectively managing third-party risks and achieving full compliance.
Emerging Opportunities in Vendor Risk Management Industry
Emerging opportunities include the expanding adoption of AI and machine learning to automate risk assessments, the integration of VRM solutions with other security tools, and the increasing demand for VRM solutions in emerging markets. The development of solutions that address specific industry verticals presents further opportunities for growth.
Leading Players in the Vendor Risk Management Industry Market
- Quantivate
- IBM Corporation
- LockPath
- Rapid Ratings International Inc
- SAI Global
- MetricStream
- Resolver Inc
- Optiv Security Inc
- RSA Security LLC
- Genpact Limited
Key Developments in Vendor Risk Management Industry
- September 2023: Certa raises USD 35 Million to develop AI-powered workflows for third-party risk management, promising faster onboarding and reduced team sizes.
- May 2023: Vanta launches a VRM offering focused on automated workflows for vendor security reviews and compliance, integrating with third-party applications.
Future Outlook for Vendor Risk Management Industry Market
The future of the VRM market is bright, driven by the ongoing digital transformation, increasing regulatory compliance requirements, and the persistent threat of cyberattacks. The market is expected to witness sustained growth, driven by increased adoption of advanced technologies like AI and machine learning, and the expansion into new geographies and industry verticals. Strategic partnerships and acquisitions will further shape the competitive landscape.
Vendor Risk Management Industry Segmentation
-
1. Type
-
1.1. Solutions (Qualitative Analysis for Sub-Segments)
- 1.1.1. Vendor Information Management
- 1.1.2. Quality Assurance Management
- 1.1.3. Financial Control
- 1.1.4. Compliance Management
- 1.1.5. Audit Management
- 1.1.6. Contract Management and Others
- 1.2. Services
-
1.1. Solutions (Qualitative Analysis for Sub-Segments)
-
2. Deployment Type
- 2.1. On-Premises
- 2.2. Cloud
-
3. Organization Size
- 3.1. Small and Medium-Sized Enterprises
- 3.2. Large Enterprises
-
4. Industry Vertical
- 4.1. Banking, Financial Services, and Insurance
- 4.2. Telecom and IT
- 4.3. Manufacturing
- 4.4. Government
- 4.5. Healthcare
- 4.6. Others (
Vendor Risk Management Industry Segmentation By Geography
- 1. North America
- 2. Europe
- 3. Asia Pacific
- 4. Latin America
- 5. Middle East and Africa
Vendor Risk Management Industry REPORT HIGHLIGHTS
| Aspects | Details |
|---|---|
| Study Period | 2019-2033 |
| Base Year | 2024 |
| Estimated Year | 2025 |
| Forecast Period | 2025-2033 |
| Historical Period | 2019-2024 |
| Growth Rate | CAGR of > 12.50% from 2019-2033 |
| Segmentation |
|
Table of Contents
- 1. Introduction
- 1.1. Research Scope
- 1.2. Market Segmentation
- 1.3. Research Methodology
- 1.4. Definitions and Assumptions
- 2. Executive Summary
- 2.1. Introduction
- 3. Market Dynamics
- 3.1. Introduction
- 3.2. Market Drivers
- 3.2.1. Need for the Efficient Management of Complex Vendor Ecosystems; View the Risk Levels Associated With Various Tasks
- 3.3. Market Restrains
- 3.3.1. Dependence on Non-Formal and Manual Processes By Many Organizations
- 3.4. Market Trends
- 3.4.1. BFSI is Expected to Witness Significant Growth
- 4. Market Factor Analysis
- 4.1. Porters Five Forces
- 4.2. Supply/Value Chain
- 4.3. PESTEL analysis
- 4.4. Market Entropy
- 4.5. Patent/Trademark Analysis
- 5. Global Vendor Risk Management Industry Analysis, Insights and Forecast, 2019-2031
- 5.1. Market Analysis, Insights and Forecast - by Type
- 5.1.1. Solutions (Qualitative Analysis for Sub-Segments)
- 5.1.1.1. Vendor Information Management
- 5.1.1.2. Quality Assurance Management
- 5.1.1.3. Financial Control
- 5.1.1.4. Compliance Management
- 5.1.1.5. Audit Management
- 5.1.1.6. Contract Management and Others
- 5.1.2. Services
- 5.1.1. Solutions (Qualitative Analysis for Sub-Segments)
- 5.2. Market Analysis, Insights and Forecast - by Deployment Type
- 5.2.1. On-Premises
- 5.2.2. Cloud
- 5.3. Market Analysis, Insights and Forecast - by Organization Size
- 5.3.1. Small and Medium-Sized Enterprises
- 5.3.2. Large Enterprises
- 5.4. Market Analysis, Insights and Forecast - by Industry Vertical
- 5.4.1. Banking, Financial Services, and Insurance
- 5.4.2. Telecom and IT
- 5.4.3. Manufacturing
- 5.4.4. Government
- 5.4.5. Healthcare
- 5.4.6. Others (
- 5.5. Market Analysis, Insights and Forecast - by Region
- 5.5.1. North America
- 5.5.2. Europe
- 5.5.3. Asia Pacific
- 5.5.4. Latin America
- 5.5.5. Middle East and Africa
- 5.1. Market Analysis, Insights and Forecast - by Type
- 6. North America Vendor Risk Management Industry Analysis, Insights and Forecast, 2019-2031
- 6.1. Market Analysis, Insights and Forecast - by Type
- 6.1.1. Solutions (Qualitative Analysis for Sub-Segments)
- 6.1.1.1. Vendor Information Management
- 6.1.1.2. Quality Assurance Management
- 6.1.1.3. Financial Control
- 6.1.1.4. Compliance Management
- 6.1.1.5. Audit Management
- 6.1.1.6. Contract Management and Others
- 6.1.2. Services
- 6.1.1. Solutions (Qualitative Analysis for Sub-Segments)
- 6.2. Market Analysis, Insights and Forecast - by Deployment Type
- 6.2.1. On-Premises
- 6.2.2. Cloud
- 6.3. Market Analysis, Insights and Forecast - by Organization Size
- 6.3.1. Small and Medium-Sized Enterprises
- 6.3.2. Large Enterprises
- 6.4. Market Analysis, Insights and Forecast - by Industry Vertical
- 6.4.1. Banking, Financial Services, and Insurance
- 6.4.2. Telecom and IT
- 6.4.3. Manufacturing
- 6.4.4. Government
- 6.4.5. Healthcare
- 6.4.6. Others (
- 6.1. Market Analysis, Insights and Forecast - by Type
- 7. Europe Vendor Risk Management Industry Analysis, Insights and Forecast, 2019-2031
- 7.1. Market Analysis, Insights and Forecast - by Type
- 7.1.1. Solutions (Qualitative Analysis for Sub-Segments)
- 7.1.1.1. Vendor Information Management
- 7.1.1.2. Quality Assurance Management
- 7.1.1.3. Financial Control
- 7.1.1.4. Compliance Management
- 7.1.1.5. Audit Management
- 7.1.1.6. Contract Management and Others
- 7.1.2. Services
- 7.1.1. Solutions (Qualitative Analysis for Sub-Segments)
- 7.2. Market Analysis, Insights and Forecast - by Deployment Type
- 7.2.1. On-Premises
- 7.2.2. Cloud
- 7.3. Market Analysis, Insights and Forecast - by Organization Size
- 7.3.1. Small and Medium-Sized Enterprises
- 7.3.2. Large Enterprises
- 7.4. Market Analysis, Insights and Forecast - by Industry Vertical
- 7.4.1. Banking, Financial Services, and Insurance
- 7.4.2. Telecom and IT
- 7.4.3. Manufacturing
- 7.4.4. Government
- 7.4.5. Healthcare
- 7.4.6. Others (
- 7.1. Market Analysis, Insights and Forecast - by Type
- 8. Asia Pacific Vendor Risk Management Industry Analysis, Insights and Forecast, 2019-2031
- 8.1. Market Analysis, Insights and Forecast - by Type
- 8.1.1. Solutions (Qualitative Analysis for Sub-Segments)
- 8.1.1.1. Vendor Information Management
- 8.1.1.2. Quality Assurance Management
- 8.1.1.3. Financial Control
- 8.1.1.4. Compliance Management
- 8.1.1.5. Audit Management
- 8.1.1.6. Contract Management and Others
- 8.1.2. Services
- 8.1.1. Solutions (Qualitative Analysis for Sub-Segments)
- 8.2. Market Analysis, Insights and Forecast - by Deployment Type
- 8.2.1. On-Premises
- 8.2.2. Cloud
- 8.3. Market Analysis, Insights and Forecast - by Organization Size
- 8.3.1. Small and Medium-Sized Enterprises
- 8.3.2. Large Enterprises
- 8.4. Market Analysis, Insights and Forecast - by Industry Vertical
- 8.4.1. Banking, Financial Services, and Insurance
- 8.4.2. Telecom and IT
- 8.4.3. Manufacturing
- 8.4.4. Government
- 8.4.5. Healthcare
- 8.4.6. Others (
- 8.1. Market Analysis, Insights and Forecast - by Type
- 9. Latin America Vendor Risk Management Industry Analysis, Insights and Forecast, 2019-2031
- 9.1. Market Analysis, Insights and Forecast - by Type
- 9.1.1. Solutions (Qualitative Analysis for Sub-Segments)
- 9.1.1.1. Vendor Information Management
- 9.1.1.2. Quality Assurance Management
- 9.1.1.3. Financial Control
- 9.1.1.4. Compliance Management
- 9.1.1.5. Audit Management
- 9.1.1.6. Contract Management and Others
- 9.1.2. Services
- 9.1.1. Solutions (Qualitative Analysis for Sub-Segments)
- 9.2. Market Analysis, Insights and Forecast - by Deployment Type
- 9.2.1. On-Premises
- 9.2.2. Cloud
- 9.3. Market Analysis, Insights and Forecast - by Organization Size
- 9.3.1. Small and Medium-Sized Enterprises
- 9.3.2. Large Enterprises
- 9.4. Market Analysis, Insights and Forecast - by Industry Vertical
- 9.4.1. Banking, Financial Services, and Insurance
- 9.4.2. Telecom and IT
- 9.4.3. Manufacturing
- 9.4.4. Government
- 9.4.5. Healthcare
- 9.4.6. Others (
- 9.1. Market Analysis, Insights and Forecast - by Type
- 10. Middle East and Africa Vendor Risk Management Industry Analysis, Insights and Forecast, 2019-2031
- 10.1. Market Analysis, Insights and Forecast - by Type
- 10.1.1. Solutions (Qualitative Analysis for Sub-Segments)
- 10.1.1.1. Vendor Information Management
- 10.1.1.2. Quality Assurance Management
- 10.1.1.3. Financial Control
- 10.1.1.4. Compliance Management
- 10.1.1.5. Audit Management
- 10.1.1.6. Contract Management and Others
- 10.1.2. Services
- 10.1.1. Solutions (Qualitative Analysis for Sub-Segments)
- 10.2. Market Analysis, Insights and Forecast - by Deployment Type
- 10.2.1. On-Premises
- 10.2.2. Cloud
- 10.3. Market Analysis, Insights and Forecast - by Organization Size
- 10.3.1. Small and Medium-Sized Enterprises
- 10.3.2. Large Enterprises
- 10.4. Market Analysis, Insights and Forecast - by Industry Vertical
- 10.4.1. Banking, Financial Services, and Insurance
- 10.4.2. Telecom and IT
- 10.4.3. Manufacturing
- 10.4.4. Government
- 10.4.5. Healthcare
- 10.4.6. Others (
- 10.1. Market Analysis, Insights and Forecast - by Type
- 11. North America Vendor Risk Management Industry Analysis, Insights and Forecast, 2019-2031
- 11.1. Market Analysis, Insights and Forecast - By Country/Sub-region
- 11.1.1.
- 12. Europe Vendor Risk Management Industry Analysis, Insights and Forecast, 2019-2031
- 12.1. Market Analysis, Insights and Forecast - By Country/Sub-region
- 12.1.1.
- 13. Asia Pacific Vendor Risk Management Industry Analysis, Insights and Forecast, 2019-2031
- 13.1. Market Analysis, Insights and Forecast - By Country/Sub-region
- 13.1.1.
- 14. Latin America Vendor Risk Management Industry Analysis, Insights and Forecast, 2019-2031
- 14.1. Market Analysis, Insights and Forecast - By Country/Sub-region
- 14.1.1.
- 15. Middle East and Africa Vendor Risk Management Industry Analysis, Insights and Forecast, 2019-2031
- 15.1. Market Analysis, Insights and Forecast - By Country/Sub-region
- 15.1.1.
- 16. Competitive Analysis
- 16.1. Global Market Share Analysis 2024
- 16.2. Company Profiles
- 16.2.1 Quantivate
- 16.2.1.1. Overview
- 16.2.1.2. Products
- 16.2.1.3. SWOT Analysis
- 16.2.1.4. Recent Developments
- 16.2.1.5. Financials (Based on Availability)
- 16.2.2 IBM Corporation
- 16.2.2.1. Overview
- 16.2.2.2. Products
- 16.2.2.3. SWOT Analysis
- 16.2.2.4. Recent Developments
- 16.2.2.5. Financials (Based on Availability)
- 16.2.3 LockPath
- 16.2.3.1. Overview
- 16.2.3.2. Products
- 16.2.3.3. SWOT Analysis
- 16.2.3.4. Recent Developments
- 16.2.3.5. Financials (Based on Availability)
- 16.2.4 Rapid Ratings International Inc
- 16.2.4.1. Overview
- 16.2.4.2. Products
- 16.2.4.3. SWOT Analysis
- 16.2.4.4. Recent Developments
- 16.2.4.5. Financials (Based on Availability)
- 16.2.5 SAI Global
- 16.2.5.1. Overview
- 16.2.5.2. Products
- 16.2.5.3. SWOT Analysis
- 16.2.5.4. Recent Developments
- 16.2.5.5. Financials (Based on Availability)
- 16.2.6 MetricStream
- 16.2.6.1. Overview
- 16.2.6.2. Products
- 16.2.6.3. SWOT Analysis
- 16.2.6.4. Recent Developments
- 16.2.6.5. Financials (Based on Availability)
- 16.2.7 Resolver Inc
- 16.2.7.1. Overview
- 16.2.7.2. Products
- 16.2.7.3. SWOT Analysis
- 16.2.7.4. Recent Developments
- 16.2.7.5. Financials (Based on Availability)
- 16.2.8 Optiv Security Inc *List Not Exhaustive
- 16.2.8.1. Overview
- 16.2.8.2. Products
- 16.2.8.3. SWOT Analysis
- 16.2.8.4. Recent Developments
- 16.2.8.5. Financials (Based on Availability)
- 16.2.9 RSA Security LLC
- 16.2.9.1. Overview
- 16.2.9.2. Products
- 16.2.9.3. SWOT Analysis
- 16.2.9.4. Recent Developments
- 16.2.9.5. Financials (Based on Availability)
- 16.2.10 Genpact Limited
- 16.2.10.1. Overview
- 16.2.10.2. Products
- 16.2.10.3. SWOT Analysis
- 16.2.10.4. Recent Developments
- 16.2.10.5. Financials (Based on Availability)
- 16.2.1 Quantivate
List of Figures
- Figure 1: Global Vendor Risk Management Industry Revenue Breakdown (Million, %) by Region 2024 & 2032
- Figure 2: North America Vendor Risk Management Industry Revenue (Million), by Country 2024 & 2032
- Figure 3: North America Vendor Risk Management Industry Revenue Share (%), by Country 2024 & 2032
- Figure 4: Europe Vendor Risk Management Industry Revenue (Million), by Country 2024 & 2032
- Figure 5: Europe Vendor Risk Management Industry Revenue Share (%), by Country 2024 & 2032
- Figure 6: Asia Pacific Vendor Risk Management Industry Revenue (Million), by Country 2024 & 2032
- Figure 7: Asia Pacific Vendor Risk Management Industry Revenue Share (%), by Country 2024 & 2032
- Figure 8: Latin America Vendor Risk Management Industry Revenue (Million), by Country 2024 & 2032
- Figure 9: Latin America Vendor Risk Management Industry Revenue Share (%), by Country 2024 & 2032
- Figure 10: Middle East and Africa Vendor Risk Management Industry Revenue (Million), by Country 2024 & 2032
- Figure 11: Middle East and Africa Vendor Risk Management Industry Revenue Share (%), by Country 2024 & 2032
- Figure 12: North America Vendor Risk Management Industry Revenue (Million), by Type 2024 & 2032
- Figure 13: North America Vendor Risk Management Industry Revenue Share (%), by Type 2024 & 2032
- Figure 14: North America Vendor Risk Management Industry Revenue (Million), by Deployment Type 2024 & 2032
- Figure 15: North America Vendor Risk Management Industry Revenue Share (%), by Deployment Type 2024 & 2032
- Figure 16: North America Vendor Risk Management Industry Revenue (Million), by Organization Size 2024 & 2032
- Figure 17: North America Vendor Risk Management Industry Revenue Share (%), by Organization Size 2024 & 2032
- Figure 18: North America Vendor Risk Management Industry Revenue (Million), by Industry Vertical 2024 & 2032
- Figure 19: North America Vendor Risk Management Industry Revenue Share (%), by Industry Vertical 2024 & 2032
- Figure 20: North America Vendor Risk Management Industry Revenue (Million), by Country 2024 & 2032
- Figure 21: North America Vendor Risk Management Industry Revenue Share (%), by Country 2024 & 2032
- Figure 22: Europe Vendor Risk Management Industry Revenue (Million), by Type 2024 & 2032
- Figure 23: Europe Vendor Risk Management Industry Revenue Share (%), by Type 2024 & 2032
- Figure 24: Europe Vendor Risk Management Industry Revenue (Million), by Deployment Type 2024 & 2032
- Figure 25: Europe Vendor Risk Management Industry Revenue Share (%), by Deployment Type 2024 & 2032
- Figure 26: Europe Vendor Risk Management Industry Revenue (Million), by Organization Size 2024 & 2032
- Figure 27: Europe Vendor Risk Management Industry Revenue Share (%), by Organization Size 2024 & 2032
- Figure 28: Europe Vendor Risk Management Industry Revenue (Million), by Industry Vertical 2024 & 2032
- Figure 29: Europe Vendor Risk Management Industry Revenue Share (%), by Industry Vertical 2024 & 2032
- Figure 30: Europe Vendor Risk Management Industry Revenue (Million), by Country 2024 & 2032
- Figure 31: Europe Vendor Risk Management Industry Revenue Share (%), by Country 2024 & 2032
- Figure 32: Asia Pacific Vendor Risk Management Industry Revenue (Million), by Type 2024 & 2032
- Figure 33: Asia Pacific Vendor Risk Management Industry Revenue Share (%), by Type 2024 & 2032
- Figure 34: Asia Pacific Vendor Risk Management Industry Revenue (Million), by Deployment Type 2024 & 2032
- Figure 35: Asia Pacific Vendor Risk Management Industry Revenue Share (%), by Deployment Type 2024 & 2032
- Figure 36: Asia Pacific Vendor Risk Management Industry Revenue (Million), by Organization Size 2024 & 2032
- Figure 37: Asia Pacific Vendor Risk Management Industry Revenue Share (%), by Organization Size 2024 & 2032
- Figure 38: Asia Pacific Vendor Risk Management Industry Revenue (Million), by Industry Vertical 2024 & 2032
- Figure 39: Asia Pacific Vendor Risk Management Industry Revenue Share (%), by Industry Vertical 2024 & 2032
- Figure 40: Asia Pacific Vendor Risk Management Industry Revenue (Million), by Country 2024 & 2032
- Figure 41: Asia Pacific Vendor Risk Management Industry Revenue Share (%), by Country 2024 & 2032
- Figure 42: Latin America Vendor Risk Management Industry Revenue (Million), by Type 2024 & 2032
- Figure 43: Latin America Vendor Risk Management Industry Revenue Share (%), by Type 2024 & 2032
- Figure 44: Latin America Vendor Risk Management Industry Revenue (Million), by Deployment Type 2024 & 2032
- Figure 45: Latin America Vendor Risk Management Industry Revenue Share (%), by Deployment Type 2024 & 2032
- Figure 46: Latin America Vendor Risk Management Industry Revenue (Million), by Organization Size 2024 & 2032
- Figure 47: Latin America Vendor Risk Management Industry Revenue Share (%), by Organization Size 2024 & 2032
- Figure 48: Latin America Vendor Risk Management Industry Revenue (Million), by Industry Vertical 2024 & 2032
- Figure 49: Latin America Vendor Risk Management Industry Revenue Share (%), by Industry Vertical 2024 & 2032
- Figure 50: Latin America Vendor Risk Management Industry Revenue (Million), by Country 2024 & 2032
- Figure 51: Latin America Vendor Risk Management Industry Revenue Share (%), by Country 2024 & 2032
- Figure 52: Middle East and Africa Vendor Risk Management Industry Revenue (Million), by Type 2024 & 2032
- Figure 53: Middle East and Africa Vendor Risk Management Industry Revenue Share (%), by Type 2024 & 2032
- Figure 54: Middle East and Africa Vendor Risk Management Industry Revenue (Million), by Deployment Type 2024 & 2032
- Figure 55: Middle East and Africa Vendor Risk Management Industry Revenue Share (%), by Deployment Type 2024 & 2032
- Figure 56: Middle East and Africa Vendor Risk Management Industry Revenue (Million), by Organization Size 2024 & 2032
- Figure 57: Middle East and Africa Vendor Risk Management Industry Revenue Share (%), by Organization Size 2024 & 2032
- Figure 58: Middle East and Africa Vendor Risk Management Industry Revenue (Million), by Industry Vertical 2024 & 2032
- Figure 59: Middle East and Africa Vendor Risk Management Industry Revenue Share (%), by Industry Vertical 2024 & 2032
- Figure 60: Middle East and Africa Vendor Risk Management Industry Revenue (Million), by Country 2024 & 2032
- Figure 61: Middle East and Africa Vendor Risk Management Industry Revenue Share (%), by Country 2024 & 2032
List of Tables
- Table 1: Global Vendor Risk Management Industry Revenue Million Forecast, by Region 2019 & 2032
- Table 2: Global Vendor Risk Management Industry Revenue Million Forecast, by Type 2019 & 2032
- Table 3: Global Vendor Risk Management Industry Revenue Million Forecast, by Deployment Type 2019 & 2032
- Table 4: Global Vendor Risk Management Industry Revenue Million Forecast, by Organization Size 2019 & 2032
- Table 5: Global Vendor Risk Management Industry Revenue Million Forecast, by Industry Vertical 2019 & 2032
- Table 6: Global Vendor Risk Management Industry Revenue Million Forecast, by Region 2019 & 2032
- Table 7: Global Vendor Risk Management Industry Revenue Million Forecast, by Country 2019 & 2032
- Table 8: Vendor Risk Management Industry Revenue (Million) Forecast, by Application 2019 & 2032
- Table 9: Global Vendor Risk Management Industry Revenue Million Forecast, by Country 2019 & 2032
- Table 10: Vendor Risk Management Industry Revenue (Million) Forecast, by Application 2019 & 2032
- Table 11: Global Vendor Risk Management Industry Revenue Million Forecast, by Country 2019 & 2032
- Table 12: Vendor Risk Management Industry Revenue (Million) Forecast, by Application 2019 & 2032
- Table 13: Global Vendor Risk Management Industry Revenue Million Forecast, by Country 2019 & 2032
- Table 14: Vendor Risk Management Industry Revenue (Million) Forecast, by Application 2019 & 2032
- Table 15: Global Vendor Risk Management Industry Revenue Million Forecast, by Country 2019 & 2032
- Table 16: Vendor Risk Management Industry Revenue (Million) Forecast, by Application 2019 & 2032
- Table 17: Global Vendor Risk Management Industry Revenue Million Forecast, by Type 2019 & 2032
- Table 18: Global Vendor Risk Management Industry Revenue Million Forecast, by Deployment Type 2019 & 2032
- Table 19: Global Vendor Risk Management Industry Revenue Million Forecast, by Organization Size 2019 & 2032
- Table 20: Global Vendor Risk Management Industry Revenue Million Forecast, by Industry Vertical 2019 & 2032
- Table 21: Global Vendor Risk Management Industry Revenue Million Forecast, by Country 2019 & 2032
- Table 22: Global Vendor Risk Management Industry Revenue Million Forecast, by Type 2019 & 2032
- Table 23: Global Vendor Risk Management Industry Revenue Million Forecast, by Deployment Type 2019 & 2032
- Table 24: Global Vendor Risk Management Industry Revenue Million Forecast, by Organization Size 2019 & 2032
- Table 25: Global Vendor Risk Management Industry Revenue Million Forecast, by Industry Vertical 2019 & 2032
- Table 26: Global Vendor Risk Management Industry Revenue Million Forecast, by Country 2019 & 2032
- Table 27: Global Vendor Risk Management Industry Revenue Million Forecast, by Type 2019 & 2032
- Table 28: Global Vendor Risk Management Industry Revenue Million Forecast, by Deployment Type 2019 & 2032
- Table 29: Global Vendor Risk Management Industry Revenue Million Forecast, by Organization Size 2019 & 2032
- Table 30: Global Vendor Risk Management Industry Revenue Million Forecast, by Industry Vertical 2019 & 2032
- Table 31: Global Vendor Risk Management Industry Revenue Million Forecast, by Country 2019 & 2032
- Table 32: Global Vendor Risk Management Industry Revenue Million Forecast, by Type 2019 & 2032
- Table 33: Global Vendor Risk Management Industry Revenue Million Forecast, by Deployment Type 2019 & 2032
- Table 34: Global Vendor Risk Management Industry Revenue Million Forecast, by Organization Size 2019 & 2032
- Table 35: Global Vendor Risk Management Industry Revenue Million Forecast, by Industry Vertical 2019 & 2032
- Table 36: Global Vendor Risk Management Industry Revenue Million Forecast, by Country 2019 & 2032
- Table 37: Global Vendor Risk Management Industry Revenue Million Forecast, by Type 2019 & 2032
- Table 38: Global Vendor Risk Management Industry Revenue Million Forecast, by Deployment Type 2019 & 2032
- Table 39: Global Vendor Risk Management Industry Revenue Million Forecast, by Organization Size 2019 & 2032
- Table 40: Global Vendor Risk Management Industry Revenue Million Forecast, by Industry Vertical 2019 & 2032
- Table 41: Global Vendor Risk Management Industry Revenue Million Forecast, by Country 2019 & 2032
Frequently Asked Questions
1. What is the projected Compound Annual Growth Rate (CAGR) of the Vendor Risk Management Industry?
The projected CAGR is approximately > 12.50%.
2. Which companies are prominent players in the Vendor Risk Management Industry?
Key companies in the market include Quantivate, IBM Corporation, LockPath, Rapid Ratings International Inc, SAI Global, MetricStream, Resolver Inc, Optiv Security Inc *List Not Exhaustive, RSA Security LLC, Genpact Limited.
3. What are the main segments of the Vendor Risk Management Industry?
The market segments include Type, Deployment Type, Organization Size, Industry Vertical.
4. Can you provide details about the market size?
The market size is estimated to be USD 11.98 Million as of 2022.
5. What are some drivers contributing to market growth?
Need for the Efficient Management of Complex Vendor Ecosystems; View the Risk Levels Associated With Various Tasks.
6. What are the notable trends driving market growth?
BFSI is Expected to Witness Significant Growth.
7. Are there any restraints impacting market growth?
Dependence on Non-Formal and Manual Processes By Many Organizations.
8. Can you provide examples of recent developments in the market?
September 2023 - Certa, a third-party management platform, has raised USD 35 million to invest in artificial intelligence that takes text-based policies around everything from ESG and legal to compliance and procurement and converts them into controlled workflows that integrate with third-party tools. Using artificial intelligence will allow customers to reduce the size of their vendor management team and onboard third-party providers more quickly.
9. What pricing options are available for accessing the report?
Pricing options include single-user, multi-user, and enterprise licenses priced at USD 4750, USD 5250, and USD 8750 respectively.
10. Is the market size provided in terms of value or volume?
The market size is provided in terms of value, measured in Million.
11. Are there any specific market keywords associated with the report?
Yes, the market keyword associated with the report is "Vendor Risk Management Industry," which aids in identifying and referencing the specific market segment covered.
12. How do I determine which pricing option suits my needs best?
The pricing options vary based on user requirements and access needs. Individual users may opt for single-user licenses, while businesses requiring broader access may choose multi-user or enterprise licenses for cost-effective access to the report.
13. Are there any additional resources or data provided in the Vendor Risk Management Industry report?
While the report offers comprehensive insights, it's advisable to review the specific contents or supplementary materials provided to ascertain if additional resources or data are available.
14. How can I stay updated on further developments or reports in the Vendor Risk Management Industry?
To stay informed about further developments, trends, and reports in the Vendor Risk Management Industry, consider subscribing to industry newsletters, following relevant companies and organizations, or regularly checking reputable industry news sources and publications.
Methodology
Step 1 - Identification of Relevant Samples Size from Population Database


Step 2 - Approaches for Defining Global Market Size (Value, Volume* & Price*)

Note*: In applicable scenarios
Step 3 - Data Sources
Primary Research
- Web Analytics
- Survey Reports
- Research Institute
- Latest Research Reports
- Opinion Leaders
Secondary Research
- Annual Reports
- White Paper
- Latest Press Release
- Industry Association
- Paid Database
- Investor Presentations

Step 4 - Data Triangulation
Involves using different sources of information in order to increase the validity of a study
These sources are likely to be stakeholders in a program - participants, other researchers, program staff, other community members, and so on.
Then we put all data in single framework & apply various statistical tools to find out the dynamic on the market.
During the analysis stage, feedback from the stakeholder groups would be compared to determine areas of agreement as well as areas of divergence


