
Key Insights
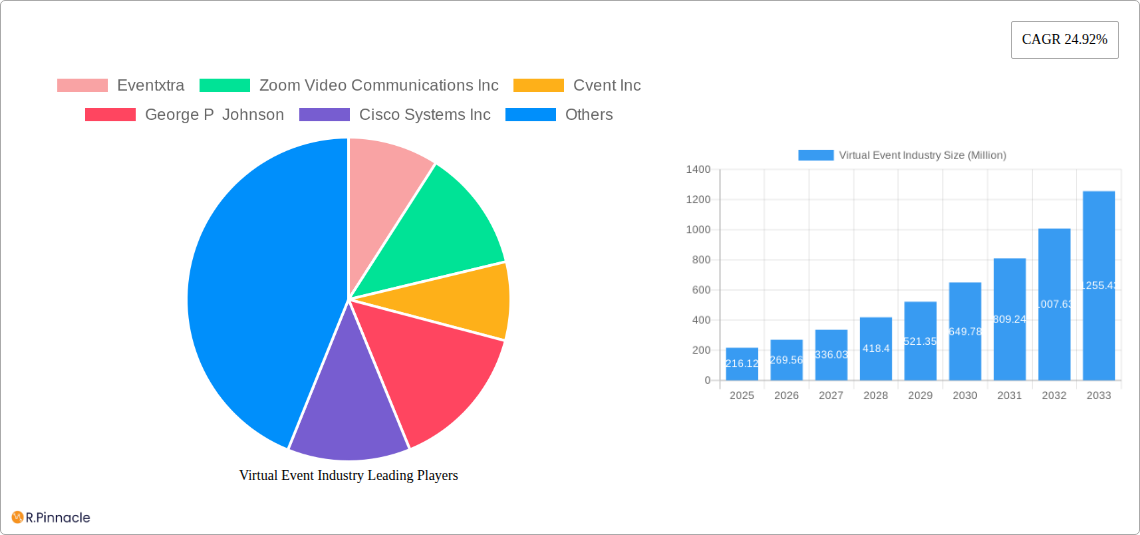
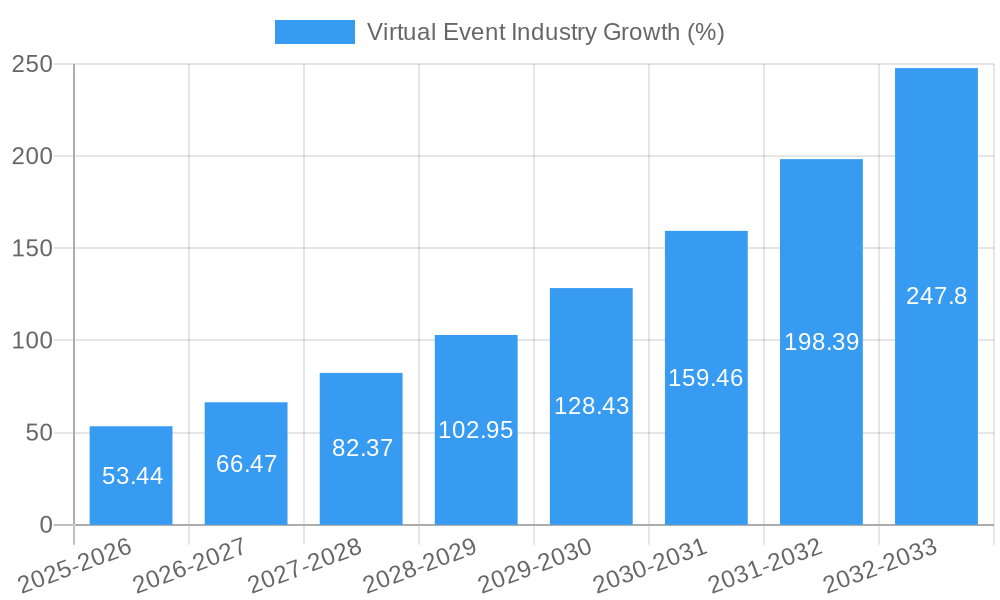
The virtual event industry is experiencing explosive growth, projected to reach a market size of $216.12 million in 2025, exhibiting a remarkable Compound Annual Growth Rate (CAGR) of 24.92%. This robust expansion is fueled by several key drivers. The increasing adoption of digital technologies across various sectors, coupled with the cost-effectiveness and enhanced accessibility of virtual events compared to traditional in-person gatherings, significantly contributes to this surge. Furthermore, the rising demand for engaging and interactive online experiences, particularly among younger demographics, is propelling market growth. The flexibility offered by virtual events – allowing for global participation, on-demand content access, and reduced logistical complexities – is another significant factor. Segmentation reveals strong growth across service types, including communication, recruitment, sales & marketing, and training, with applications spanning conferences, exhibitions, summits, and other specialized events. Key players such as Zoom, Cvent, and others are strategically expanding their offerings to capitalize on this burgeoning market.
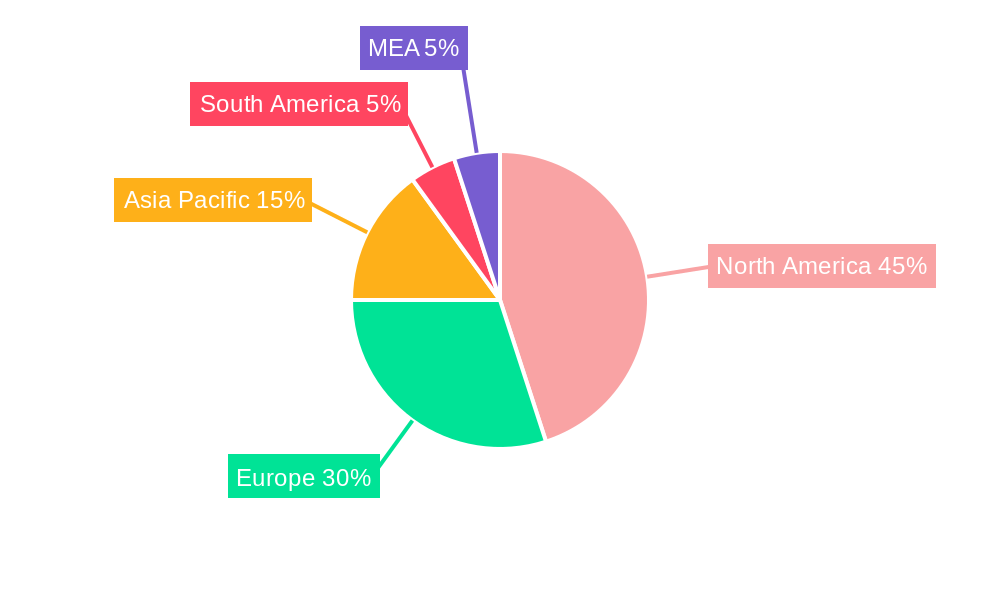
Significant regional variations exist, with North America currently dominating the market share due to high technology adoption and a robust enterprise sector. However, rapid growth is anticipated in the Asia-Pacific region, driven by increasing internet penetration and a burgeoning digital economy. Europe also presents a significant market opportunity, with substantial investments in digital infrastructure and a growing awareness of the benefits of virtual events. While challenges exist, such as ensuring engaging virtual experiences and addressing concerns around technological limitations and cybersecurity, the overall market trajectory indicates continued, strong growth through 2033. The industry will continue to evolve, incorporating advanced technologies like AI and VR/AR to enhance user experience and expand the range of applications for virtual events.
Virtual Event Industry Market Report: A Comprehensive Analysis (2019-2033)
This in-depth report provides a comprehensive analysis of the virtual event industry, projecting a market valuation exceeding $XX Million by 2033. It offers actionable insights for industry professionals, investors, and strategists seeking to navigate the dynamic landscape of this rapidly growing sector. The report covers key market segments, dominant players, emerging trends, and future growth opportunities, utilizing data from the historical period (2019-2024), base year (2025), and forecast period (2025-2033).
Virtual Event Industry Market Structure & Innovation Trends
This section analyzes the competitive landscape of the virtual event industry, encompassing market concentration, innovation drivers, regulatory aspects, and mergers & acquisitions (M&A) activity. We delve into the market share held by key players such as Eventxtra, Zoom Video Communications Inc, Cvent Inc, George P Johnson, Cisco Systems Inc, 6Connex International sp z o o, GES, Alive Events Agency, Avaya LLC, Arkadin Cloud Communications, and ALE International (list not exhaustive). The analysis reveals a moderately concentrated market with significant opportunities for both established players and new entrants.
- Market Concentration: The market is characterized by a mix of large established players and smaller, specialized providers. The top five players hold an estimated xx% market share in 2025.
- Innovation Drivers: Technological advancements in areas like AI, VR/AR, and improved streaming capabilities are major innovation drivers. Demand for enhanced engagement features and personalized experiences also fuels innovation.
- Regulatory Frameworks: Data privacy regulations (GDPR, CCPA) and accessibility guidelines significantly influence market practices and product development.
- Product Substitutes: Traditional in-person events and alternative online communication platforms represent potential substitutes.
- End-User Demographics: The market caters to a broad range of end-users across diverse industries, including educational institutions, enterprises, and various organizations.
- M&A Activity: The industry has witnessed significant M&A activity in recent years, with deal values exceeding $XX Million in the past five years. These activities reflect consolidation trends and strategic expansion efforts.
Virtual Event Industry Market Dynamics & Trends
This section explores the key dynamics shaping the virtual event market, including growth drivers, technological disruptions, evolving consumer preferences, and competitive dynamics. The report reveals a robust Compound Annual Growth Rate (CAGR) of xx% during the forecast period (2025-2033). Market penetration continues to rise, driven by increased adoption across various industries. The shift towards hybrid events, incorporating both virtual and in-person components, is a notable trend.
The rising adoption of virtual events is driven by factors such as cost savings, increased reach, enhanced accessibility, and improved data analytics capabilities. Competitive dynamics are characterized by ongoing innovation, strategic partnerships, and acquisitions.
Dominant Regions & Segments in Virtual Event Industry
This section identifies the leading regions and segments within the virtual event industry. North America and Europe currently hold the largest market shares, driven by robust technological infrastructure, high internet penetration, and strong demand across diverse sectors. However, the Asia-Pacific region exhibits significant growth potential.
- Leading Regions: North America and Europe represent the largest markets due to high technological adoption rates and established event infrastructure.
- Service Type: The demand for sales & marketing and training events is high, driven by the cost-effectiveness and scalability of virtual events.
- Application: Conferences and summits are currently dominant applications, but exhibitions/trade shows are seeing notable growth due to technological advancements.
- End-User Industry: The enterprise segment constitutes the largest end-user segment. However, the educational institutions sector is witnessing significant growth.
- Key Drivers: Robust IT infrastructure, government support for digital transformation, and high internet penetration are key regional growth drivers.
Virtual Event Industry Product Innovations
Recent product innovations focus on enhancing user engagement and experience through features like interactive elements, advanced analytics, and immersive technologies such as VR/AR. The integration of AI for personalized experiences and improved event management tools is a key trend. The market shows a strong preference for platforms that offer seamless integration with other tools and cater to various user needs.
Report Scope & Segmentation Analysis
The report segments the virtual event market based on service type (Communication, Recruitment, Sales & Marketing, Training), application (Conferences, Exhibitions/Trade Shows, Summits, Others), and end-user industry (Educational Institutions, Enterprise, Organizations, Other End-User Industries). Each segment's growth projections, market size estimates, and competitive dynamics are detailed. Growth projections vary significantly across segments, with Sales & Marketing and Training showing particularly strong growth.
Key Drivers of Virtual Event Industry Growth
The virtual event industry's growth is propelled by technological advancements (e.g., improved video conferencing, VR/AR), cost-effectiveness compared to physical events, increased reach and accessibility, and the growing adoption of hybrid event models. Favorable government policies supporting digital transformation and a rising demand for efficient, scalable event solutions further contribute to growth.
Challenges in the Virtual Event Industry Sector
Challenges include ensuring attendee engagement, overcoming technological limitations, addressing cybersecurity concerns, maintaining consistent internet connectivity, and navigating data privacy regulations. These issues affect event quality, cost, and participant experience, impacting market growth. Competitor pressures also create challenges for smaller vendors.
Emerging Opportunities in Virtual Event Industry
Emerging opportunities lie in the integration of metaverse technologies, the expansion into niche markets (e.g., virtual career fairs, virtual trade missions), and the development of innovative event formats that leverage AI and machine learning for improved personalization and engagement. The growth of hybrid event models also presents substantial opportunity.
Leading Players in the Virtual Event Industry Market
- Eventxtra
- Zoom Video Communications Inc
- Cvent Inc
- George P Johnson
- Cisco Systems Inc
- 6Connex International sp z o o
- GES
- Alive Events Agency
- Avaya LLC
- Arkadin Cloud Communications
- ALE International
Key Developments in Virtual Event Industry
- October 2022: Zoom launched 'Zoom Events' in India, enhancing virtual event capabilities.
- May 2023: VOSMOS launched VOSMOS.Events, a platform for user-created virtual events, expanding market accessibility.
Future Outlook for Virtual Event Industry Market
The virtual event industry is poised for continued expansion, driven by technological innovation, increased adoption across various sectors, and the rise of hybrid event models. Strategic partnerships, investments in emerging technologies, and focus on enhanced user experiences will be crucial for success in this dynamic market. Market projections point to a sustained high growth trajectory throughout the forecast period.
Virtual Event Industry Segmentation
-
1. Service Type
- 1.1. Communication
- 1.2. Recruitment
- 1.3. Sales and Marketing
- 1.4. Training
-
2. Application
- 2.1. Conferences
- 2.2. Exhibitions/Trade Shows
- 2.3. Summits
- 2.4. Other Applications
-
3. End-User Industry
- 3.1. Educational Institutions
- 3.2. Enterprise
- 3.3. Organizations
- 3.4. Other End-User Industries
Virtual Event Industry Segmentation By Geography
- 1. North America
- 2. Europe
- 3. Asia
- 4. Australia and New Zealand
- 5. Latin America
- 6. Middle East and Africa
Virtual Event Industry REPORT HIGHLIGHTS
| Aspects | Details |
|---|---|
| Study Period | 2019-2033 |
| Base Year | 2024 |
| Estimated Year | 2025 |
| Forecast Period | 2025-2033 |
| Historical Period | 2019-2024 |
| Growth Rate | CAGR of 24.92% from 2019-2033 |
| Segmentation |
|
Table of Contents
- 1. Introduction
- 1.1. Research Scope
- 1.2. Market Segmentation
- 1.3. Research Methodology
- 1.4. Definitions and Assumptions
- 2. Executive Summary
- 2.1. Introduction
- 3. Market Dynamics
- 3.1. Introduction
- 3.2. Market Drivers
- 3.2.1 Technology Advancements such as Growing Acceptance of Unified Communication as a Service (UCAAS)
- 3.2.2 VR
- 3.2.3 etc.; Increased Frequency of Business Events; Global Reach
- 3.2.4 Accessibility
- 3.2.5 and Cost Efficiency
- 3.3. Market Restrains
- 3.3.1. Data Security and Privacy Issues; Technology Constraints and Experiential Limitations
- 3.4. Market Trends
- 3.4.1. Increased Frequency of Business Events may Drive the Market Growth
- 4. Market Factor Analysis
- 4.1. Porters Five Forces
- 4.2. Supply/Value Chain
- 4.3. PESTEL analysis
- 4.4. Market Entropy
- 4.5. Patent/Trademark Analysis
- 5. Global Virtual Event Industry Analysis, Insights and Forecast, 2019-2031
- 5.1. Market Analysis, Insights and Forecast - by Service Type
- 5.1.1. Communication
- 5.1.2. Recruitment
- 5.1.3. Sales and Marketing
- 5.1.4. Training
- 5.2. Market Analysis, Insights and Forecast - by Application
- 5.2.1. Conferences
- 5.2.2. Exhibitions/Trade Shows
- 5.2.3. Summits
- 5.2.4. Other Applications
- 5.3. Market Analysis, Insights and Forecast - by End-User Industry
- 5.3.1. Educational Institutions
- 5.3.2. Enterprise
- 5.3.3. Organizations
- 5.3.4. Other End-User Industries
- 5.4. Market Analysis, Insights and Forecast - by Region
- 5.4.1. North America
- 5.4.2. Europe
- 5.4.3. Asia
- 5.4.4. Australia and New Zealand
- 5.4.5. Latin America
- 5.4.6. Middle East and Africa
- 5.1. Market Analysis, Insights and Forecast - by Service Type
- 6. North America Virtual Event Industry Analysis, Insights and Forecast, 2019-2031
- 6.1. Market Analysis, Insights and Forecast - by Service Type
- 6.1.1. Communication
- 6.1.2. Recruitment
- 6.1.3. Sales and Marketing
- 6.1.4. Training
- 6.2. Market Analysis, Insights and Forecast - by Application
- 6.2.1. Conferences
- 6.2.2. Exhibitions/Trade Shows
- 6.2.3. Summits
- 6.2.4. Other Applications
- 6.3. Market Analysis, Insights and Forecast - by End-User Industry
- 6.3.1. Educational Institutions
- 6.3.2. Enterprise
- 6.3.3. Organizations
- 6.3.4. Other End-User Industries
- 6.1. Market Analysis, Insights and Forecast - by Service Type
- 7. Europe Virtual Event Industry Analysis, Insights and Forecast, 2019-2031
- 7.1. Market Analysis, Insights and Forecast - by Service Type
- 7.1.1. Communication
- 7.1.2. Recruitment
- 7.1.3. Sales and Marketing
- 7.1.4. Training
- 7.2. Market Analysis, Insights and Forecast - by Application
- 7.2.1. Conferences
- 7.2.2. Exhibitions/Trade Shows
- 7.2.3. Summits
- 7.2.4. Other Applications
- 7.3. Market Analysis, Insights and Forecast - by End-User Industry
- 7.3.1. Educational Institutions
- 7.3.2. Enterprise
- 7.3.3. Organizations
- 7.3.4. Other End-User Industries
- 7.1. Market Analysis, Insights and Forecast - by Service Type
- 8. Asia Virtual Event Industry Analysis, Insights and Forecast, 2019-2031
- 8.1. Market Analysis, Insights and Forecast - by Service Type
- 8.1.1. Communication
- 8.1.2. Recruitment
- 8.1.3. Sales and Marketing
- 8.1.4. Training
- 8.2. Market Analysis, Insights and Forecast - by Application
- 8.2.1. Conferences
- 8.2.2. Exhibitions/Trade Shows
- 8.2.3. Summits
- 8.2.4. Other Applications
- 8.3. Market Analysis, Insights and Forecast - by End-User Industry
- 8.3.1. Educational Institutions
- 8.3.2. Enterprise
- 8.3.3. Organizations
- 8.3.4. Other End-User Industries
- 8.1. Market Analysis, Insights and Forecast - by Service Type
- 9. Australia and New Zealand Virtual Event Industry Analysis, Insights and Forecast, 2019-2031
- 9.1. Market Analysis, Insights and Forecast - by Service Type
- 9.1.1. Communication
- 9.1.2. Recruitment
- 9.1.3. Sales and Marketing
- 9.1.4. Training
- 9.2. Market Analysis, Insights and Forecast - by Application
- 9.2.1. Conferences
- 9.2.2. Exhibitions/Trade Shows
- 9.2.3. Summits
- 9.2.4. Other Applications
- 9.3. Market Analysis, Insights and Forecast - by End-User Industry
- 9.3.1. Educational Institutions
- 9.3.2. Enterprise
- 9.3.3. Organizations
- 9.3.4. Other End-User Industries
- 9.1. Market Analysis, Insights and Forecast - by Service Type
- 10. Latin America Virtual Event Industry Analysis, Insights and Forecast, 2019-2031
- 10.1. Market Analysis, Insights and Forecast - by Service Type
- 10.1.1. Communication
- 10.1.2. Recruitment
- 10.1.3. Sales and Marketing
- 10.1.4. Training
- 10.2. Market Analysis, Insights and Forecast - by Application
- 10.2.1. Conferences
- 10.2.2. Exhibitions/Trade Shows
- 10.2.3. Summits
- 10.2.4. Other Applications
- 10.3. Market Analysis, Insights and Forecast - by End-User Industry
- 10.3.1. Educational Institutions
- 10.3.2. Enterprise
- 10.3.3. Organizations
- 10.3.4. Other End-User Industries
- 10.1. Market Analysis, Insights and Forecast - by Service Type
- 11. Middle East and Africa Virtual Event Industry Analysis, Insights and Forecast, 2019-2031
- 11.1. Market Analysis, Insights and Forecast - by Service Type
- 11.1.1. Communication
- 11.1.2. Recruitment
- 11.1.3. Sales and Marketing
- 11.1.4. Training
- 11.2. Market Analysis, Insights and Forecast - by Application
- 11.2.1. Conferences
- 11.2.2. Exhibitions/Trade Shows
- 11.2.3. Summits
- 11.2.4. Other Applications
- 11.3. Market Analysis, Insights and Forecast - by End-User Industry
- 11.3.1. Educational Institutions
- 11.3.2. Enterprise
- 11.3.3. Organizations
- 11.3.4. Other End-User Industries
- 11.1. Market Analysis, Insights and Forecast - by Service Type
- 12. North America Virtual Event Industry Analysis, Insights and Forecast, 2019-2031
- 12.1. Market Analysis, Insights and Forecast - By Country/Sub-region
- 12.1.1 United States
- 12.1.2 Canada
- 12.1.3 Mexico
- 13. Europe Virtual Event Industry Analysis, Insights and Forecast, 2019-2031
- 13.1. Market Analysis, Insights and Forecast - By Country/Sub-region
- 13.1.1 Germany
- 13.1.2 United Kingdom
- 13.1.3 France
- 13.1.4 Spain
- 13.1.5 Italy
- 13.1.6 Spain
- 13.1.7 Belgium
- 13.1.8 Netherland
- 13.1.9 Nordics
- 13.1.10 Rest of Europe
- 14. Asia Pacific Virtual Event Industry Analysis, Insights and Forecast, 2019-2031
- 14.1. Market Analysis, Insights and Forecast - By Country/Sub-region
- 14.1.1 China
- 14.1.2 Japan
- 14.1.3 India
- 14.1.4 South Korea
- 14.1.5 Southeast Asia
- 14.1.6 Australia
- 14.1.7 Indonesia
- 14.1.8 Phillipes
- 14.1.9 Singapore
- 14.1.10 Thailandc
- 14.1.11 Rest of Asia Pacific
- 15. South America Virtual Event Industry Analysis, Insights and Forecast, 2019-2031
- 15.1. Market Analysis, Insights and Forecast - By Country/Sub-region
- 15.1.1 Brazil
- 15.1.2 Argentina
- 15.1.3 Peru
- 15.1.4 Chile
- 15.1.5 Colombia
- 15.1.6 Ecuador
- 15.1.7 Venezuela
- 15.1.8 Rest of South America
- 16. North America Virtual Event Industry Analysis, Insights and Forecast, 2019-2031
- 16.1. Market Analysis, Insights and Forecast - By Country/Sub-region
- 16.1.1 United States
- 16.1.2 Canada
- 16.1.3 Mexico
- 17. MEA Virtual Event Industry Analysis, Insights and Forecast, 2019-2031
- 17.1. Market Analysis, Insights and Forecast - By Country/Sub-region
- 17.1.1 United Arab Emirates
- 17.1.2 Saudi Arabia
- 17.1.3 South Africa
- 17.1.4 Rest of Middle East and Africa
- 18. Competitive Analysis
- 18.1. Global Market Share Analysis 2024
- 18.2. Company Profiles
- 18.2.1 Eventxtra
- 18.2.1.1. Overview
- 18.2.1.2. Products
- 18.2.1.3. SWOT Analysis
- 18.2.1.4. Recent Developments
- 18.2.1.5. Financials (Based on Availability)
- 18.2.2 Zoom Video Communications Inc
- 18.2.2.1. Overview
- 18.2.2.2. Products
- 18.2.2.3. SWOT Analysis
- 18.2.2.4. Recent Developments
- 18.2.2.5. Financials (Based on Availability)
- 18.2.3 Cvent Inc
- 18.2.3.1. Overview
- 18.2.3.2. Products
- 18.2.3.3. SWOT Analysis
- 18.2.3.4. Recent Developments
- 18.2.3.5. Financials (Based on Availability)
- 18.2.4 George P Johnson
- 18.2.4.1. Overview
- 18.2.4.2. Products
- 18.2.4.3. SWOT Analysis
- 18.2.4.4. Recent Developments
- 18.2.4.5. Financials (Based on Availability)
- 18.2.5 Cisco Systems Inc
- 18.2.5.1. Overview
- 18.2.5.2. Products
- 18.2.5.3. SWOT Analysis
- 18.2.5.4. Recent Developments
- 18.2.5.5. Financials (Based on Availability)
- 18.2.6 6Connex International sp z o o
- 18.2.6.1. Overview
- 18.2.6.2. Products
- 18.2.6.3. SWOT Analysis
- 18.2.6.4. Recent Developments
- 18.2.6.5. Financials (Based on Availability)
- 18.2.7 GES*List Not Exhaustive
- 18.2.7.1. Overview
- 18.2.7.2. Products
- 18.2.7.3. SWOT Analysis
- 18.2.7.4. Recent Developments
- 18.2.7.5. Financials (Based on Availability)
- 18.2.8 Alive Events Agency
- 18.2.8.1. Overview
- 18.2.8.2. Products
- 18.2.8.3. SWOT Analysis
- 18.2.8.4. Recent Developments
- 18.2.8.5. Financials (Based on Availability)
- 18.2.9 Avaya LLC
- 18.2.9.1. Overview
- 18.2.9.2. Products
- 18.2.9.3. SWOT Analysis
- 18.2.9.4. Recent Developments
- 18.2.9.5. Financials (Based on Availability)
- 18.2.10 Arkadin Cloud Communications
- 18.2.10.1. Overview
- 18.2.10.2. Products
- 18.2.10.3. SWOT Analysis
- 18.2.10.4. Recent Developments
- 18.2.10.5. Financials (Based on Availability)
- 18.2.11 ALE International
- 18.2.11.1. Overview
- 18.2.11.2. Products
- 18.2.11.3. SWOT Analysis
- 18.2.11.4. Recent Developments
- 18.2.11.5. Financials (Based on Availability)
- 18.2.1 Eventxtra
List of Figures
- Figure 1: Global Virtual Event Industry Revenue Breakdown (Million, %) by Region 2024 & 2032
- Figure 2: North America Virtual Event Industry Revenue (Million), by Country 2024 & 2032
- Figure 3: North America Virtual Event Industry Revenue Share (%), by Country 2024 & 2032
- Figure 4: Europe Virtual Event Industry Revenue (Million), by Country 2024 & 2032
- Figure 5: Europe Virtual Event Industry Revenue Share (%), by Country 2024 & 2032
- Figure 6: Asia Pacific Virtual Event Industry Revenue (Million), by Country 2024 & 2032
- Figure 7: Asia Pacific Virtual Event Industry Revenue Share (%), by Country 2024 & 2032
- Figure 8: South America Virtual Event Industry Revenue (Million), by Country 2024 & 2032
- Figure 9: South America Virtual Event Industry Revenue Share (%), by Country 2024 & 2032
- Figure 10: North America Virtual Event Industry Revenue (Million), by Country 2024 & 2032
- Figure 11: North America Virtual Event Industry Revenue Share (%), by Country 2024 & 2032
- Figure 12: MEA Virtual Event Industry Revenue (Million), by Country 2024 & 2032
- Figure 13: MEA Virtual Event Industry Revenue Share (%), by Country 2024 & 2032
- Figure 14: North America Virtual Event Industry Revenue (Million), by Service Type 2024 & 2032
- Figure 15: North America Virtual Event Industry Revenue Share (%), by Service Type 2024 & 2032
- Figure 16: North America Virtual Event Industry Revenue (Million), by Application 2024 & 2032
- Figure 17: North America Virtual Event Industry Revenue Share (%), by Application 2024 & 2032
- Figure 18: North America Virtual Event Industry Revenue (Million), by End-User Industry 2024 & 2032
- Figure 19: North America Virtual Event Industry Revenue Share (%), by End-User Industry 2024 & 2032
- Figure 20: North America Virtual Event Industry Revenue (Million), by Country 2024 & 2032
- Figure 21: North America Virtual Event Industry Revenue Share (%), by Country 2024 & 2032
- Figure 22: Europe Virtual Event Industry Revenue (Million), by Service Type 2024 & 2032
- Figure 23: Europe Virtual Event Industry Revenue Share (%), by Service Type 2024 & 2032
- Figure 24: Europe Virtual Event Industry Revenue (Million), by Application 2024 & 2032
- Figure 25: Europe Virtual Event Industry Revenue Share (%), by Application 2024 & 2032
- Figure 26: Europe Virtual Event Industry Revenue (Million), by End-User Industry 2024 & 2032
- Figure 27: Europe Virtual Event Industry Revenue Share (%), by End-User Industry 2024 & 2032
- Figure 28: Europe Virtual Event Industry Revenue (Million), by Country 2024 & 2032
- Figure 29: Europe Virtual Event Industry Revenue Share (%), by Country 2024 & 2032
- Figure 30: Asia Virtual Event Industry Revenue (Million), by Service Type 2024 & 2032
- Figure 31: Asia Virtual Event Industry Revenue Share (%), by Service Type 2024 & 2032
- Figure 32: Asia Virtual Event Industry Revenue (Million), by Application 2024 & 2032
- Figure 33: Asia Virtual Event Industry Revenue Share (%), by Application 2024 & 2032
- Figure 34: Asia Virtual Event Industry Revenue (Million), by End-User Industry 2024 & 2032
- Figure 35: Asia Virtual Event Industry Revenue Share (%), by End-User Industry 2024 & 2032
- Figure 36: Asia Virtual Event Industry Revenue (Million), by Country 2024 & 2032
- Figure 37: Asia Virtual Event Industry Revenue Share (%), by Country 2024 & 2032
- Figure 38: Australia and New Zealand Virtual Event Industry Revenue (Million), by Service Type 2024 & 2032
- Figure 39: Australia and New Zealand Virtual Event Industry Revenue Share (%), by Service Type 2024 & 2032
- Figure 40: Australia and New Zealand Virtual Event Industry Revenue (Million), by Application 2024 & 2032
- Figure 41: Australia and New Zealand Virtual Event Industry Revenue Share (%), by Application 2024 & 2032
- Figure 42: Australia and New Zealand Virtual Event Industry Revenue (Million), by End-User Industry 2024 & 2032
- Figure 43: Australia and New Zealand Virtual Event Industry Revenue Share (%), by End-User Industry 2024 & 2032
- Figure 44: Australia and New Zealand Virtual Event Industry Revenue (Million), by Country 2024 & 2032
- Figure 45: Australia and New Zealand Virtual Event Industry Revenue Share (%), by Country 2024 & 2032
- Figure 46: Latin America Virtual Event Industry Revenue (Million), by Service Type 2024 & 2032
- Figure 47: Latin America Virtual Event Industry Revenue Share (%), by Service Type 2024 & 2032
- Figure 48: Latin America Virtual Event Industry Revenue (Million), by Application 2024 & 2032
- Figure 49: Latin America Virtual Event Industry Revenue Share (%), by Application 2024 & 2032
- Figure 50: Latin America Virtual Event Industry Revenue (Million), by End-User Industry 2024 & 2032
- Figure 51: Latin America Virtual Event Industry Revenue Share (%), by End-User Industry 2024 & 2032
- Figure 52: Latin America Virtual Event Industry Revenue (Million), by Country 2024 & 2032
- Figure 53: Latin America Virtual Event Industry Revenue Share (%), by Country 2024 & 2032
- Figure 54: Middle East and Africa Virtual Event Industry Revenue (Million), by Service Type 2024 & 2032
- Figure 55: Middle East and Africa Virtual Event Industry Revenue Share (%), by Service Type 2024 & 2032
- Figure 56: Middle East and Africa Virtual Event Industry Revenue (Million), by Application 2024 & 2032
- Figure 57: Middle East and Africa Virtual Event Industry Revenue Share (%), by Application 2024 & 2032
- Figure 58: Middle East and Africa Virtual Event Industry Revenue (Million), by End-User Industry 2024 & 2032
- Figure 59: Middle East and Africa Virtual Event Industry Revenue Share (%), by End-User Industry 2024 & 2032
- Figure 60: Middle East and Africa Virtual Event Industry Revenue (Million), by Country 2024 & 2032
- Figure 61: Middle East and Africa Virtual Event Industry Revenue Share (%), by Country 2024 & 2032
List of Tables
- Table 1: Global Virtual Event Industry Revenue Million Forecast, by Region 2019 & 2032
- Table 2: Global Virtual Event Industry Revenue Million Forecast, by Service Type 2019 & 2032
- Table 3: Global Virtual Event Industry Revenue Million Forecast, by Application 2019 & 2032
- Table 4: Global Virtual Event Industry Revenue Million Forecast, by End-User Industry 2019 & 2032
- Table 5: Global Virtual Event Industry Revenue Million Forecast, by Region 2019 & 2032
- Table 6: Global Virtual Event Industry Revenue Million Forecast, by Country 2019 & 2032
- Table 7: United States Virtual Event Industry Revenue (Million) Forecast, by Application 2019 & 2032
- Table 8: Canada Virtual Event Industry Revenue (Million) Forecast, by Application 2019 & 2032
- Table 9: Mexico Virtual Event Industry Revenue (Million) Forecast, by Application 2019 & 2032
- Table 10: Global Virtual Event Industry Revenue Million Forecast, by Country 2019 & 2032
- Table 11: Germany Virtual Event Industry Revenue (Million) Forecast, by Application 2019 & 2032
- Table 12: United Kingdom Virtual Event Industry Revenue (Million) Forecast, by Application 2019 & 2032
- Table 13: France Virtual Event Industry Revenue (Million) Forecast, by Application 2019 & 2032
- Table 14: Spain Virtual Event Industry Revenue (Million) Forecast, by Application 2019 & 2032
- Table 15: Italy Virtual Event Industry Revenue (Million) Forecast, by Application 2019 & 2032
- Table 16: Spain Virtual Event Industry Revenue (Million) Forecast, by Application 2019 & 2032
- Table 17: Belgium Virtual Event Industry Revenue (Million) Forecast, by Application 2019 & 2032
- Table 18: Netherland Virtual Event Industry Revenue (Million) Forecast, by Application 2019 & 2032
- Table 19: Nordics Virtual Event Industry Revenue (Million) Forecast, by Application 2019 & 2032
- Table 20: Rest of Europe Virtual Event Industry Revenue (Million) Forecast, by Application 2019 & 2032
- Table 21: Global Virtual Event Industry Revenue Million Forecast, by Country 2019 & 2032
- Table 22: China Virtual Event Industry Revenue (Million) Forecast, by Application 2019 & 2032
- Table 23: Japan Virtual Event Industry Revenue (Million) Forecast, by Application 2019 & 2032
- Table 24: India Virtual Event Industry Revenue (Million) Forecast, by Application 2019 & 2032
- Table 25: South Korea Virtual Event Industry Revenue (Million) Forecast, by Application 2019 & 2032
- Table 26: Southeast Asia Virtual Event Industry Revenue (Million) Forecast, by Application 2019 & 2032
- Table 27: Australia Virtual Event Industry Revenue (Million) Forecast, by Application 2019 & 2032
- Table 28: Indonesia Virtual Event Industry Revenue (Million) Forecast, by Application 2019 & 2032
- Table 29: Phillipes Virtual Event Industry Revenue (Million) Forecast, by Application 2019 & 2032
- Table 30: Singapore Virtual Event Industry Revenue (Million) Forecast, by Application 2019 & 2032
- Table 31: Thailandc Virtual Event Industry Revenue (Million) Forecast, by Application 2019 & 2032
- Table 32: Rest of Asia Pacific Virtual Event Industry Revenue (Million) Forecast, by Application 2019 & 2032
- Table 33: Global Virtual Event Industry Revenue Million Forecast, by Country 2019 & 2032
- Table 34: Brazil Virtual Event Industry Revenue (Million) Forecast, by Application 2019 & 2032
- Table 35: Argentina Virtual Event Industry Revenue (Million) Forecast, by Application 2019 & 2032
- Table 36: Peru Virtual Event Industry Revenue (Million) Forecast, by Application 2019 & 2032
- Table 37: Chile Virtual Event Industry Revenue (Million) Forecast, by Application 2019 & 2032
- Table 38: Colombia Virtual Event Industry Revenue (Million) Forecast, by Application 2019 & 2032
- Table 39: Ecuador Virtual Event Industry Revenue (Million) Forecast, by Application 2019 & 2032
- Table 40: Venezuela Virtual Event Industry Revenue (Million) Forecast, by Application 2019 & 2032
- Table 41: Rest of South America Virtual Event Industry Revenue (Million) Forecast, by Application 2019 & 2032
- Table 42: Global Virtual Event Industry Revenue Million Forecast, by Country 2019 & 2032
- Table 43: United States Virtual Event Industry Revenue (Million) Forecast, by Application 2019 & 2032
- Table 44: Canada Virtual Event Industry Revenue (Million) Forecast, by Application 2019 & 2032
- Table 45: Mexico Virtual Event Industry Revenue (Million) Forecast, by Application 2019 & 2032
- Table 46: Global Virtual Event Industry Revenue Million Forecast, by Country 2019 & 2032
- Table 47: United Arab Emirates Virtual Event Industry Revenue (Million) Forecast, by Application 2019 & 2032
- Table 48: Saudi Arabia Virtual Event Industry Revenue (Million) Forecast, by Application 2019 & 2032
- Table 49: South Africa Virtual Event Industry Revenue (Million) Forecast, by Application 2019 & 2032
- Table 50: Rest of Middle East and Africa Virtual Event Industry Revenue (Million) Forecast, by Application 2019 & 2032
- Table 51: Global Virtual Event Industry Revenue Million Forecast, by Service Type 2019 & 2032
- Table 52: Global Virtual Event Industry Revenue Million Forecast, by Application 2019 & 2032
- Table 53: Global Virtual Event Industry Revenue Million Forecast, by End-User Industry 2019 & 2032
- Table 54: Global Virtual Event Industry Revenue Million Forecast, by Country 2019 & 2032
- Table 55: Global Virtual Event Industry Revenue Million Forecast, by Service Type 2019 & 2032
- Table 56: Global Virtual Event Industry Revenue Million Forecast, by Application 2019 & 2032
- Table 57: Global Virtual Event Industry Revenue Million Forecast, by End-User Industry 2019 & 2032
- Table 58: Global Virtual Event Industry Revenue Million Forecast, by Country 2019 & 2032
- Table 59: Global Virtual Event Industry Revenue Million Forecast, by Service Type 2019 & 2032
- Table 60: Global Virtual Event Industry Revenue Million Forecast, by Application 2019 & 2032
- Table 61: Global Virtual Event Industry Revenue Million Forecast, by End-User Industry 2019 & 2032
- Table 62: Global Virtual Event Industry Revenue Million Forecast, by Country 2019 & 2032
- Table 63: Global Virtual Event Industry Revenue Million Forecast, by Service Type 2019 & 2032
- Table 64: Global Virtual Event Industry Revenue Million Forecast, by Application 2019 & 2032
- Table 65: Global Virtual Event Industry Revenue Million Forecast, by End-User Industry 2019 & 2032
- Table 66: Global Virtual Event Industry Revenue Million Forecast, by Country 2019 & 2032
- Table 67: Global Virtual Event Industry Revenue Million Forecast, by Service Type 2019 & 2032
- Table 68: Global Virtual Event Industry Revenue Million Forecast, by Application 2019 & 2032
- Table 69: Global Virtual Event Industry Revenue Million Forecast, by End-User Industry 2019 & 2032
- Table 70: Global Virtual Event Industry Revenue Million Forecast, by Country 2019 & 2032
- Table 71: Global Virtual Event Industry Revenue Million Forecast, by Service Type 2019 & 2032
- Table 72: Global Virtual Event Industry Revenue Million Forecast, by Application 2019 & 2032
- Table 73: Global Virtual Event Industry Revenue Million Forecast, by End-User Industry 2019 & 2032
- Table 74: Global Virtual Event Industry Revenue Million Forecast, by Country 2019 & 2032
Frequently Asked Questions
1. What is the projected Compound Annual Growth Rate (CAGR) of the Virtual Event Industry?
The projected CAGR is approximately 24.92%.
2. Which companies are prominent players in the Virtual Event Industry?
Key companies in the market include Eventxtra, Zoom Video Communications Inc, Cvent Inc, George P Johnson, Cisco Systems Inc, 6Connex International sp z o o, GES*List Not Exhaustive, Alive Events Agency, Avaya LLC, Arkadin Cloud Communications, ALE International.
3. What are the main segments of the Virtual Event Industry?
The market segments include Service Type, Application, End-User Industry.
4. Can you provide details about the market size?
The market size is estimated to be USD 216.12 Million as of 2022.
5. What are some drivers contributing to market growth?
Technology Advancements such as Growing Acceptance of Unified Communication as a Service (UCAAS). VR. etc.; Increased Frequency of Business Events; Global Reach. Accessibility. and Cost Efficiency.
6. What are the notable trends driving market growth?
Increased Frequency of Business Events may Drive the Market Growth.
7. Are there any restraints impacting market growth?
Data Security and Privacy Issues; Technology Constraints and Experiential Limitations.
8. Can you provide examples of recent developments in the market?
May 2023: Tech startup VOSMOS, which focuses on the metaverse and virtual experiences, has introduced VOSMOS. Events, a platform for user-created virtual events Individuals and organizations may organize dynamic, secure virtual events of any size with the help of VOSMOS.Events. The offering, created by the Indian company VOSMOS, provides a subscription-based business model and allows customers to conduct virtual events with anywhere between 100 and more than 1 lakh participants.
9. What pricing options are available for accessing the report?
Pricing options include single-user, multi-user, and enterprise licenses priced at USD 4750, USD 5250, and USD 8750 respectively.
10. Is the market size provided in terms of value or volume?
The market size is provided in terms of value, measured in Million.
11. Are there any specific market keywords associated with the report?
Yes, the market keyword associated with the report is "Virtual Event Industry," which aids in identifying and referencing the specific market segment covered.
12. How do I determine which pricing option suits my needs best?
The pricing options vary based on user requirements and access needs. Individual users may opt for single-user licenses, while businesses requiring broader access may choose multi-user or enterprise licenses for cost-effective access to the report.
13. Are there any additional resources or data provided in the Virtual Event Industry report?
While the report offers comprehensive insights, it's advisable to review the specific contents or supplementary materials provided to ascertain if additional resources or data are available.
14. How can I stay updated on further developments or reports in the Virtual Event Industry?
To stay informed about further developments, trends, and reports in the Virtual Event Industry, consider subscribing to industry newsletters, following relevant companies and organizations, or regularly checking reputable industry news sources and publications.
Methodology
Step 1 - Identification of Relevant Samples Size from Population Database


Step 2 - Approaches for Defining Global Market Size (Value, Volume* & Price*)

Note*: In applicable scenarios
Step 3 - Data Sources
Primary Research
- Web Analytics
- Survey Reports
- Research Institute
- Latest Research Reports
- Opinion Leaders
Secondary Research
- Annual Reports
- White Paper
- Latest Press Release
- Industry Association
- Paid Database
- Investor Presentations

Step 4 - Data Triangulation
Involves using different sources of information in order to increase the validity of a study
These sources are likely to be stakeholders in a program - participants, other researchers, program staff, other community members, and so on.
Then we put all data in single framework & apply various statistical tools to find out the dynamic on the market.
During the analysis stage, feedback from the stakeholder groups would be compared to determine areas of agreement as well as areas of divergence


