
Key Insights
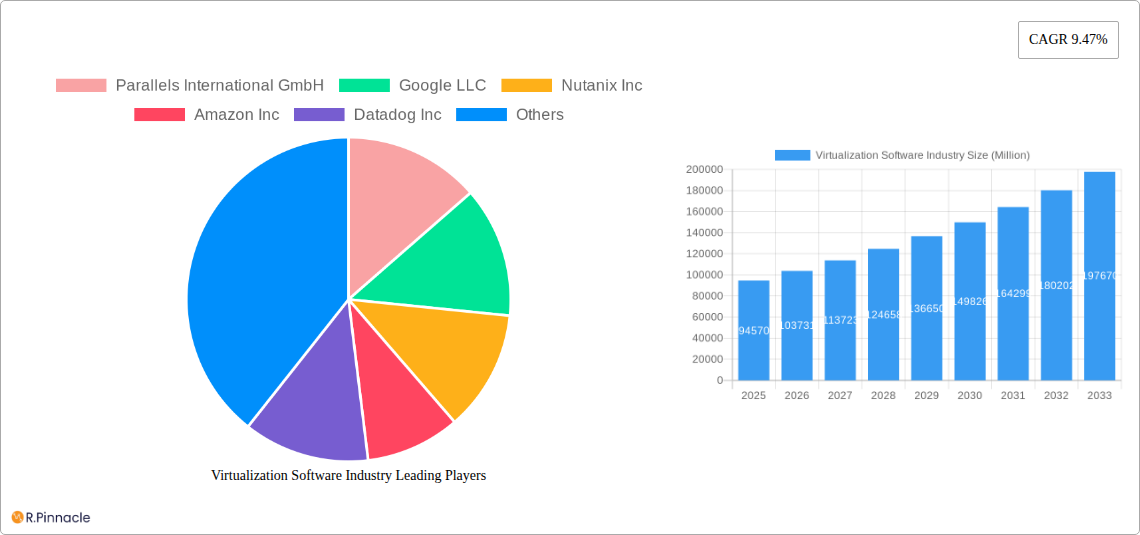
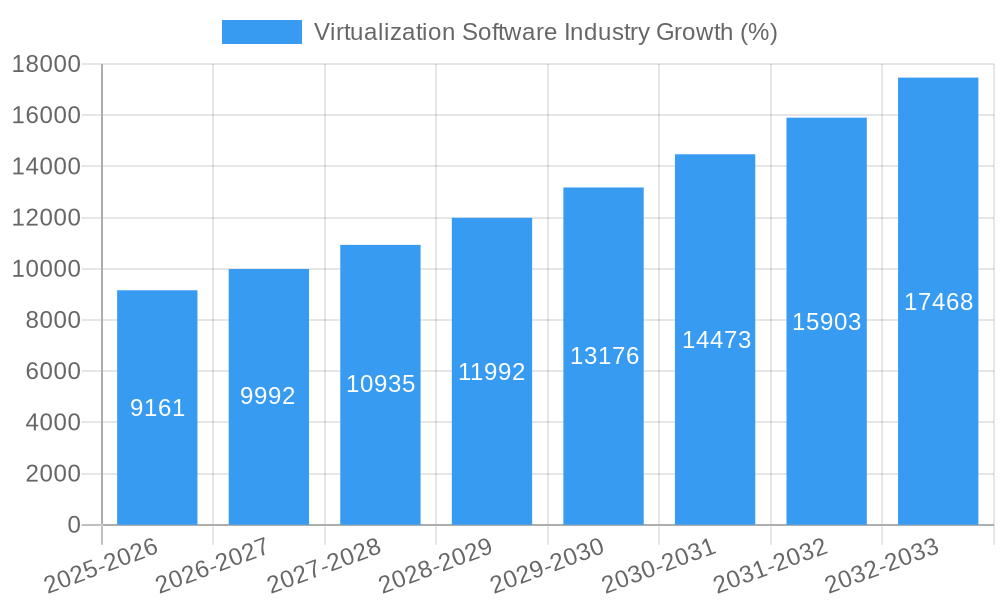
The virtualization software market, currently valued at $94.57 billion in 2025, is experiencing robust growth, projected to expand at a Compound Annual Growth Rate (CAGR) of 9.47% from 2025 to 2033. This growth is fueled by several key factors. The increasing adoption of cloud computing and the need for efficient resource management across diverse platforms are major drivers. Organizations are increasingly virtualizing their IT infrastructure to reduce costs, improve scalability, and enhance agility. Furthermore, the rise of hybrid and multi-cloud environments necessitates sophisticated virtualization solutions capable of seamless integration and management. The shift towards remote work and the growing demand for secure and accessible applications are also contributing to market expansion. Market segmentation reveals significant opportunities within application, network, and hardware virtualization, particularly within PC and mobile platforms. Leading players like VMware, Citrix, Microsoft, and Amazon Web Services are actively innovating and expanding their product portfolios to capitalize on these trends. Competition is intense, with companies focusing on providing comprehensive solutions integrating virtualization with other technologies like security and management tools. The market is also seeing the emergence of niche players specializing in specific virtualization segments, like containerization or serverless computing.
While the market enjoys substantial growth potential, certain challenges persist. Security concerns surrounding virtualized environments, the complexity of managing increasingly large and diverse virtual infrastructures, and the need for skilled professionals to implement and manage these systems represent potential restraints. However, ongoing advancements in security technologies, the development of more user-friendly management tools, and the expanding pool of trained professionals are mitigating these challenges. Looking ahead, the continued growth in data centers, the proliferation of edge computing deployments, and the increasing adoption of artificial intelligence and machine learning are likely to propel further expansion of the virtualization software market over the forecast period. This necessitates a strategic focus on innovation and adapting to the evolving technological landscape for market participants to sustain their competitiveness.
Virtualization Software Industry Market Report: 2019-2033
This comprehensive report provides a detailed analysis of the Virtualization Software Industry, offering invaluable insights for industry professionals, investors, and strategists. The report covers the period 2019-2033, with a focus on the estimated year 2025 and a forecast period of 2025-2033. This in-depth study explores market dynamics, leading players, technological advancements, and future growth potential, providing actionable intelligence for informed decision-making. The market size is projected to reach xx Million by 2033.
Virtualization Software Industry Market Structure & Innovation Trends
The virtualization software market exhibits a moderately concentrated structure, with a few dominant players holding significant market share. While VMware, Citrix, and Microsoft traditionally held large portions, the market is increasingly witnessing the emergence of strong competitors offering specialized solutions and cloud-based services. Innovation is driven primarily by the increasing demand for cloud computing, the adoption of containerization, and the need for enhanced security and scalability. Regulatory frameworks, particularly concerning data privacy and security, significantly impact market operations. Product substitutes, such as serverless computing architectures, present competitive challenges. End-user demographics span diverse industries, including IT, finance, healthcare, and education. Mergers and acquisitions (M&A) have played a significant role in shaping the market landscape. Significant M&A deals during the study period (2019-2024) involved approximately xx Million in total value, with key deals influencing market share distributions among major players.
- Market Share: VMware holds approximately xx% market share in 2025, followed by Microsoft (xx%), Citrix (xx%), and others.
- M&A Activity: Significant consolidation occurred in the historical period (2019-2024), resulting in market share shifts among major companies. The average deal value was approximately xx Million.
- Innovation Drivers: Cloud computing, containerization, 5G adoption, and AI-driven automation are key innovation drivers.
- Regulatory Impact: Compliance with GDPR, CCPA, and other data protection regulations has influenced product development and market strategies.
Virtualization Software Industry Market Dynamics & Trends
The Virtualization Software Industry demonstrates robust growth driven by several factors. The increasing adoption of cloud computing across various industries creates significant demand for virtualization solutions. The shift towards hybrid and multi-cloud environments further fuels market expansion. Technological disruptions, such as the rise of serverless computing and edge computing, offer new opportunities while posing challenges to traditional virtualization models. Consumer preferences are leaning towards integrated, secure, and scalable solutions. Competitive dynamics are characterized by intense competition, innovation, and strategic partnerships among major players. The Compound Annual Growth Rate (CAGR) is projected at xx% during the forecast period (2025-2033), driven by the increasing adoption of virtualization across several industries. Market penetration is expected to increase to xx% by 2033, particularly in emerging economies.
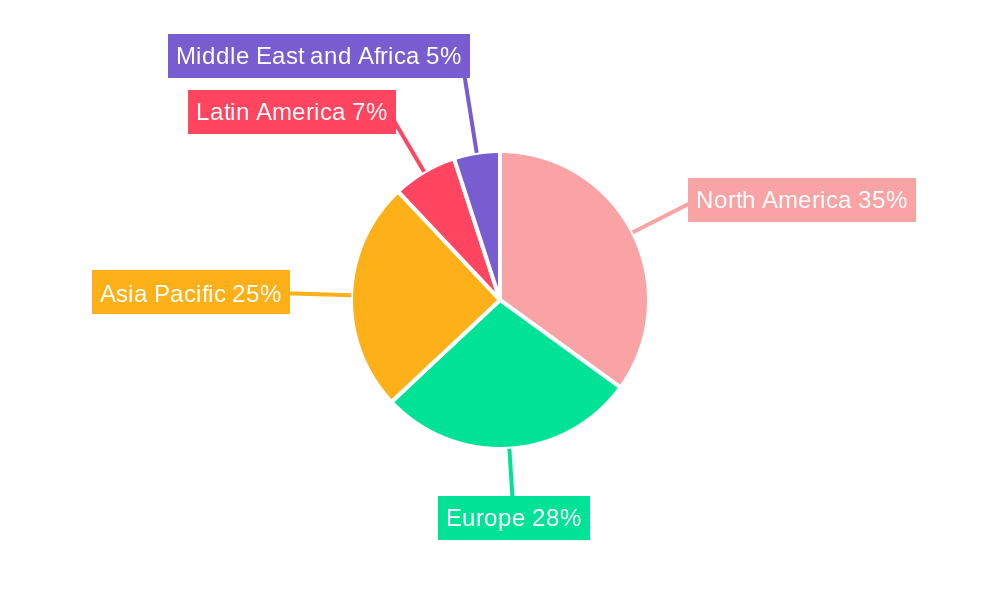
Dominant Regions & Segments in Virtualization Software Industry
North America currently holds the largest market share in the virtualization software industry, driven by strong technological advancements and high adoption rates. Within North America, the United States dominates due to its mature IT infrastructure and presence of major technology companies.
- By Platform: PC Virtualization remains the largest segment due to its widespread use in enterprise and individual computing, although Mobile Virtualization is experiencing rapid growth.
- By Type: Hardware Virtualization holds a significant share, while Application Virtualization and Network Virtualization are witnessing increased adoption due to the rise of cloud and containerized applications.
Key Drivers:
- North America: Robust IT infrastructure, high technological adoption, and a large pool of skilled professionals.
- Europe: Growing demand for cloud computing and digital transformation initiatives across various sectors.
- Asia-Pacific: Rapid economic growth, increasing IT spending, and expanding internet penetration.
Detailed dominance analysis shows North America's dominance is attributed to early adoption, strong technological capabilities, and high spending on IT infrastructure. Asia-Pacific shows considerable growth potential due to rapid digital transformation.
Virtualization Software Industry Product Innovations
Recent product innovations focus on enhancing security, scalability, and ease of management. Cloud-native virtualization solutions are gaining popularity, offering better integration with cloud platforms. AI-powered automation features are being integrated to optimize resource utilization and reduce operational costs. These innovations are enhancing market fit by addressing the growing demands for agility, efficiency, and security in modern IT environments.
Report Scope & Segmentation Analysis
This report segments the virtualization software market by platform (PC Virtualization, Mobile Virtualization) and by type (Application Virtualization, Network Virtualization, Hardware Virtualization, Other Types). Each segment’s growth projections, market size, and competitive dynamics are analyzed in detail. For example, PC Virtualization is expected to maintain steady growth, while Mobile Virtualization shows significant growth potential driven by the increasing use of smartphones and tablets. Application Virtualization is experiencing high growth owing to increased demand for application portability and scalability.
Key Drivers of Virtualization Software Industry Growth
Several factors drive the growth of the virtualization software industry. The increasing adoption of cloud computing and the rise of hybrid cloud environments are major contributors. Technological advancements, such as containerization and serverless computing, create opportunities for innovation. Government initiatives promoting digital transformation and supportive regulatory frameworks further accelerate market growth. Additionally, the rising demand for secure and scalable IT infrastructure across diverse industries significantly contributes to the overall expansion of the virtualization software market.
Challenges in the Virtualization Software Industry Sector
The virtualization software industry faces certain challenges, including the complexity of managing increasingly sophisticated virtualization environments and the high cost of implementation. Security concerns related to data breaches and vulnerabilities pose significant risks. Competition among established players and new entrants exerts pressure on pricing and margins. Supply chain disruptions can impact the availability of hardware and software components, leading to project delays and increased costs.
Emerging Opportunities in Virtualization Software Industry
Emerging opportunities lie in the growing adoption of edge computing and the expanding use of AI and machine learning in virtualization management. The Internet of Things (IoT) presents a significant growth area, requiring scalable and secure virtualization solutions. The development of new virtualization technologies for specific industry segments, such as healthcare and finance, offers attractive prospects. Expansion into emerging markets with growing digitalization presents significant market potential.
Leading Players in the Virtualization Software Industry Market
- Parallels International GmbH
- Google LLC
- Nutanix Inc
- Amazon Inc
- Datadog Inc
- Microsoft Corporation
- TenAsys Corporation
- NComupting Co Ltd
- Red Hat Inc (IBM Corporation)
- Lynx Software Technologies
- Huawei Technologies Co Ltd
- Oracle Corporation
- VMware Inc
- Citrix Systems Inc
Key Developments in Virtualization Software Industry
- October 2022: Microsoft and Meta collaborated to bring Mesh for Microsoft Teams to Meta Quest devices, enabling immersive virtual collaboration experiences. This development significantly impacts the market by enhancing remote collaboration capabilities.
- August 2022: NetApp and VMware strengthened their partnership to aid customers in multi-cloud modernization. This collaboration improves the management and scalability of virtual machines and containerized applications in multi-cloud environments.
Future Outlook for Virtualization Software Industry Market
The virtualization software market is poised for continued growth, driven by increasing cloud adoption, technological advancements, and the expanding digital transformation across various industries. The focus on security, scalability, and ease of management will continue to shape product development and drive market expansion. Emerging technologies, such as edge computing and AI-powered automation, will create further opportunities for innovation and growth. The market will witness increased competition and consolidation as players strive to establish their dominance in a rapidly evolving landscape.
Virtualization Software Industry Segmentation
-
1. Platform
- 1.1. PC Virtualization
- 1.2. Mobile Virtualization
-
2. Type
- 2.1. Application Virtualization
- 2.2. Network Virtualization
- 2.3. Hardware Virtualization
- 2.4. Other Types
Virtualization Software Industry Segmentation By Geography
- 1. North America
- 2. Europe
- 3. Asia
- 4. Australia and New Zealand
- 5. Latin America
- 6. Middle East and Africa
Virtualization Software Industry REPORT HIGHLIGHTS
| Aspects | Details |
|---|---|
| Study Period | 2019-2033 |
| Base Year | 2024 |
| Estimated Year | 2025 |
| Forecast Period | 2025-2033 |
| Historical Period | 2019-2024 |
| Growth Rate | CAGR of 9.47% from 2019-2033 |
| Segmentation |
|
Table of Contents
- 1. Introduction
- 1.1. Research Scope
- 1.2. Market Segmentation
- 1.3. Research Methodology
- 1.4. Definitions and Assumptions
- 2. Executive Summary
- 2.1. Introduction
- 3. Market Dynamics
- 3.1. Introduction
- 3.2. Market Drivers
- 3.2.1. Cost Reductions due to Reduced Hardware Spending; Improved IT Efficiency due to Virtualization
- 3.3. Market Restrains
- 3.3.1. High Initial Investment During the Deployment in the Infrastructure
- 3.4. Market Trends
- 3.4.1. PC/ Desktop Virtualization is expected to hold Major Market share
- 4. Market Factor Analysis
- 4.1. Porters Five Forces
- 4.2. Supply/Value Chain
- 4.3. PESTEL analysis
- 4.4. Market Entropy
- 4.5. Patent/Trademark Analysis
- 5. Global Virtualization Software Industry Analysis, Insights and Forecast, 2019-2031
- 5.1. Market Analysis, Insights and Forecast - by Platform
- 5.1.1. PC Virtualization
- 5.1.2. Mobile Virtualization
- 5.2. Market Analysis, Insights and Forecast - by Type
- 5.2.1. Application Virtualization
- 5.2.2. Network Virtualization
- 5.2.3. Hardware Virtualization
- 5.2.4. Other Types
- 5.3. Market Analysis, Insights and Forecast - by Region
- 5.3.1. North America
- 5.3.2. Europe
- 5.3.3. Asia
- 5.3.4. Australia and New Zealand
- 5.3.5. Latin America
- 5.3.6. Middle East and Africa
- 5.1. Market Analysis, Insights and Forecast - by Platform
- 6. North America Virtualization Software Industry Analysis, Insights and Forecast, 2019-2031
- 6.1. Market Analysis, Insights and Forecast - by Platform
- 6.1.1. PC Virtualization
- 6.1.2. Mobile Virtualization
- 6.2. Market Analysis, Insights and Forecast - by Type
- 6.2.1. Application Virtualization
- 6.2.2. Network Virtualization
- 6.2.3. Hardware Virtualization
- 6.2.4. Other Types
- 6.1. Market Analysis, Insights and Forecast - by Platform
- 7. Europe Virtualization Software Industry Analysis, Insights and Forecast, 2019-2031
- 7.1. Market Analysis, Insights and Forecast - by Platform
- 7.1.1. PC Virtualization
- 7.1.2. Mobile Virtualization
- 7.2. Market Analysis, Insights and Forecast - by Type
- 7.2.1. Application Virtualization
- 7.2.2. Network Virtualization
- 7.2.3. Hardware Virtualization
- 7.2.4. Other Types
- 7.1. Market Analysis, Insights and Forecast - by Platform
- 8. Asia Virtualization Software Industry Analysis, Insights and Forecast, 2019-2031
- 8.1. Market Analysis, Insights and Forecast - by Platform
- 8.1.1. PC Virtualization
- 8.1.2. Mobile Virtualization
- 8.2. Market Analysis, Insights and Forecast - by Type
- 8.2.1. Application Virtualization
- 8.2.2. Network Virtualization
- 8.2.3. Hardware Virtualization
- 8.2.4. Other Types
- 8.1. Market Analysis, Insights and Forecast - by Platform
- 9. Australia and New Zealand Virtualization Software Industry Analysis, Insights and Forecast, 2019-2031
- 9.1. Market Analysis, Insights and Forecast - by Platform
- 9.1.1. PC Virtualization
- 9.1.2. Mobile Virtualization
- 9.2. Market Analysis, Insights and Forecast - by Type
- 9.2.1. Application Virtualization
- 9.2.2. Network Virtualization
- 9.2.3. Hardware Virtualization
- 9.2.4. Other Types
- 9.1. Market Analysis, Insights and Forecast - by Platform
- 10. Latin America Virtualization Software Industry Analysis, Insights and Forecast, 2019-2031
- 10.1. Market Analysis, Insights and Forecast - by Platform
- 10.1.1. PC Virtualization
- 10.1.2. Mobile Virtualization
- 10.2. Market Analysis, Insights and Forecast - by Type
- 10.2.1. Application Virtualization
- 10.2.2. Network Virtualization
- 10.2.3. Hardware Virtualization
- 10.2.4. Other Types
- 10.1. Market Analysis, Insights and Forecast - by Platform
- 11. Middle East and Africa Virtualization Software Industry Analysis, Insights and Forecast, 2019-2031
- 11.1. Market Analysis, Insights and Forecast - by Platform
- 11.1.1. PC Virtualization
- 11.1.2. Mobile Virtualization
- 11.2. Market Analysis, Insights and Forecast - by Type
- 11.2.1. Application Virtualization
- 11.2.2. Network Virtualization
- 11.2.3. Hardware Virtualization
- 11.2.4. Other Types
- 11.1. Market Analysis, Insights and Forecast - by Platform
- 12. North America Virtualization Software Industry Analysis, Insights and Forecast, 2019-2031
- 12.1. Market Analysis, Insights and Forecast - By Country/Sub-region
- 12.1.1.
- 13. Europe Virtualization Software Industry Analysis, Insights and Forecast, 2019-2031
- 13.1. Market Analysis, Insights and Forecast - By Country/Sub-region
- 13.1.1.
- 14. Asia Pacific Virtualization Software Industry Analysis, Insights and Forecast, 2019-2031
- 14.1. Market Analysis, Insights and Forecast - By Country/Sub-region
- 14.1.1.
- 15. Latin America Virtualization Software Industry Analysis, Insights and Forecast, 2019-2031
- 15.1. Market Analysis, Insights and Forecast - By Country/Sub-region
- 15.1.1.
- 16. Middle East and Africa Virtualization Software Industry Analysis, Insights and Forecast, 2019-2031
- 16.1. Market Analysis, Insights and Forecast - By Country/Sub-region
- 16.1.1.
- 17. Competitive Analysis
- 17.1. Global Market Share Analysis 2024
- 17.2. Company Profiles
- 17.2.1 Parallels International GmbH
- 17.2.1.1. Overview
- 17.2.1.2. Products
- 17.2.1.3. SWOT Analysis
- 17.2.1.4. Recent Developments
- 17.2.1.5. Financials (Based on Availability)
- 17.2.2 Google LLC
- 17.2.2.1. Overview
- 17.2.2.2. Products
- 17.2.2.3. SWOT Analysis
- 17.2.2.4. Recent Developments
- 17.2.2.5. Financials (Based on Availability)
- 17.2.3 Nutanix Inc
- 17.2.3.1. Overview
- 17.2.3.2. Products
- 17.2.3.3. SWOT Analysis
- 17.2.3.4. Recent Developments
- 17.2.3.5. Financials (Based on Availability)
- 17.2.4 Amazon Inc
- 17.2.4.1. Overview
- 17.2.4.2. Products
- 17.2.4.3. SWOT Analysis
- 17.2.4.4. Recent Developments
- 17.2.4.5. Financials (Based on Availability)
- 17.2.5 Datadog Inc
- 17.2.5.1. Overview
- 17.2.5.2. Products
- 17.2.5.3. SWOT Analysis
- 17.2.5.4. Recent Developments
- 17.2.5.5. Financials (Based on Availability)
- 17.2.6 Microsoft Corporation
- 17.2.6.1. Overview
- 17.2.6.2. Products
- 17.2.6.3. SWOT Analysis
- 17.2.6.4. Recent Developments
- 17.2.6.5. Financials (Based on Availability)
- 17.2.7 TenAsys Corporation
- 17.2.7.1. Overview
- 17.2.7.2. Products
- 17.2.7.3. SWOT Analysis
- 17.2.7.4. Recent Developments
- 17.2.7.5. Financials (Based on Availability)
- 17.2.8 NComupting Co Ltd
- 17.2.8.1. Overview
- 17.2.8.2. Products
- 17.2.8.3. SWOT Analysis
- 17.2.8.4. Recent Developments
- 17.2.8.5. Financials (Based on Availability)
- 17.2.9 Red Hat Inc (IBM Corporation)
- 17.2.9.1. Overview
- 17.2.9.2. Products
- 17.2.9.3. SWOT Analysis
- 17.2.9.4. Recent Developments
- 17.2.9.5. Financials (Based on Availability)
- 17.2.10 Lynx Software Technologies*List Not Exhaustive
- 17.2.10.1. Overview
- 17.2.10.2. Products
- 17.2.10.3. SWOT Analysis
- 17.2.10.4. Recent Developments
- 17.2.10.5. Financials (Based on Availability)
- 17.2.11 Huawei Technologies Co Ltd
- 17.2.11.1. Overview
- 17.2.11.2. Products
- 17.2.11.3. SWOT Analysis
- 17.2.11.4. Recent Developments
- 17.2.11.5. Financials (Based on Availability)
- 17.2.12 Oracle Corporation
- 17.2.12.1. Overview
- 17.2.12.2. Products
- 17.2.12.3. SWOT Analysis
- 17.2.12.4. Recent Developments
- 17.2.12.5. Financials (Based on Availability)
- 17.2.13 VMware Inc
- 17.2.13.1. Overview
- 17.2.13.2. Products
- 17.2.13.3. SWOT Analysis
- 17.2.13.4. Recent Developments
- 17.2.13.5. Financials (Based on Availability)
- 17.2.14 Citrix Systems Inc
- 17.2.14.1. Overview
- 17.2.14.2. Products
- 17.2.14.3. SWOT Analysis
- 17.2.14.4. Recent Developments
- 17.2.14.5. Financials (Based on Availability)
- 17.2.1 Parallels International GmbH
List of Figures
- Figure 1: Global Virtualization Software Industry Revenue Breakdown (Million, %) by Region 2024 & 2032
- Figure 2: North America Virtualization Software Industry Revenue (Million), by Country 2024 & 2032
- Figure 3: North America Virtualization Software Industry Revenue Share (%), by Country 2024 & 2032
- Figure 4: Europe Virtualization Software Industry Revenue (Million), by Country 2024 & 2032
- Figure 5: Europe Virtualization Software Industry Revenue Share (%), by Country 2024 & 2032
- Figure 6: Asia Pacific Virtualization Software Industry Revenue (Million), by Country 2024 & 2032
- Figure 7: Asia Pacific Virtualization Software Industry Revenue Share (%), by Country 2024 & 2032
- Figure 8: Latin America Virtualization Software Industry Revenue (Million), by Country 2024 & 2032
- Figure 9: Latin America Virtualization Software Industry Revenue Share (%), by Country 2024 & 2032
- Figure 10: Middle East and Africa Virtualization Software Industry Revenue (Million), by Country 2024 & 2032
- Figure 11: Middle East and Africa Virtualization Software Industry Revenue Share (%), by Country 2024 & 2032
- Figure 12: North America Virtualization Software Industry Revenue (Million), by Platform 2024 & 2032
- Figure 13: North America Virtualization Software Industry Revenue Share (%), by Platform 2024 & 2032
- Figure 14: North America Virtualization Software Industry Revenue (Million), by Type 2024 & 2032
- Figure 15: North America Virtualization Software Industry Revenue Share (%), by Type 2024 & 2032
- Figure 16: North America Virtualization Software Industry Revenue (Million), by Country 2024 & 2032
- Figure 17: North America Virtualization Software Industry Revenue Share (%), by Country 2024 & 2032
- Figure 18: Europe Virtualization Software Industry Revenue (Million), by Platform 2024 & 2032
- Figure 19: Europe Virtualization Software Industry Revenue Share (%), by Platform 2024 & 2032
- Figure 20: Europe Virtualization Software Industry Revenue (Million), by Type 2024 & 2032
- Figure 21: Europe Virtualization Software Industry Revenue Share (%), by Type 2024 & 2032
- Figure 22: Europe Virtualization Software Industry Revenue (Million), by Country 2024 & 2032
- Figure 23: Europe Virtualization Software Industry Revenue Share (%), by Country 2024 & 2032
- Figure 24: Asia Virtualization Software Industry Revenue (Million), by Platform 2024 & 2032
- Figure 25: Asia Virtualization Software Industry Revenue Share (%), by Platform 2024 & 2032
- Figure 26: Asia Virtualization Software Industry Revenue (Million), by Type 2024 & 2032
- Figure 27: Asia Virtualization Software Industry Revenue Share (%), by Type 2024 & 2032
- Figure 28: Asia Virtualization Software Industry Revenue (Million), by Country 2024 & 2032
- Figure 29: Asia Virtualization Software Industry Revenue Share (%), by Country 2024 & 2032
- Figure 30: Australia and New Zealand Virtualization Software Industry Revenue (Million), by Platform 2024 & 2032
- Figure 31: Australia and New Zealand Virtualization Software Industry Revenue Share (%), by Platform 2024 & 2032
- Figure 32: Australia and New Zealand Virtualization Software Industry Revenue (Million), by Type 2024 & 2032
- Figure 33: Australia and New Zealand Virtualization Software Industry Revenue Share (%), by Type 2024 & 2032
- Figure 34: Australia and New Zealand Virtualization Software Industry Revenue (Million), by Country 2024 & 2032
- Figure 35: Australia and New Zealand Virtualization Software Industry Revenue Share (%), by Country 2024 & 2032
- Figure 36: Latin America Virtualization Software Industry Revenue (Million), by Platform 2024 & 2032
- Figure 37: Latin America Virtualization Software Industry Revenue Share (%), by Platform 2024 & 2032
- Figure 38: Latin America Virtualization Software Industry Revenue (Million), by Type 2024 & 2032
- Figure 39: Latin America Virtualization Software Industry Revenue Share (%), by Type 2024 & 2032
- Figure 40: Latin America Virtualization Software Industry Revenue (Million), by Country 2024 & 2032
- Figure 41: Latin America Virtualization Software Industry Revenue Share (%), by Country 2024 & 2032
- Figure 42: Middle East and Africa Virtualization Software Industry Revenue (Million), by Platform 2024 & 2032
- Figure 43: Middle East and Africa Virtualization Software Industry Revenue Share (%), by Platform 2024 & 2032
- Figure 44: Middle East and Africa Virtualization Software Industry Revenue (Million), by Type 2024 & 2032
- Figure 45: Middle East and Africa Virtualization Software Industry Revenue Share (%), by Type 2024 & 2032
- Figure 46: Middle East and Africa Virtualization Software Industry Revenue (Million), by Country 2024 & 2032
- Figure 47: Middle East and Africa Virtualization Software Industry Revenue Share (%), by Country 2024 & 2032
List of Tables
- Table 1: Global Virtualization Software Industry Revenue Million Forecast, by Region 2019 & 2032
- Table 2: Global Virtualization Software Industry Revenue Million Forecast, by Platform 2019 & 2032
- Table 3: Global Virtualization Software Industry Revenue Million Forecast, by Type 2019 & 2032
- Table 4: Global Virtualization Software Industry Revenue Million Forecast, by Region 2019 & 2032
- Table 5: Global Virtualization Software Industry Revenue Million Forecast, by Country 2019 & 2032
- Table 6: Virtualization Software Industry Revenue (Million) Forecast, by Application 2019 & 2032
- Table 7: Global Virtualization Software Industry Revenue Million Forecast, by Country 2019 & 2032
- Table 8: Virtualization Software Industry Revenue (Million) Forecast, by Application 2019 & 2032
- Table 9: Global Virtualization Software Industry Revenue Million Forecast, by Country 2019 & 2032
- Table 10: Virtualization Software Industry Revenue (Million) Forecast, by Application 2019 & 2032
- Table 11: Global Virtualization Software Industry Revenue Million Forecast, by Country 2019 & 2032
- Table 12: Virtualization Software Industry Revenue (Million) Forecast, by Application 2019 & 2032
- Table 13: Global Virtualization Software Industry Revenue Million Forecast, by Country 2019 & 2032
- Table 14: Virtualization Software Industry Revenue (Million) Forecast, by Application 2019 & 2032
- Table 15: Global Virtualization Software Industry Revenue Million Forecast, by Platform 2019 & 2032
- Table 16: Global Virtualization Software Industry Revenue Million Forecast, by Type 2019 & 2032
- Table 17: Global Virtualization Software Industry Revenue Million Forecast, by Country 2019 & 2032
- Table 18: Global Virtualization Software Industry Revenue Million Forecast, by Platform 2019 & 2032
- Table 19: Global Virtualization Software Industry Revenue Million Forecast, by Type 2019 & 2032
- Table 20: Global Virtualization Software Industry Revenue Million Forecast, by Country 2019 & 2032
- Table 21: Global Virtualization Software Industry Revenue Million Forecast, by Platform 2019 & 2032
- Table 22: Global Virtualization Software Industry Revenue Million Forecast, by Type 2019 & 2032
- Table 23: Global Virtualization Software Industry Revenue Million Forecast, by Country 2019 & 2032
- Table 24: Global Virtualization Software Industry Revenue Million Forecast, by Platform 2019 & 2032
- Table 25: Global Virtualization Software Industry Revenue Million Forecast, by Type 2019 & 2032
- Table 26: Global Virtualization Software Industry Revenue Million Forecast, by Country 2019 & 2032
- Table 27: Global Virtualization Software Industry Revenue Million Forecast, by Platform 2019 & 2032
- Table 28: Global Virtualization Software Industry Revenue Million Forecast, by Type 2019 & 2032
- Table 29: Global Virtualization Software Industry Revenue Million Forecast, by Country 2019 & 2032
- Table 30: Global Virtualization Software Industry Revenue Million Forecast, by Platform 2019 & 2032
- Table 31: Global Virtualization Software Industry Revenue Million Forecast, by Type 2019 & 2032
- Table 32: Global Virtualization Software Industry Revenue Million Forecast, by Country 2019 & 2032
Frequently Asked Questions
1. What is the projected Compound Annual Growth Rate (CAGR) of the Virtualization Software Industry?
The projected CAGR is approximately 9.47%.
2. Which companies are prominent players in the Virtualization Software Industry?
Key companies in the market include Parallels International GmbH, Google LLC, Nutanix Inc, Amazon Inc, Datadog Inc, Microsoft Corporation, TenAsys Corporation, NComupting Co Ltd, Red Hat Inc (IBM Corporation), Lynx Software Technologies*List Not Exhaustive, Huawei Technologies Co Ltd, Oracle Corporation, VMware Inc, Citrix Systems Inc.
3. What are the main segments of the Virtualization Software Industry?
The market segments include Platform, Type.
4. Can you provide details about the market size?
The market size is estimated to be USD 94.57 Million as of 2022.
5. What are some drivers contributing to market growth?
Cost Reductions due to Reduced Hardware Spending; Improved IT Efficiency due to Virtualization.
6. What are the notable trends driving market growth?
PC/ Desktop Virtualization is expected to hold Major Market share.
7. Are there any restraints impacting market growth?
High Initial Investment During the Deployment in the Infrastructure.
8. Can you provide examples of recent developments in the market?
October 2022: Microsoft and Meta collaborated to create immersive experiences for the future of work and play. As announced during Meta Connect 2022, the collaboration enabled to bring Mesh for Microsoft Teams to Meta Quest devices. It will help people gather virtually where work happens on any device such as smartphones, laptops, and mixed-reality headsets. Mesh for Teams with Meta Quest Pro and Meta Quest 2 devices will enable people to connect and collaborate as if they are together in person.
9. What pricing options are available for accessing the report?
Pricing options include single-user, multi-user, and enterprise licenses priced at USD 4750, USD 5250, and USD 8750 respectively.
10. Is the market size provided in terms of value or volume?
The market size is provided in terms of value, measured in Million.
11. Are there any specific market keywords associated with the report?
Yes, the market keyword associated with the report is "Virtualization Software Industry," which aids in identifying and referencing the specific market segment covered.
12. How do I determine which pricing option suits my needs best?
The pricing options vary based on user requirements and access needs. Individual users may opt for single-user licenses, while businesses requiring broader access may choose multi-user or enterprise licenses for cost-effective access to the report.
13. Are there any additional resources or data provided in the Virtualization Software Industry report?
While the report offers comprehensive insights, it's advisable to review the specific contents or supplementary materials provided to ascertain if additional resources or data are available.
14. How can I stay updated on further developments or reports in the Virtualization Software Industry?
To stay informed about further developments, trends, and reports in the Virtualization Software Industry, consider subscribing to industry newsletters, following relevant companies and organizations, or regularly checking reputable industry news sources and publications.
Methodology
Step 1 - Identification of Relevant Samples Size from Population Database


Step 2 - Approaches for Defining Global Market Size (Value, Volume* & Price*)

Note*: In applicable scenarios
Step 3 - Data Sources
Primary Research
- Web Analytics
- Survey Reports
- Research Institute
- Latest Research Reports
- Opinion Leaders
Secondary Research
- Annual Reports
- White Paper
- Latest Press Release
- Industry Association
- Paid Database
- Investor Presentations

Step 4 - Data Triangulation
Involves using different sources of information in order to increase the validity of a study
These sources are likely to be stakeholders in a program - participants, other researchers, program staff, other community members, and so on.
Then we put all data in single framework & apply various statistical tools to find out the dynamic on the market.
During the analysis stage, feedback from the stakeholder groups would be compared to determine areas of agreement as well as areas of divergence


